Evaluation of a standardized physical training program for
Evaluation of a standardized physical training program for
Evaluation of a standardized physical training program for

You also want an ePaper? Increase the reach of your titles
YUMPU automatically turns print PDFs into web optimized ePapers that Google loves.
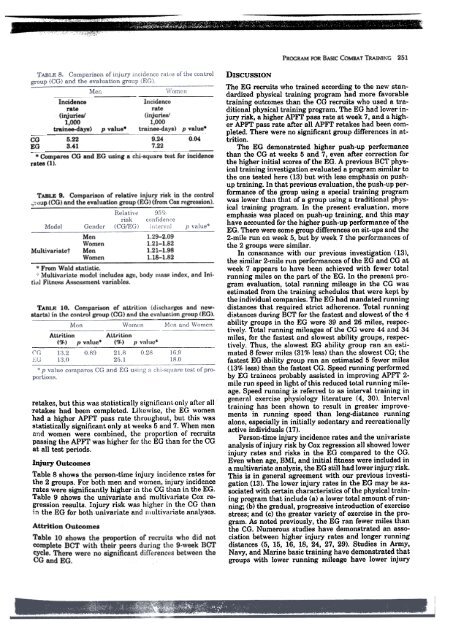
Incidence<br />
rate<br />
(injuries!<br />
1,000<br />
trainee-days)<br />
5.223.41<br />
p value*<br />
Incidence<br />
rate<br />
(injuries!<br />
1,000<br />
trainee-days) p value.<br />
CO<br />
9.24 0.04<br />
EO<br />
7.22<br />
.Compares CO and EG using a chi-square test. <strong>for</strong> incidence<br />
rates (I),<br />
TABLE 9. Comparison <strong>of</strong> relative injury risk in the control<br />
;;"mp (CG) and the evaluation group (~~) (from Cox regression).<br />
Multivariatet<br />
1.29-2.091.21-1.82<br />
Men<br />
Women<br />
Men<br />
Women<br />
~. From Wald statistic.<br />
"'" t.'Iultivariatc modcl includes age, body mass index, and lniti..IJ<br />
Fitncfifi Assessment variables.<br />
TARLK 10. Comparison <strong>of</strong> attrition (dischargcs and newstarts)<br />
in the control ""roup (CG) find the cvaluntion group (EG).<br />
Attrition Altrition<br />
(~,) p vmue* (~,) p vmu(!*<br />
retakes, but this was statisticalLy significant only after all<br />
-retakes had been completed.. Likewise, the EG women<br />
had a higher APFT pass rate throughout, but this was<br />
statistically significant only at weeks 5 and 7. When men<br />
and women were combined, the proportion <strong>of</strong> recruits<br />
passing the APFT was higher <strong>for</strong> the EG than <strong>for</strong> the CG<br />
at all test periods.<br />
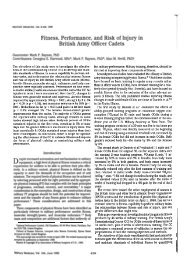
Injury Outcomes<br />
Table 8 shows the person-time injury incidence rates <strong>for</strong><br />
the 2 groups. For both men and women, injury incidence<br />
rates were significantly higher in the CG than in the EG.<br />
Table 9 shows the univariate and multivariate Cox regression<br />
results. Injury risk was higher in the CG than<br />
in the EG <strong>for</strong> both univariate and muLtivaz;ate analyses.<br />
Attrition Outcomes<br />
1.21-1.98<br />
1.l.~1..82<br />
Table 10 shows the proportion <strong>of</strong> recruits who did not<br />
complete BOT with their peers during the 9-\veek BOT<br />
cycle. There were no significant differences between the<br />
CG and EG.<br />
DISCUSSION<br />
PROGRAM FOR BASIC COMBAT TRAINlKG 251<br />
The EG recruits who trained according to the new <strong>standardized</strong><br />
<strong>physical</strong> <strong>training</strong> <strong>program</strong> had more favorable<br />
<strong>training</strong> outcomes than the CG recruits who used a traditional<br />
<strong>physical</strong> <strong>training</strong> <strong>program</strong>. The EG had lo,ver injury<br />
risk, a higher APFT pass rate at week 7, and a higher<br />
APFl' pass rate after all APFl' retakes had been completed.<br />
There were no significant group differences in attrition.<br />
The EG demonstrated higher push-up perfolmance<br />
than the CG at weeks 5 and 7, even after correction <strong>for</strong><br />
the higher initial scores <strong>of</strong> the EG. A previous BCT <strong>physical</strong><br />
<strong>training</strong> investigation evaluated a <strong>program</strong> similar to<br />
the one tested here (13) but \vith less emphasis on pushup<br />
<strong>training</strong>. In that previous evaluation, the push-up per<strong>for</strong>mance<br />
<strong>of</strong> the group using a special <strong>training</strong> <strong>program</strong><br />
was lower than that <strong>of</strong> a group using a traditional <strong>physical</strong><br />
<strong>training</strong> <strong>program</strong>. In the present evaluation. more<br />
emphasis was placed on push-up <strong>training</strong>, and this may<br />
have accounted <strong>for</strong> the higher push-up per<strong>for</strong>mance <strong>of</strong> the<br />
EG. There were some group differences on sit-ups and the<br />
2-mile run on week 5, but by week 7 the per<strong>for</strong>mances <strong>of</strong><br />
the 2 groups were similar.<br />
In consonance with our previous investigation (13),<br />
the similar 2-mile run per<strong>for</strong>mances <strong>of</strong> the EG and CG at<br />
week 7 appears to have been achieved with fewer total<br />
running miles on the part <strong>of</strong> the EG. In the present pro.<br />
gram evaluation, total running mileage in the CG was<br />
estimated from the <strong>training</strong> schedules that were kept by<br />
the individual companies. The EG had mandated running<br />
distances that required strict adhcrence. Total running<br />
distances during BCT <strong>for</strong> the fastest and slowest <strong>of</strong> the 4<br />
ability groups in the EG were 39 and 26 miles, respectively.<br />
Total running mileages <strong>of</strong> the CG were 44 and 34<br />
miles, <strong>for</strong> the fastest and s1owest abi1ity I,7fOUPS, respectively.<br />
Thus, the slowest EG ability group ran an estimated<br />
8 fewer miles (31i>f, less) than the slowest CG; the<br />
fastest EG ability group ran an estimated 5 fewer miles<br />
(13% less) than the fastest CG. Speed running per<strong>for</strong>med<br />
by EG trainees probably assisted in improving APFT 2mile<br />
run speed in light <strong>of</strong> this reduced total running mileage.<br />
Speed running is referred to as interval <strong>training</strong> in<br />
general exercise physiology literature (4, 30). Inter\'al<br />
<strong>training</strong> has been shown to result in greater improvements<br />
in running speed than long-distance running<br />
alone, especially in initially sedentary and recreationally<br />
active individuals (17).<br />
Person-time injury incidence rates and the univariate<br />
analysis <strong>of</strong> injury risk by Cox regression all showed lower<br />
injury rates and risks in the EG compared to the CG.<br />
Even when age, BMI, and initial fitness were included in<br />
a multivariate analysis, the EG still had lower injulJ' risk.<br />
This is in general agreement with our previous investigation<br />
(13). The lower injury rates in the EG may be associated<br />
with certain characteristics <strong>of</strong> the <strong>physical</strong> <strong>training</strong><br />
<strong>program</strong> that include (a) a lower total amount <strong>of</strong> running;<br />
(b) the gradual, progressive introduction <strong>of</strong> exercise<br />
stress; and (c) the greater variety <strong>of</strong> exercise in the <strong>program</strong>.<br />
As noted previously, the EG ran fewer miles than<br />
the ca. Numerous studies have demonstrated an association<br />
between higher injUl'Y rates and longer running<br />
distances (5, 15, 16, 18, 24, 27, 29). Studies in Army,<br />
Navy, and Marine basic <strong>training</strong> have demonstrated that<br />
groups with lower running mileage have lower injury