The Ore Bin - Oregon Department of Geology and Mineral Industries
The Ore Bin - Oregon Department of Geology and Mineral Industries
The Ore Bin - Oregon Department of Geology and Mineral Industries
You also want an ePaper? Increase the reach of your titles
YUMPU automatically turns print PDFs into web optimized ePapers that Google loves.
A log <strong>of</strong> all anomalies has been maintained <strong>and</strong> updated at 10-day<br />
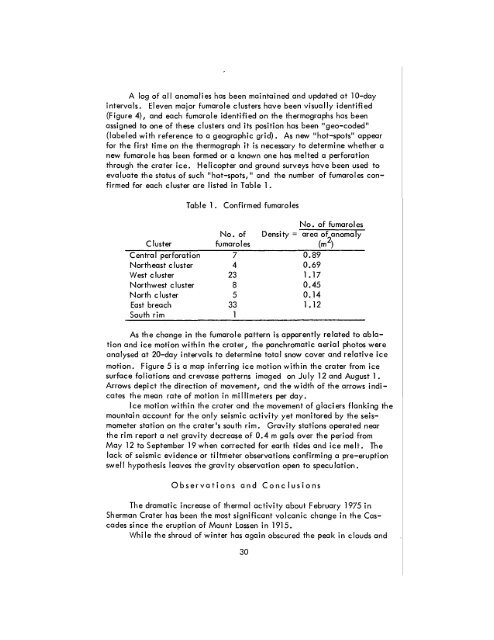
intervals. Eleven major fumarole clusters have been visually identified<br />
(Figure 4), <strong>and</strong> each fumarole identified on the thermographs has been<br />
assigned to one <strong>of</strong> these clusters <strong>and</strong> its position has been "geo-coded"<br />
(labeled with reference to a geographic grid). As new "hot-spots" appeor<br />
for the first time on the thermograph it is necessary to determine whether a<br />
new fumarole has been formed or a known one has melted a perforation<br />
through the crater ice. Helicopter <strong>and</strong> ground surveys have been used to<br />
evaluate the status <strong>of</strong> such "hot-spots," <strong>and</strong> the number <strong>of</strong> fumaroles confirmed<br />
for each cluster are listed in Table 1.<br />
Cluster<br />
Central perforation<br />
Northeast cluster<br />
West cluster<br />
Northwest cluster<br />
North cluster<br />
East breach<br />
South rim<br />
Table 1. Confirmed fumaroles<br />
No. <strong>of</strong><br />
fumaroles<br />
7<br />
4<br />
23<br />
8<br />
5<br />
33<br />
1<br />
Density =<br />
No. <strong>of</strong> fumarol es<br />
area <strong>of</strong> anoma Iy<br />
(m 2 )<br />
0.89<br />
0.69<br />
1. 17<br />
0.45<br />
0.14<br />
1. 12<br />
As the change in the fumarole pattern is apparently related to ablation<br />
<strong>and</strong> ice motion within the crater, the panchromatic aerial photos were<br />
analysed at 20-day intervals to determine total snow cover <strong>and</strong> relative ice<br />
motion. Figure 5 is a map inferring ice motion within the crater from ice<br />
surface foliations <strong>and</strong> crevasse patterns imaged on Ju Iy 12 <strong>and</strong> August 1 •<br />
Arrows depi ct the direction <strong>of</strong> movement, <strong>and</strong> the width <strong>of</strong> the arrows i ndicates<br />
the mean rate <strong>of</strong> motion in millimeters per day.<br />
Ice motion within the crater <strong>and</strong> the movement <strong>of</strong> glaciers flanking the<br />
mountain account for the only seismic activity yet monitored by the seismometer<br />
station on the crater's south rim. Gravity stations operated near<br />
the rim report a net gravity decrease <strong>of</strong> 0.4 m gals over the period from<br />
May 12 to September 19 when corrected for earth tides <strong>and</strong> ice melt. <strong>The</strong><br />
lack <strong>of</strong> seismic evidence or tiltnieter observations confirming a pre-eruption<br />
swell hypothesis leaves the gravity observation open to speculation.<br />
Observations <strong>and</strong> Conclusions<br />
<strong>The</strong> dramatic increase <strong>of</strong> thermal activity about February 1975 in<br />
Sherman Crater has been the most significant volcanic change in the Cascades<br />
since the eruption <strong>of</strong> Mount Lassen in 1915.<br />
While the shroud <strong>of</strong> winter has again obscured the peak in clouds <strong>and</strong><br />
30


