

RECENT DEVELOPMENT IN COMPUTATIONAL SCIENCE
RECENT DEVELOPMENT IN COMPUTATIONAL SCIENCE
RECENT DEVELOPMENT IN COMPUTATIONAL SCIENCE

You also want an ePaper? Increase the reach of your titles
YUMPU automatically turns print PDFs into web optimized ePapers that Google loves.
ISCS 2011 Selected Papers Vol.2 Crystal Structure Prediction Using Evolutionary Algorithm<br />
4.2 Phase Transition Simulation<br />
Result of generation series for each pressure is similar to single phase simulation. The reoptimized<br />
last stablest generation for all pressures are summarized in Table 4, and we also found metastable<br />
structures for some pressures.<br />
Table 4: Summary of the reoptimized last generation of all pressures in phase transition simulation.<br />
Press.(GPa) Struct.[S] Vol.(˚A 3 )[S] H(eV)[S] Struct.[M] Vol.(˚A 3 )[M] H(eV)[M]<br />
95 SC 10.1469 -237.29666<br />
100 SC 10.0380 -236.98075<br />
110 SC 9.8366 -236.35717 SH 9.2032 -236.28198<br />
120 SC 9.6456 -235.74231 SH 9.0181 -235.71340<br />
130 SC 9.4509 -235.15132 SH 8.8409 -235.15565<br />
140 SC 9.2821 -234.56238 d-SC 8.9916 -234.55954<br />
150 SH 8.5704 -234.04512 SC 9.1134 -233.99563<br />
160 SH 8.4116 -233.53843 SC 8.9842 -233.42351<br />
170 SH 8.2897 -233.01649 SC 8.8512 -232.86837<br />
180 SH 8.1739 -232.50200 SC 8.7302 -232.31919<br />
190 SH 8.0660 -232.00137<br />
SC = Simple Cubic; SH = simple Hexagonal; d-SC = Distorted Simple Cubic<br />
(a) (b)<br />
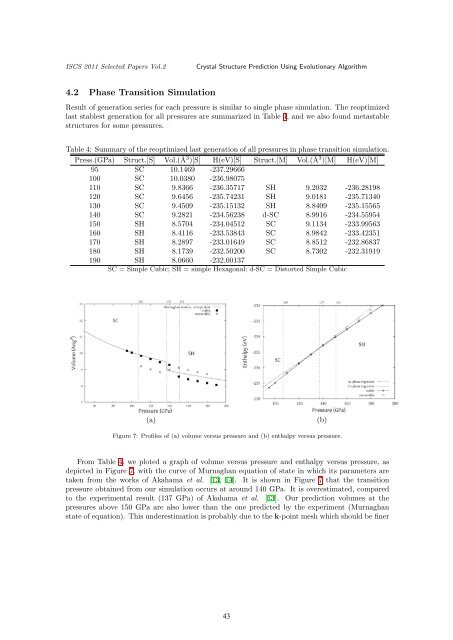
Figure 7: Profiles of (a) volume versus pressure and (b) enthalpy versus pressure.<br />
From Table 4, we ploted a graph of volume versus pressure and enthalpy versus pressure, as<br />
depicted in Figure 7, with the curve of Murnaghan equation of state in which its parameters are<br />
taken from the works of Akahama et al. [13, 14]. It is shown in Figure 7 that the transition<br />
pressure obtained from our simulation occurs at around 140 GPa. It is overestimated, compared<br />
to the experimental result (137 GPa) of Akahama et al. [13]. Our prediction volumes at the<br />
pressures above 150 GPa are also lower than the one predicted by the experiment (Murnaghan<br />
state of equation). This underestimation is probably due to the k-point mesh which should be finer<br />
43