RECENT DEVELOPMENT IN COMPUTATIONAL SCIENCE
RECENT DEVELOPMENT IN COMPUTATIONAL SCIENCE
RECENT DEVELOPMENT IN COMPUTATIONAL SCIENCE
You also want an ePaper? Increase the reach of your titles
YUMPU automatically turns print PDFs into web optimized ePapers that Google loves.
ISCS 2011 Selected Papers Vol.2 M. Koyimatu, K. Nishikawa<br />
Next we performed the HHG simulation with a two-color laser, and examined the effect of the<br />
relative phase difference between two laser pulses. We here consider the following external field<br />
with two-color {ω1, 3ω1},<br />
E(t) = E0g(t) (sin(ω1t) + sin(3ω1t + δ)) , (18)<br />
where, δ is a relative phase of two laser pulses. The reason assuming the frequency of second<br />
pulse with three times the original pulse is that we expected the interference effect of two pathway<br />
by the two pulses in the HHG spectrum may occur. We observed the small difference in some<br />
peaks of the HHG spectrum, however we did not find out the drastic change of the some ports of<br />
the HHG spectrum due to the change of the relative phase of two pulses.<br />
3. Analysis of interference effect:<br />
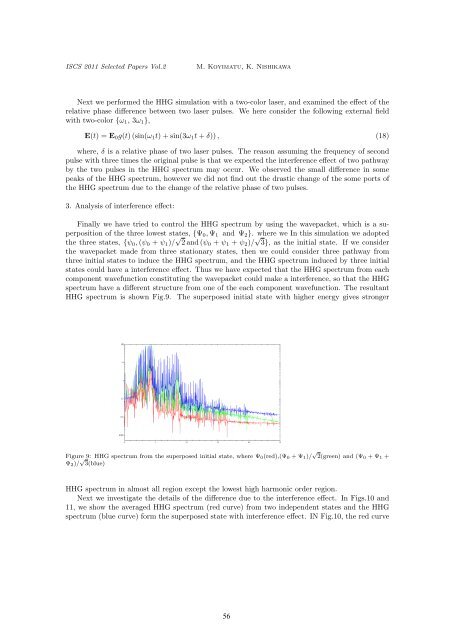
Finally we have tried to control the HHG spectrum by using the wavepacket, which is a superposition<br />
of the three lowest states, {Ψ0, Ψ1 and Ψ2}. where we In this simulation we adopted<br />
the three states, {ψ0, (ψ0 + ψ1)/ √ 2 and (ψ0 + ψ1 + ψ2)/ √ 3}, as the initial state. If we consider<br />
the wavepacket made from three stationary states, then we could consider three pathway from<br />
three initial states to induce the HHG spectrum, and the HHG spectrum induced by three initial<br />
states could have a interference effect. Thus we have expected that the HHG spectrum from each<br />
component wavefunction constituting the wavepacket could make a interference, so that the HHG<br />
spectrum have a different structure from one of the each component wavefunction. The resultant<br />
HHG spectrum is shown Fig.9. The superposed initial state with higher energy gives stronger<br />
Figure 9: HHG spectrum from the superposed initial state, where Ψ0(red),(Ψ0 + Ψ1)/ √ 2(green) and (Ψ0 + Ψ1 +<br />
Ψ2)/ √ 3(blue)<br />
HHG spectrum in almost all region except the lowest high harmonic order region.<br />
Next we investigate the details of the difference due to the interference effect. In Figs.10 and<br />
11, we show the averaged HHG spectrum (red curve) from two independent states and the HHG<br />
spectrum (blue curve) form the superposed state with interference effect. <strong>IN</strong> Fig.10, the red curve<br />
56


