

RECENT DEVELOPMENT IN COMPUTATIONAL SCIENCE
RECENT DEVELOPMENT IN COMPUTATIONAL SCIENCE
RECENT DEVELOPMENT IN COMPUTATIONAL SCIENCE

Create successful ePaper yourself
Turn your PDF publications into a flip-book with our unique Google optimized e-Paper software.
ISCS 2011 Selected Papers Vol.2 Quantum control of high harmonic generation in anharmonic potential<br />
where Γ is a damping coefficient. In order to analyze the oscillator dynamics given by the potential<br />
of Eq.16, we numerically integrate Eq.17. We assumed that the electron is rest at the origin at an<br />
initial time, namely we set the initial condition of the trajectory x(t) as {x(0) = 0 and ˙x(0) = 0}<br />
to solve the second order differential equation.<br />
As mentioned in the previous section, the power spectrum I(ω) is proportional to the absolute<br />
square of the Fourier transform of the acceleration α(t), i.e., I(ω) ∝ |α(ω)| 2 . Thus in the following,<br />
we calculate α(ω) to discuss the HHG spectrum. In the following, we will show the results of the<br />
HHG simulation in order to investigate the damping effect, the field intensity dependence, and the<br />
anharmonicity dependence to the HHG.<br />
1. The damping effect on the HHG spectrum:<br />
Here we show the typical example of the trajectory x(t) and the related HHG spectrum, where<br />
the x-axis is the harmonic order n = ω/ω1 In the following simulation we set the harmonic frequency<br />
ω0 = 1, namely we adopt this scaled unit. Here we used the parameters {v = 1, E0 = 5, and ω1 =<br />
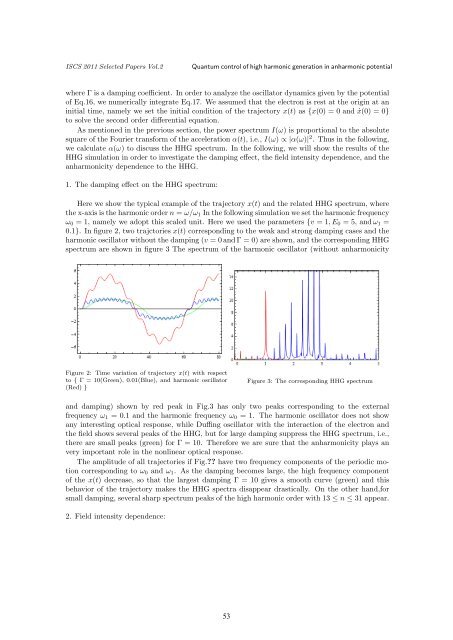
0.1}. In figure 2, two trajctories x(t) corresponding to the weak and strong damping cases and the<br />
harmonic oscillator without the damping (v = 0 and Γ = 0) are shown, and the corresponding HHG<br />
spectrum are shown in figure 3 The spectrum of the harmonic oscillator (without anharmonicity<br />
Figure 2: Time variation of trajectory x(t) with respect<br />
to { Γ = 10(Green), 0.01(Blue), and harmonic oscillator<br />
(Red) }<br />
Figure 3: The corresponding HHG spectrum<br />
and damping) shown by red peak in Fig.3 has only two peaks corresponding to the external<br />
frequency ω1 = 0.1 and the harmonic frequency ω0 = 1. The harmonic oscillator does not show<br />
any interesting optical response, while Duffing oscillator with the interaction of the electron and<br />
the field shows several peaks of the HHG, but for large damping suppress the HHG spectrum, i.e.,<br />
there are small peaks (green) for Γ = 10. Therefore we are sure that the anharmonicity plays an<br />
very important role in the nonlinear optical response.<br />
The amplitude of all trajectories if Fig.?? have two frequency components of the periodic motion<br />
corresponding to ω0 and ω1. As the damping becomes large, the high frequency component<br />
of the x(t) decrease, so that the largest damping Γ = 10 gives a smooth curve (green) and this<br />
behavior of the trajectory makes the HHG spectra disappear drastically. On the other hand,for<br />
small damping, several sharp spectrum peaks of the high harmonic order with 13 ≤ n ≤ 31 appear.<br />
2. Field intensity dependence:<br />
53