

RECENT DEVELOPMENT IN COMPUTATIONAL SCIENCE
RECENT DEVELOPMENT IN COMPUTATIONAL SCIENCE
RECENT DEVELOPMENT IN COMPUTATIONAL SCIENCE

You also want an ePaper? Increase the reach of your titles
YUMPU automatically turns print PDFs into web optimized ePapers that Google loves.
ISCS 2011 Selected Papers Vol.2 Micke Rusmerryani et al.<br />
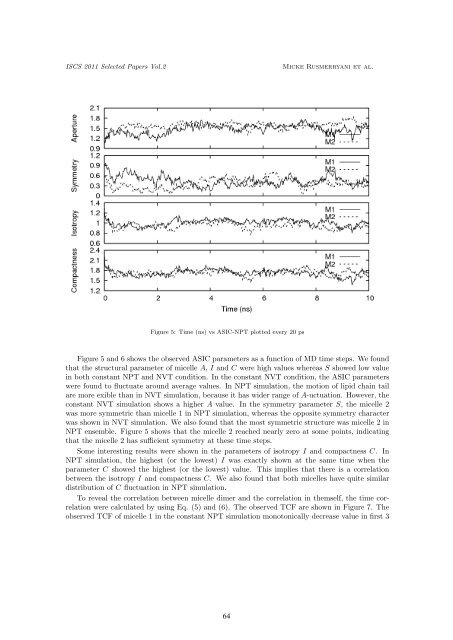
Figure 5: Time (ns) vs ASIC-NPT plotted every 20 ps<br />
Figure 5 and 6 shows the observed ASIC parameters as a function of MD time steps. We found<br />
that the structural parameter of micelle A, I and C were high values whereas S showed low value<br />
in both constant NPT and NVT condition. In the constant NVT condition, the ASIC parameters<br />
were found to fluctuate around average values. In NPT simulation, the motion of lipid chain tail<br />
are more exible than in NVT simulation, because it has wider range of A-uctuation. However, the<br />
constant NVT simulation shows a higher A value. In the symmetry parameter S, the micelle 2<br />
was more symmetric than micelle 1 in NPT simulation, whereas the opposite symmetry character<br />
was shown in NVT simulation. We also found that the most symmetric structure was micelle 2 in<br />
NPT ensemble. Figure 5 shows that the micelle 2 reached nearly zero at some points, indicating<br />
that the micelle 2 has sufficient symmetry at these time steps.<br />
Some interesting results were shown in the parameters of isotropy I and compactness C. In<br />
NPT simulation, the highest (or the lowest) I was exactly shown at the same time when the<br />
parameter C showed the highest (or the lowest) value. This implies that there is a correlation<br />
between the isotropy I and compactness C. We also found that both micelles have quite similar<br />
distribution of C fluctuation in NPT simulation.<br />
To reveal the correlation between micelle dimer and the correlation in themself, the time correlation<br />
were calculated by using Eq. (5) and (6). The observed TCF are shown in Figure 7. The<br />
observed TCF of micelle 1 in the constant NPT simulation monotonically decrease value in first 3<br />
64