Download (pdf, 114 KB) - Atoss AG
Download (pdf, 114 KB) - Atoss AG
Download (pdf, 114 KB) - Atoss AG
- TAGS
- download
- atoss
- www.atoss.com

Create successful ePaper yourself
Turn your PDF publications into a flip-book with our unique Google optimized e-Paper software.
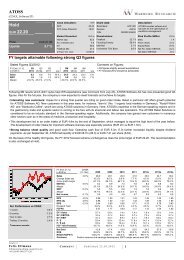
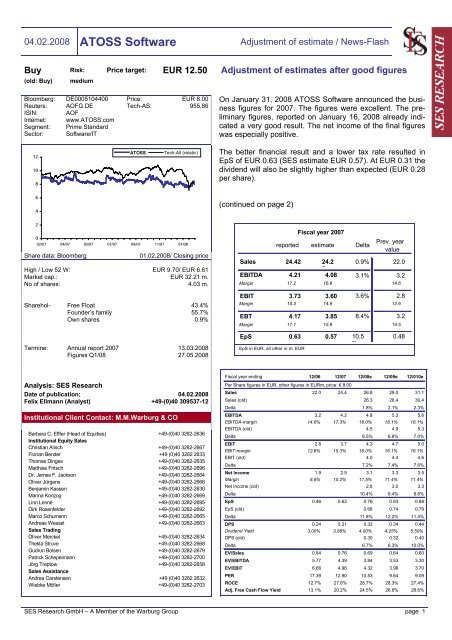
04.02.2008 ATOSS Software Adjustment of estimate / News-Flash<br />
Buy Risk: Price target: EUR 12.50<br />
(old: Buy) medium<br />
Bloomberg: DE0005104400 Price: EUR 8.00<br />
Reuters: AOFG.DE Tech-AS: 955,86<br />
ISIN: AOF<br />
Internet: www.ATOSS.com<br />
Segment: Prime Standard<br />
Sector: Software/IT<br />
12<br />
10<br />
8<br />
6<br />
4<br />
2<br />
ATOSS Tech-All (relativ)<br />
0<br />
02/07 04/07 05/07 07/07 09/07 11/07 01/08<br />
Share data: Bloomberg 01.02.2008/ Closing price<br />
High / Low 52 W: EUR 9.70/ EUR 6.61<br />
Market cap.: EUR 32.21 m.<br />
No of shares: 4.03 m.<br />
Sharehol- Free Float 43.4%<br />
Founder’s family 55.7%<br />
Own shares 0.9%<br />
Termine: Annual report 2007 13.03.2008<br />
Figures Q1/08 27.05.2008<br />
Analysis: SES Research<br />
Date of publication: 04.02.2008<br />
Felix Ellmann (Analyst) +49-(0)40 309537-12<br />
Institutional Client Contact: M.M.Warburg & CO<br />
Barbara C. Effler (Head of Equities)<br />
Institutional Equity Sales<br />
+49-(0)40 3282-2636<br />
Christian Alisch +49-(0)40 3282-2667<br />
Florian Bender +49 (0)40 3282 2633<br />
Thomas Dinges +49-(0)40 3282-2635<br />
Matthias Fritsch +49-(0)40 3282-2696<br />
Dr. James F. Jackson +49-(0)40 3282-2664<br />
Oliver Jürgens +49-(0)40 3282-2666<br />
Benjamin Kassen +49-(0)40 3282-2630<br />
Marina Konzog +49-(0)40 3282-2669<br />
Linn Lenné +49-(0)40 3282-2695<br />
Dirk Rosenfelder +49-(0)40 3282-2692<br />
Marco Schumann +49-(0)40 3282-2665<br />
Andreas Wessel<br />
Sales Trading<br />
+49-(0)40 3282-2663<br />
Oliver Merckel +49-(0)40 3282-2634<br />
Thekla Struve +49-(0)40 3282-2668<br />
Gudrun Bolsen +49-(0)40 3282-2679<br />
Patrick Schepelmann +49-(0)40 3282-2700<br />
Jörg Treptow +49-(0)40 3282-2658<br />
Sales Assistance<br />
Andrea Carstensen<br />
Wiebke Möller<br />
+49 (0)40 3282 2632<br />
+49-(0)40 3282-2703<br />
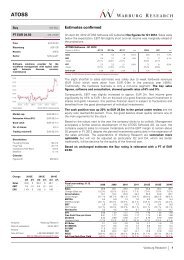
Adjustment of estimates after good figures<br />
On January 31, 2008 ATOSS Software announced the business<br />
figures for 2007. The figures were excellent. The preliminary<br />
figures, reported on January 16, 2008 already indicated<br />
a very good result. The net income of the final figures<br />
was especially positive.<br />
The better financial result and a lower tax rate resulted in<br />
EpS of EUR 0.63 (SES estimate EUR 0.57). At EUR 0.31 the<br />
dividend will also be slightly higher than expected (EUR 0.28<br />
per share).<br />
(continued on page 2)<br />
reported estimate Delta<br />
Prev. year<br />
value<br />
Sales 24.42 24.2 0.9% 22.0<br />
EBITDA 4.21<br />
0<br />
4.08 3.1% 3.2<br />
Margin 17.2 16.9 14.6<br />
EBIT 3.73 3.60 3.6% 2.8<br />
Margin 15.3 14.9 12.6<br />
EBT 4.17 3.85 8.4% 3.2<br />
Margin 17.1 15.9 14.5<br />
EpS 0.63 0.57 10.5<br />
%<br />
EpS in EUR, all other in m. EUR<br />
Fiscal year 2007<br />
SES Research GmbH – A Member of the Warburg Group page 1<br />
0.48<br />
Fiscal year ending 12/06 12/07 12/08e 12/09e 12/010e<br />
Per Share figures in EUR, other figures in EURm, price: € 8.00<br />
Sales 22.0 24.4 26.8 29.0 31.1<br />
Sales (old) 26.3 28.4 30.4<br />
Delta 1.8% 2.1% 2.3%<br />
EBITDA 3.2 4.2 4.8 5.3 5.6<br />
EBITDA-margin 14.6% 17.3% 18.0% 18.1% 18.1%<br />
EBITDA (old) 4.5 4.9 5.3<br />
Delta 6.5% 6.8% 7.0%<br />
EBIT 2.8 3.7 4.3 4.7 5.0<br />
EBIT-margin 12.6% 15.3% 16.0% 16.1% 16.1%<br />
EBIT (old) 4.0 4.4 4.6<br />
Delta 7.2% 7.4% 7.6%<br />
Net Income 1.9 2.5 3.1 3.3 3.5<br />
Margin 8.6% 10.2% 11.5% 11.4% 11.4%<br />
Net Income (old) 2.8 3.0 3.3<br />
Delta 10.4% 9.4% 8.6%<br />
EpS 0.46 0.62 0.76 0.83 0.88<br />
EpS (old) 0.68 0.74 0.79<br />
Delta 11.8% 12.2% 11.4%<br />
DPS 0.24 0.31 0.32 0.34 0.44<br />
Dividend Yield 3.00% 3.88% 4.00% 4.25% 5.50%<br />
DPS (old) 0.30 0.32 0.40<br />
Delta 6.7% 6.3% 10.0%<br />
EV/Sales 0.84 0.76 0.69 0.64 0.60<br />
EV/EBITDA 5.77 4.39 3.84 3.53 3.30<br />
EV/EBIT 6.66 4.96 4.32 3.96 3.70<br />
PER 17.39 12.90 10.53 9.64 9.09<br />
ROCE 12.7% 27.6% 28.7% 28.3% 27.4%<br />
Adj. Free Cash Flow Yield 13.1% 20.2% 24.5% 26.8% 28.6%
04.02.2008 ATOSS Software Adjustment of estimate / News-Flash<br />
ATOSS starts the year optimistically and has full order books.<br />
Order entry as well as order backlog increased considerably.<br />
Order entry of software licenses rose to EUR 6.1 m (previous<br />
year 5.4), order backlog increased to EUR 1.9 (previous year:<br />
1.3 m) per December 31, 2007. On this basis the company’s<br />
management board expects a continuation of the profitable<br />
growth trend.<br />
Due to the good figures for 2007 we adjust the estimates<br />
slightly and consider the better financial result and the lower<br />
taxes. Overall, this results in a slight increase of the PT to<br />
EUR 12.50.<br />
SES Research GmbH – A Member of the Warburg Group page 2
04.02.2008 ATOSS Software Adjustment of estimate / News-Flash<br />
Key figures (ATOSS Software)<br />
P&L (EUR m) 2006 2007e 2008e 2009e Price Data<br />
Sales 22.0 24.4 26.8 29.0 Share Price (EUR) 8.00<br />
Cost of Sales 7.2 7.6 8.6 9.3 Market Cap. (EUR m) 32<br />
Gross Profit 14.8 16.8 18.2 19.8 Enterprise Value (EUR m) 19<br />
Marketing and Administrative exp. 6.0 5.6 6.1 6.6<br />
R&D 3.9 4.6 4.8 5.1 Share Key Data 2006 2007e 2008e 2009e<br />
Other Operating Income -0.5 0.0 0.0 0.0 Earnings per Share (EUR) 0.46 0.62 0.76 0.83<br />
EBITDA 3.2 4.2 4.8 5.3 Sales per Share (EUR) 5.40 6.07 6.65 7.21<br />
Depreciation and Amortisation 0.4 0.5 0.5 0.6 Free Cash Flow per Share (EUR) 0.98 1.09 0.77 0.83<br />
- thereof Goodwill Amortisation 0.0 0.0 0.0 0.0 Dividend per Share (EUR) 0.24 0.31 0.32 0.34<br />
EBIT 2.8 3.7 4.3 4.7<br />
Financial Result 0.4 0.4 0.4 0.4 Valuation Key Data 2006 2007e 2008e 2009e<br />
Extraordinary Result 0.0 0.0 0.0 0.0 P/E 17.39 12.90 10.53 9.64<br />
EBT 3.2 4.2 4.7 5.1 P/Sales 1.48 1.32 1.20 1.11<br />
Taxes 1.3 1.7 1.7 1.8 EV/Sales 0.84 0.76 0.69 0.64<br />
Net Profit before Minorities 1.9 2.5 3.1 3.3 EV/EBITDA 5.77 4.39 3.84 3.53<br />
Net Profit 1.9 2.5 3.1 3.3 EV/EBIT 6.66 4.96 4.32 3.96<br />
Dividend Payout 1.0 1.2 1.3 1.4 P/Book 3.71 3.24 2.81 2.45<br />
Dividend Yield 3.0% 3.9% 4.0% 4.3%<br />
Cash-Flow 2006 2007e 2008e 2009e<br />
Cash Flow from Operations 2.3 3.0 3.6 3.9 No. of shares (million) 2006 2007e 2008e 2009e<br />
Free Cash Flow 4.0 4.4 3.1 3.4 Ordinary shares out 4.07 4.03 4.03 4.03<br />
Capex 0.3 0.4 0.4 0.4<br />
Balance sheet (EUR m) 2006 2007e 2008e 2009e Profitability 2006 2007e 2008e 2009e<br />
Fixed Assets 0.4 0.4 0.5 0.5 EBITDA-margin 14.6% 17.3% 18.0% 18.1%<br />
Intangible Assets 0.1 -0.1 -0.3 -0.5 EBIT-margin 12.6% 15.3% 16.0% 16.1%<br />
Net Working Capital 3.2 1.4 1.5 1.6 EBT-margin 14.5% 17.1% 17.6% 17.6%<br />
Current Assets 15.2 18.8 20.7 22.8 Net Profit-margin 8.6% 10.2% 11.5% 11.4%<br />
Cash and Cash Equivalents 10.8 13.9 15.5 17.2 ROE 21.6% 25.1% 26.7% 25.2%<br />
Equity 8.7 10.0 11.5 13.2 ROA 12.0% 13.1% 14.7% 14.6%<br />
Provisions 4.1 4.1 4.1 4.1 ROCE 12.7% 27.6% 28.7% 28.3%<br />
Financial Liabilities 0.1 0.1 0.1 0.1<br />
Net Cash 10.7 13.9 15.4 17.1 Company profile<br />
Total 15.7 19.1 20.9 22.8 The ATOSS Software <strong>AG</strong> is one of the leading providers of time management in<br />
Germany. The software of the company founded in 1987 was introduced to the<br />
market in 1991 and covers with its mature products all demands of a<br />
Reporting standard IFRS IFRS IFRS IFRS professional personnel management. ATOSS has the typical formation of a IT<br />
Fiscal year end 31.12.2006 31.12.2007 31.12.2008 31.12.2009 product company (sales of software, maintenance and service, hardware) and<br />
has currently roughly 200 employees.<br />
Growth rates 2006 2007e 2008e 2009e<br />
Sales 7.7% 11.0% 9.7% 8.4%<br />
EBITDA 169.7% 31.5% 14.2% 9.0%<br />
EBIT 391.8% 34.3% 14.8% 9.0%<br />
EBT 186.6% 30.6% 13.3% 8.2%<br />
Net Profit 314.0% 32.8% 22.7% 8.2%<br />
Dividend -95.6% 29.5% 2.9% 6.3%<br />
Cost intensities 2006 2007e 2008e 2009e<br />
COGS 32.6% 31.2% 31.9% 32.0%<br />
Marketing & Administrative / Sales 27.4% 22.9% 22.7% 22.7%<br />
R&D / Sales 17.9% 18.7% 17.9% 17.7%<br />
Management<br />
Andreas Obereder, Christof Leiber<br />
Shareholders<br />
Free float 43,4%<br />
Founder's family 55.50%<br />
Own shares 3,0%<br />
Source: Company (reported figures, SES Research (estimates and key figures), Bloomberg (share data)<br />
Disclaimer: The legal disclaimer as well as updated disclosures according to Section 34b of the German Securities Trading<br />
Act and German FinAnV on the security/securities analysed in this report can be found on internet pages at:<br />
http://www.mmwarburg.com/disclaimer/disclaimer.htm The disclaimer and disclosures provided are considered a part of<br />
this report and should be taken into account when making investment decisions based on this report.<br />
Copyright: This work including all its parts is protected by copyright. Any use beyond the limits provided by copyright law<br />
without permission is prohibited and punishable. This applies, in particular, to reproductions, translations, microfilming,<br />
and storage and processing on electronic media of the entire content or parts thereof.<br />
SES Research GmbH – A Member of the Warburg Group page 3