First Quarter 2012 results
First Quarter 2012 results
First Quarter 2012 results

Create successful ePaper yourself
Turn your PDF publications into a flip-book with our unique Google optimized e-Paper software.
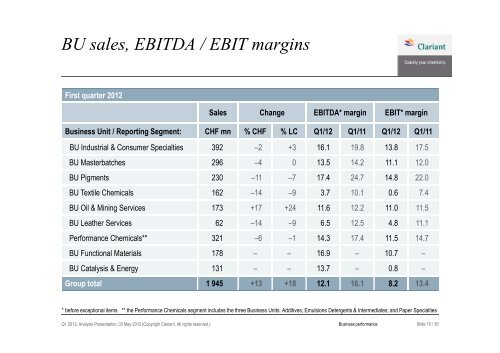
BU sales, EBITDA / EBIT margins<br />
<strong>First</strong> quarter <strong>2012</strong><br />
Q1 <strong>2012</strong>, Analysts Presentation, 03 May <strong>2012</strong> (Copyright Clariant. All rights reserved.)<br />
Sales Change EBITDA* margin EBIT* margin<br />
Business Unit / Reporting Segment: CHF mn % CHF % LC Q1/12 Q1/11 Q1/12 Q1/11<br />
BU Industrial & Consumer Specialties 392 –2 +3 16.1 19.8 13.8 17.5<br />
BU Masterbatches 296 –4 0 13.5 14.2 11.1 12.0<br />
BU Pigments 230 –11 –7 17.4 24.7 14.8 22.0<br />
BU Textile Chemicals 162 –14 –9 3.7 10.1 0.6 7.4<br />
BU Oil & Mining Services 173 +17 +24 11.6 12.2 11.0 11.5<br />
BU Leather Services 62 –14 –9 6.5 12.5 4.8 11.1<br />
Performance Chemicals** 321 –6 –1 14.3 17.4 11.5 14.7<br />
BU Functional Materials 178 – – 16.9 – 10.7 –<br />
BU Catalysis & Energy 131 – – 13.7 – 0.8 –<br />
Group total 1 945 +13 +18 12.1 16.1 8.2 13.4<br />
* before exceptional items ** the Performance Chemicals segment includes the three Business Units: Additives; Emulsions Detergents & Intermediates; and Paper Specialties<br />
Business performance Slide 10 / 35