

10 - World Journal of Gastroenterology
10 - World Journal of Gastroenterology
10 - World Journal of Gastroenterology

You also want an ePaper? Increase the reach of your titles
YUMPU automatically turns print PDFs into web optimized ePapers that Google loves.
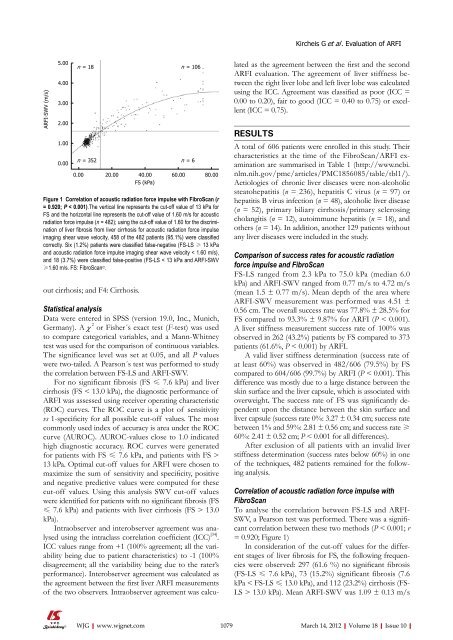
ARFI-SWV (m/s)<br />
5.00<br />
4.00<br />
3.00<br />
2.00<br />
1.00<br />
0.00<br />
n = 18 n = <strong>10</strong>6<br />
n = 352 n = 6<br />
0.00 20.00 40.00 60.00 80.00<br />
FS (kPa)<br />
Figure 1 Correlation <strong>of</strong> acoustic radiation force impulse with FibroScan (r<br />
= 0.920; P < 0.001).The vertical line represents the cut-<strong>of</strong>f value <strong>of</strong> 13 kPa for<br />
FS and the horizontal line represents the cut-<strong>of</strong>f value <strong>of</strong> 1.60 m/s for acoustic<br />
radiation force impulse (n = 482); using the cut-<strong>of</strong>f value <strong>of</strong> 1.60 for the discrimination<br />
<strong>of</strong> liver fibrosis from liver cirrhosis for acoustic radiation force impulse<br />
imaging shear wave velocity, 458 <strong>of</strong> the 482 patients (95.1%) were classified<br />
correctly. Six (1.2%) patients were classified false-negative (FS-LS ≥ 13 kPa<br />
and acoustic radiation force impulse imaging shear wave velocity < 1.60 m/s),<br />
and 18 (3.7%) were classified false-positive (FS-LS < 13 kPa and ARFI-SWV<br />
≥1.60 m/s. FS: FibroScan©.<br />
out cirrhosis; and F4: Cirrhosis.<br />
Statistical analysis<br />
Data were entered in SPSS (version 19.0, Inc., Munich,<br />
Germany). A χ 2 or Fisher´s exact test (F-test) was used<br />
to compare categorical variables, and a Mann-Whitney<br />
test was used for the comparison <strong>of</strong> continuous variables.<br />
The significance level was set at 0.05, and all P values<br />
were two-tailed. A Pearson´s test was performed to study<br />
the correlation between FS-LS and ARFI-SWV.<br />
For no significant fibrosis (FS ≤ 7.6 kPa) and liver<br />
cirrhosis (FS < 13.0 kPa), the diagnostic performance <strong>of</strong><br />
ARFI was assessed using receiver operating characteristic<br />
(ROC) curves. The ROC curve is a plot <strong>of</strong> sensitivity<br />
vs 1-specificity for all possible cut-<strong>of</strong>f values. The most<br />
commonly used index <strong>of</strong> accuracy is area under the ROC<br />
curve (AUROC). AUROC-values close to 1.0 indicated<br />
high diagnostic accuracy. ROC curves were generated<br />
for patients with FS ≤ 7.6 kPa, and patients with FS ><br />
13 kPa. Optimal cut-<strong>of</strong>f values for ARFI were chosen to<br />
maximize the sum <strong>of</strong> sensitivity and specificity, positive<br />
and negative predictive values were computed for these<br />
cut-<strong>of</strong>f values. Using this analysis SWV cut-<strong>of</strong>f values<br />
were identified for patients with no significant fibrosis (FS<br />
≤ 7.6 kPa) and patients with liver cirrhosis (FS > 13.0<br />
kPa).<br />
Intraobserver and interobserver agreement was analysed<br />
using the intraclass correlation coefficient (ICC) [34] .<br />
ICC values range from +1 (<strong>10</strong>0% agreement; all the variability<br />
being due to patient characteristics) to -1 (<strong>10</strong>0%<br />
disagreement; all the variability being due to the rater’s<br />
performance). Interobserver agreement was calculated as<br />
the agreement between the first liver ARFI measurements<br />
<strong>of</strong> the two observers. Intraobserver agreement was calcu-<br />
WJG|www.wjgnet.com<br />
lated as the agreement between the first and the second<br />
ARFI evaluation. The agreement <strong>of</strong> liver stiffness between<br />
the right liver lobe and left liver lobe was calculated<br />
using the ICC. Agreement was classified as poor (ICC =<br />
0.00 to 0.20), fair to good (ICC = 0.40 to 0.75) or excellent<br />
(ICC = 0.75).<br />
RESULTS<br />
Kircheis G et al . Evaluation <strong>of</strong> ARFI<br />
A total <strong>of</strong> 606 patients were enrolled in this study. Their<br />
characteristics at the time <strong>of</strong> the FibroScan/ARFI examination<br />
are summarised in Table 1 (http://www.ncbi.<br />
nlm.nih.gov/pmc/articles/PMC1856085/table/tbl1/).<br />
Aetiologies <strong>of</strong> chronic liver diseases were non-alcoholic<br />
steatohepatitis (n = 236), hepatitis C virus (n = 97) or<br />
hepatitis B virus infection (n = 48), alcoholic liver disease<br />
(n = 52), primary biliary cirrhosis/primary sclerosing<br />
cholangitis (n = 12), autoimmune hepatitis (n = 18), and<br />
others (n = 14). In addition, another 129 patients without<br />
any liver diseases were included in the study.<br />
Comparison <strong>of</strong> success rates for acoustic radiation<br />
force impulse and FibroScan<br />
FS-LS ranged from 2.3 kPa to 75.0 kPa (median 6.0<br />
kPa) and ARFI-SWV ranged from 0.77 m/s to 4.72 m/s<br />
(mean 1.5 ± 0.77 m/s). Mean depth <strong>of</strong> the area where<br />
ARFI-SWV measurement was performed was 4.51 ±<br />
0.56 cm. The overall success rate was 77.8% ± 28.5% for<br />
FS compared to 93.3% ± 9.87% for ARFI (P < 0.001).<br />
A liver stiffness measurement success rate <strong>of</strong> <strong>10</strong>0% was<br />
observed in 262 (43.2%) patients by FS compared to 373<br />
patients (61.6%, P < 0.001) by ARFI.<br />
A valid liver stiffness determination (success rate <strong>of</strong><br />
at least 60%) was observed in 482/606 (79.5%) by FS<br />
compared to 604/606 (99.7%) by ARFI (P < 0.001). This<br />
difference was mostly due to a large distance between the<br />
skin surface and the liver capsule, which is associated with<br />
overweight. The success rate <strong>of</strong> FS was significantly dependent<br />
upon the distance between the skin surface and<br />
liver capsule (success rate 0%: 3.27 ± 0.34 cm; success rate<br />
between 1% and 59%: 2.81 ± 0.56 cm; and success rate ≥<br />
60%: 2.41 ± 0.52 cm; P < 0.001 for all differences).<br />
After exclusion <strong>of</strong> all patients with an invalid liver<br />
stiffness determination (success rates below 60%) in one<br />
<strong>of</strong> the techniques, 482 patients remained for the following<br />
analysis.<br />
Correlation <strong>of</strong> acoustic radiation force impulse with<br />
FibroScan<br />
To analyse the correlation between FS-LS and ARFI-<br />
SWV, a Pearson test was performed. There was a significant<br />
correlation between these two methods (P < 0.001; r<br />
= 0.920; Figure 1)<br />
In consideration <strong>of</strong> the cut-<strong>of</strong>f values for the different<br />
stages <strong>of</strong> liver fibrosis for FS, the following frequencies<br />
were observed: 297 (61.6 %) no significant fibrosis<br />
(FS-LS ≤ 7.6 kPa), 73 (15.2%) significant fibrosis (7.6<br />
kPa < FS-LS ≤ 13.0 kPa), and 112 (23.2%) cirrhosis (FS-<br />
LS > 13.0 kPa). Mean ARFI-SWV was 1.09 ± 0.13 m/s<br />
<strong>10</strong>79 March 14, 2012|Volume 18|Issue <strong>10</strong>|


