Bringing Back Manas
Bringing Back Manas
Bringing Back Manas
- TAGS
- bringing
- manas
- www.ifaw.org

Create successful ePaper yourself
Turn your PDF publications into a flip-book with our unique Google optimized e-Paper software.
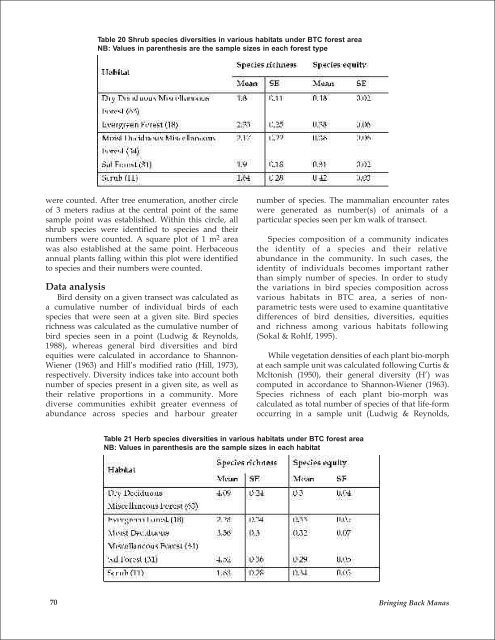
Table 20 Shrub species diversities in various habitats under BTC forest area<br />
NB: Values in parenthesis are the sample sizes in each forest type<br />
were counted. After tree enumeration, another circle<br />
of 3 meters radius at the central point of the same<br />
sample point was established. Within this circle, all<br />
shrub species were identified to species and their<br />
numbers were counted. A square plot of 1 m 2 area<br />
was also established at the same point. Herbaceous<br />
annual plants falling within this plot were identified<br />
to species and their numbers were counted.<br />
Data analysis<br />
Bird density on a given transect was calculated as<br />
a cumulative number of individual birds of each<br />
species that were seen at a given site. Bird species<br />
richness was calculated as the cumulative number of<br />
bird species seen in a point (Ludwig & Reynolds,<br />
1988), whereas general bird diversities and bird<br />
equities were calculated in accordance to Shannon-<br />
Wiener (1963) and Hill’s modified ratio (Hill, 1973),<br />
respectively. Diversity indices take into account both<br />
number of species present in a given site, as well as<br />
their relative proportions in a community. More<br />
diverse communities exhibit greater evenness of<br />
abundance across species and harbour greater<br />
number of species. The mammalian encounter rates<br />
were generated as number(s) of animals of a<br />
particular species seen per km walk of transect.<br />
Species composition of a community indicates<br />
the identity of a species and their relative<br />
abundance in the community. In such cases, the<br />
identity of individuals becomes important rather<br />
than simply number of species. In order to study<br />
the variations in bird species composition across<br />
various habitats in BTC area, a series of nonparametric<br />
tests were used to examine quantitative<br />
differences of bird densities, diversities, equities<br />
and richness among various habitats following<br />
(Sokal & Rohlf, 1995).<br />
While vegetation densities of each plant bio-morph<br />
at each sample unit was calculated following Curtis &<br />
Mcltonish (1950), their general diversity (H’) was<br />
computed in accordance to Shannon-Wiener (1963).<br />
Species richness of each plant bio-morph was<br />
calculated as total number of species of that life-form<br />
occurring in a sample unit (Ludwig & Reynolds,<br />
Table 21 Herb species diversities in various habitats under BTC forest area<br />
NB: Values in parenthesis are the sample sizes in each habitat<br />
70 <strong>Bringing</strong> <strong>Back</strong> <strong>Manas</strong>