

IMMOEAST Annual Report 2006/07
IMMOEAST Annual Report 2006/07
IMMOEAST Annual Report 2006/07

You also want an ePaper? Increase the reach of your titles
YUMPU automatically turns print PDFs into web optimized ePapers that Google loves.
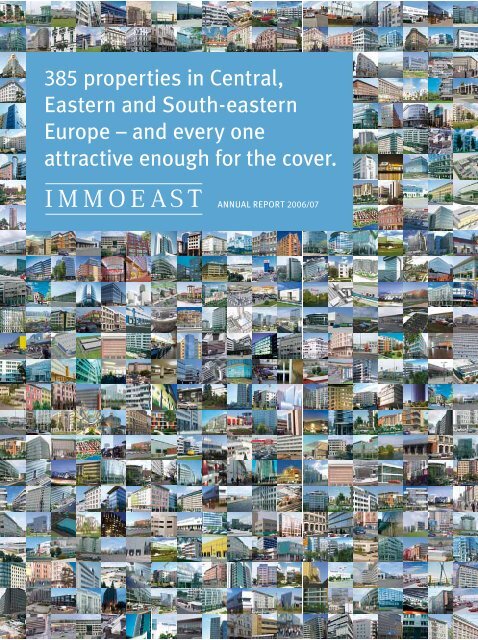
385������������������������<br />
��������������������������<br />
�����������������������<br />
��������������������������������<br />
��������������<strong>2006</strong>/<strong>07</strong>
Regional distribution of letable space as a % of the portfolio<br />
As of 30 April 20<strong>07</strong><br />
Other countries*) 4.8%<br />
Ukraine 2.2%<br />
Bulgaria 3.7%<br />
Russia 4.5%<br />
Slovakia 6.3%<br />
Czech Republic 14.1%<br />
Hungary 14.7%<br />
Think further, diversify better.<br />
<strong>IMMOEAST</strong> set not one, but numerous milestones<br />
during the past year with the expansion of business<br />
beyond its previous radius of action in Hungary,<br />
the Czech Republic, Slovakia, Poland, Romania and<br />
Bulgaria. The company entered a number of new<br />
markets during <strong>2006</strong>/<strong>07</strong> by completing the first<br />
direct investments in Russia, Ukraine, Serbia,<br />
Slovenia and Croatia – countries that are all characterised<br />
by enormous pent-up demand in the property<br />
sector. This led to the start of business activities<br />
��������������<br />
��������<br />
�������<br />
33.4% Romania<br />
16.3% Poland<br />
������<br />
��������<br />
�������<br />
������<br />
���������<br />
�������<br />
�������<br />
��������<br />
�������<br />
������<br />
*) Croatia, Serbia, Slovenia, Estonia, Lithuania<br />
in dynamic markets and created the foundation for<br />
future growth. It also broadened the distribution of<br />
investment risk and reduced the dependency on<br />
developments in individual submarkets.<br />
For <strong>IMMOEAST</strong>, responsible investment means<br />
quantifying risk as far as possible and matching<br />
this risk to the development of returns. And the<br />
expansion steps taken in <strong>2006</strong>/<strong>07</strong> meet both these<br />
objectives.
��������������������<br />
������������������<br />
��������������������<br />
Romania<br />
Poland<br />
Hungary<br />
Czech Republic<br />
Slovakia<br />
Russia<br />
� �<br />
�<br />
�<br />
�<br />
�<br />
Bulgaria<br />
Ukraine<br />
Slovenia<br />
Croatia<br />
Serbia<br />
Estonia<br />
Lithuania<br />
� �<br />
�<br />
� �<br />
�
Sector distribution of letable space as a % of the portfolio<br />
As of 30.4.20<strong>07</strong><br />
Recreation/Hotel 1.4%<br />
Parking 6.6%<br />
Residential 13.8%<br />
Logistics 14.2%<br />
Retail 30.0%<br />
More sectors, more stability, more know-how.<br />
Everysectorofthepropertymarkethasitsown<br />
speciallogic,anddemandcyclescandiffersubstantially<br />
in both form and intensity. In order to<br />
minimise the impact of these cycles on business,<br />
<strong>IMMOEAST</strong> works to achieve the broadest possible<br />
diversification by sector. The six major focal points<br />
of investment activities – offices, retail objects,<br />
logistics space, residential properties, parking and<br />
34.0% Offices<br />
recreation/hotels – are combined with a wideranging<br />
geographic commitment to form the basis<br />
for maximum earnings stability. This also makes it<br />
possiblefor<strong>IMMOEAST</strong>tobuildupextensiveknowhowinallsectorsofthepropertymarket,which<br />
represents a key competitive advantage for the<br />
development of large multi-functional projects.<br />
*) Parking spaces are not shown separately on the following page because they do not represent individual buildings but a part of objects used for various purposes.
OF RT OF RS LG OF RT RS OF RT RS OF RT LG OF RT RS OF OF<br />
LG OF RT OF RT RS OF RT RS LG OF RT OF RS RT LG OF RT LG<br />
RT<br />
OF<br />
RS<br />
OF<br />
RT<br />
OF<br />
RS<br />
����������������������������<br />
�������������������������������<br />
���������������������������<br />
�������������������������<br />
OF Offices<br />
RT Retail<br />
RS Residential<br />
RT OF OF RS RT OF OF RS RT OF RT OF LG RT OF RT<br />
OF RT RS OF LG RS RT OF OF LG RS RT OF RT LG OF<br />
RT RS LG RT OF RT LG RT RS RT OF LG RT RS OF RS<br />
RS OF RT OF RT OF RT RS OF OF RT RS OF OF LG RT<br />
RT LG OF LG RS LG OF RT OF RS OF OF RT RS RT RS<br />
OF RS RT OF RT OF RT RS LG RT LG OF LG OF LG OF<br />
RT OF OF RS OF RS OF RT OF RT OF RT OF RT RS RT<br />
RS OF RT OF RT OF RT LG RT RS OF RS LG OF RT OF<br />
LG RT LG OF OF RS OF RT OF OF RT OF OF RT OF RS<br />
OF RS OF R/H RT OF LG OF RT OF LG RT RS OF RT LG<br />
RS OF RT OF OF RS RT OF LG OF RS OF RT LG RS RT<br />
RT RS LG RS RT OF LG<br />
LG OF RT OF LG OF RS<br />
OF RT RS OF RT OF RT<br />
RT RS OF RT OF RS LG<br />
OF LG RT OF RS RT OF<br />
LG Logistics<br />
R/H Recreation/Hotel<br />
P Parking*)<br />
RT RS RT OF RT<br />
OF RT OF LG OF<br />
OF LG<br />
OF RT<br />
RS RT<br />
OF RT RS<br />
RS OF RT<br />
OF RT RS<br />
LG OF RT OF OF<br />
OF RT OF RS RT<br />
OF RS LG RT OF<br />
RT<br />
OF RS RT OF<br />
RT OF LG RT<br />
OF LG RT OF<br />
OF RT RS RT<br />
RT RS OF LG<br />
OF RT OF RS<br />
OF RS OF OF OF<br />
OF RT OF RS RT<br />
RS OF LG RT OF<br />
OF RT<br />
OF RS<br />
RT LG<br />
OF RT<br />
OF LG<br />
OF RT<br />
RS OF<br />
LG OF<br />
RT LG<br />
OF RS<br />
LG OF<br />
OF RT<br />
LG OF<br />
OF RT<br />
RS RT<br />
RT OF<br />
LG<br />
OF<br />
RT<br />
OF<br />
RT<br />
OF<br />
RT<br />
RS<br />
RT<br />
LG<br />
RT<br />
RS<br />
RT<br />
OF<br />
LG<br />
RT
20<strong>07</strong>/08 investment programme of EUR 6 billion by region<br />
As of 30.4.20<strong>07</strong><br />
Community of<br />
Independent<br />
States (CIS) 23.9%<br />
Central and Eastern<br />
Europe (CEE) 32.8%<br />
20<strong>07</strong>/08investmentprogrammeofEUR6billionbytypeofproject<br />
As of 30.4.20<strong>07</strong><br />
Strategic<br />
partnerships 9.0%<br />
Investment<br />
Properties 25.0%<br />
20<strong>07</strong>/08investmentprogrammeofEUR6billionbysector<br />
As of 30.4.20<strong>07</strong><br />
Residential 4.0%<br />
Logistics 5.0%<br />
Offices 30.0%<br />
Additional information on the <strong>IMMOEAST</strong> growth course is provided under<br />
“Future Developments”, beginning on page 56 of this annual report.<br />
Wedon’tlooktowardthefuture–wecreateit.<br />
The20<strong>07</strong>/08financialyearwillalsobecharacterised<br />
by growth for <strong>IMMOEAST</strong>, with the implementation<br />
of a record investment programme that<br />
isexpectedtoreachnearlyEUR6billion.These<br />
projects will be financed with funds generated by<br />
the capital increase in May 20<strong>07</strong>, which raised<br />
equity of EUR 2.84 billion. When added to an<br />
average debt component of 50%, that means the<br />
financing for the entire investment programme<br />
is now available. All projects were evaluated by<br />
the <strong>IMMOEAST</strong> asset managers at the start of<br />
43.3% South-eastern Europe (SEE)<br />
66.0% Development projects<br />
61.0% Retail<br />
The focal point of investments<br />
will shift from Central and Eastern<br />
Europe to the South-east European<br />
countries of Bulgaria and Romania<br />
as well as Russia and Ukraine.<br />
In order to safeguard profitability,<br />
roughly two-thirds of the planned<br />
investments will represent development<br />
projects.<br />
Office space will decline as a percentage<br />
of the portfolio in favour of<br />
retail areas – apartments and logistics<br />
centres will continue to provide<br />
key support for diversification.<br />
the20<strong>07</strong>/08financialyearandapprovedbythe<br />
Supervisory Board. These investments will lead<br />
to a major shift in the <strong>IMMOEAST</strong> portfolio. The<br />
geographical focus will move from Central and<br />
EasternEuropetoSouth-easternEurope–and<br />
investments in the retail sector will increase,<br />
while office space will decline substantially in<br />
relation to the total portfolio. Investments in<br />
development projects will grow dramatically,<br />
and should represent roughly two-thirds of the<br />
total programme in 20<strong>07</strong>/08.
����������������������������<br />
��������������������<br />
20<strong>07</strong>/08
�������������������385�<br />
�������������������������<br />
�����������������13������<br />
����������������������6�<br />
�������������������������<br />
����������������������<br />
�������������6����������<br />
���������������������
And just what does<br />
this bring you?<br />
����������������������<br />
19.3������������������<br />
����������������������������<br />
�������������������<br />
���������2003�
8 <strong>IMMOEAST</strong> <strong>Annual</strong> <strong>Report</strong> <strong>2006</strong>/<strong>07</strong><br />
Key Data on <strong>IMMOEAST</strong> AG<br />
Corporate Data<br />
<strong>2006</strong>/<strong>07</strong> Change in % 2005/06<br />
Revenues in EUR mill. 192.9 141.1% 80.0<br />
Operating profit (EBIT) in EUR mill. 541.3 246.4% 156.3<br />
Earnings before tax (EBT) in EUR mill. 645.5 252.8% 182.9<br />
Gross cash flow in EUR mill. 63.4 154.9% 24.9<br />
Return on equity (ROE) in % 10.9% 24.6% 8.7%<br />
Return on capital employed (ROCE) 1) in % 9.3% 3.9% 8.9%<br />
Equity in EUR mill. (including minority interest) 4,923.1 196.2% 1,662.0<br />
Equity as a % of the balance sheet total 73.2% 18.3% 61.8%<br />
Equity ratio in % (based on contracted investments) 46.8% 38.9% 33.7%<br />
Balance sheet total in EUR mill. 6,728.2 150.4% 2,687.5<br />
Net asset value per share in EUR 10.2% 20.4% 8.4%<br />
Property Data<br />
Number of properties 385 231.9% 116<br />
Thereof investments in other companies2) 172 266.0% 47<br />
Letable space in sqm 4,891,316 245.7% 1,414,961<br />
Thereof investments in other companies2) 1,491,741 497.8% 249,520<br />
Fair value of properties in EUR mill. (including contracted investments) 9,019.2 115.7% 4,181.0<br />
Thereof investments in other companies2) 786.9 345.3% 176.7<br />
Investments in EUR mill. 4,857.6 46.9% 3,305.7<br />
Stock Exchange Data<br />
Earnings per share in EUR 1.02 34.8% 0.76<br />
Price/earnings ratio 10.2 - 11.0<br />
Share price at end of period in EUR 10.4 20.9% 8.6<br />
Number of shares in mill. 555.9 150.0% 222.4<br />
Market capitalisation at end of period in EUR mill. 5,781.2 202.3% 1,912.2<br />
1) NOPAT (net operating profit after tax) in relation to capital employed.<br />
2) Investments in other companies include associates consolidated at equity and holdings<br />
recorded as financial instruments in accordance with IAS 39.
Contents<br />
<strong>Report</strong> by the Executive Board 11<br />
Highlights <strong>2006</strong>/<strong>07</strong> 12<br />
Key investments in review 14<br />
<strong>IMMOEAST</strong> in European Comparison 1<br />
Business Model and Strategy 20<br />
Broad-based diversification of the property portfolio 21<br />
Strategic investments 22<br />
Management contract with Constantia Privatbank 26<br />
Property valuation 2<br />
Outlook and strategic goals 29<br />
Regional Portfolio Structure 30<br />
Business activities by region 32<br />
Sector Portfolio Structure 36<br />
Broad diversification across all major property sectors 36<br />
Investor Relations 46<br />
Capital market & development of share 47<br />
Corporate Governance 51<br />
<strong>Report</strong> of the Supervisory Board 54<br />
Future Developments 56<br />
Investment programme 20<strong>07</strong>/0 57<br />
Subsequent events 59<br />
Property Portfolio 62<br />
Development of Business 69<br />
Consolidated Financial Statements 101<br />
Consolidated balance sheet 102<br />
Consolidated income statement 103<br />
Statement of changes in equity 104<br />
Consolidated cash flow statement 105<br />
Segment reporting 106<br />
Notes to the financial statements 116<br />
Auditor’s report 242<br />
Analysis of results 244<br />
Valuation certificates 257<br />
Service and Glossary 264<br />
<strong>Report</strong> by the Executive Board<br />
Highlights <strong>2006</strong>/<strong>07</strong><br />
Business Model and Strategy<br />
Portfolio Structure<br />
Corporate Governance and Outlook<br />
Property Portfolio<br />
Development of Business<br />
Consolidated Financial Statements<br />
Service and Glossary
<strong>Report</strong> by the<br />
Executive Board<br />
<strong>IMMOEAST</strong> HAS STILL<br />
NOTREACHEDITSPEAK<br />
����������������������������������������������������<br />
�����������������������������������������������<br />
������������
Dear Shareholders,<br />
The goals set by <strong>IMMOEAST</strong> for <strong>2006</strong>/<strong>07</strong> can only be described as ambitious. Investments with a<br />
total volume of EUR 5 billion represent the most extensive growth programme ever undertaken by a<br />
property company in Central and Eastern Europe – and the results show that we were not only able<br />
to meet, but in some cases also exceed these far-reaching targets by a significant margin. The entire<br />
investment programme was prepared in detail at the start of the financial year and completed in full<br />
after the first three quarters. These activities allowed <strong>IMMOEAST</strong> to clearly expand its leading market<br />
position. An increase of 115.7% in the property portfolio to EUR 9.0 billion ranked the company<br />
far ahead of all competitors in the region. However, another factor just as important as the growth<br />
in size was the further improvement in the quality of the property portfolio: both the geographic<br />
and sector diversification were broadened during <strong>2006</strong>/<strong>07</strong>, and this further increased the stability<br />
of earnings. <strong>IMMOEAST</strong> also expanded its activities in the development business and substantially<br />
strengthened its presence in the profitable emerging markets of South-eastern Europe. Furthermore,<br />
we completed our first investments in the rapidly growing and lucrative residential sector<br />
during the past year. These measures will play an important role in safeguarding the previous high<br />
level of earnings in the future.<br />
Our investments in numerous leading property developers have a special strategic importance<br />
– above all TriGránit, a company that plans to compile a development portfolio of several billion<br />
Euros over the coming years. These investments create interesting prospects for strong earnings<br />
growth, and also give <strong>IMMOEAST</strong> preferential access to acquire the developed properties after<br />
completion.<br />
The dynamic growth recorded during the past year led to an enormous improvement in the company’s<br />
financial indicators, even though the extensive commitments in development projects will only<br />
have a full impact on earnings in later years. Revenues rose by 141.1% to EUR 192.9 million and<br />
EBIT by 246.4% to EUR 541.3 million. Earnings per share – the most important indicator for you as<br />
a shareholder – increased from EUR 0.76 to EUR 1.02.<br />
This positive and sustainable development was also honoured by the capital market. In spite of difficult<br />
conditions on global stock exchanges, <strong>IMMOEAST</strong> was able to place a EUR 2.75 billion capital<br />
increase at the start of the financial year without difficulty. In addition, the price of the <strong>IMMOEAST</strong><br />
share rose by nearly 21% during <strong>2006</strong>/<strong>07</strong>.<br />
The outlook for the future development of <strong>IMMOEAST</strong> is also highly promising. A EUR 2.84 billion<br />
capital increase placed at the start of the 20<strong>07</strong>/08 financial year created the financial basis to<br />
continue our growth course. We were able to realise approximately EUR 2.3 billion of the planned<br />
investment volume of roughly EUR 6 billion by the end of June. The property portfolio, including<br />
contracted investments, is forecasted to reach nearly EUR 13 billion by the end of this financial<br />
year. <strong>IMMOEAST</strong> now has the necessary foundation to maintain and expand its dominant position in<br />
Central, Eastern and South-eastern Europe, one of the fastest growing and most attractive property<br />
markets in the world. We are convinced that you, as a shareholder, will be able to profit from the<br />
dynamic growth of <strong>IMMOEAST</strong>.<br />
Norbert Gertner,<br />
Member of the Executive Board<br />
Karl Petrikovics,<br />
Chief Executive Officer<br />
<strong>Report</strong> by the Executive Board 11<br />
Highlights <strong>2006</strong>/<strong>07</strong><br />
Business Model and Strategy<br />
Portfolio Structure<br />
Corporate Governance and Outlook<br />
Property Portfolio<br />
Development of Business<br />
Consolidated Financial Statements<br />
Service and Glossary<br />
All targets met or<br />
clearly exceeded<br />
Strategic investments in<br />
leading property developers<br />
Significant improvement in<br />
all earnings indicators<br />
<strong>Annual</strong> share performance<br />
rises to nearly 21%<br />
Capital increase in May 20<strong>07</strong><br />
creates basis for for further further<br />
dynamic growth growth
Highlights <strong>2006</strong>/<strong>07</strong><br />
Largest capital<br />
increase by a<br />
European property<br />
company<br />
During the <strong>2006</strong>/<strong>07</strong> financial<br />
year <strong>IMMOEAST</strong> created a<br />
solid foundation for strong<br />
growth with a successful capital<br />
increase in June <strong>2006</strong>. This<br />
EUR 2.75 billion issue represented<br />
the largest capital<br />
market transaction by a European<br />
property company to<br />
date and, since that time, has<br />
only been exceeded by the<br />
<strong>IMMOEAST</strong> capital increase in<br />
May 20<strong>07</strong>.<br />
EUR 5 billion<br />
invested<br />
A record investment programme<br />
of EUR 5 billion was<br />
realised during <strong>2006</strong>/<strong>07</strong>.<br />
The detailed preparations<br />
were completed at the start<br />
of the financial year, which<br />
permitted the conclusion of<br />
all transactions during the<br />
first three quarters. This<br />
expansion made <strong>IMMOEAST</strong><br />
the fastest growing property<br />
company in the region, with a<br />
steadily increasing lead over<br />
its competitors.<br />
Investment<br />
in TriGránit<br />
In August <strong>2006</strong> <strong>IMMOEAST</strong><br />
acquired a 25% stake in<br />
the Hungarian TriGránit, the<br />
leading property developer in<br />
Central, Eastern and Southeastern<br />
Europe. This firm,<br />
which has already compiled a<br />
development portfolio with a<br />
volume of roughly EUR 8 billion<br />
in 11 countries, is a specialist<br />
for large assignments,<br />
in particular multi-functional<br />
urban development projects.<br />
All completed objects are<br />
first offered to <strong>IMMOEAST</strong> for<br />
acquisition, which will create<br />
excellent opportunities for<br />
investment and growth over<br />
the middle and long-term.<br />
Number 2 in<br />
Continental Europe<br />
The capital increase and<br />
strong development of<br />
the share price pushed<br />
<strong>IMMOEAST</strong> forward in the<br />
ranking of major listed<br />
property companies in<br />
Europe. Market capitalisation<br />
of EUR 5.78 billion at the end<br />
of the <strong>2006</strong>/<strong>07</strong> financial year<br />
made <strong>IMMOEAST</strong> the number<br />
four in Continental Europe.<br />
At the end of June 20<strong>07</strong>,<br />
<strong>IMMOEAST</strong> advanced<br />
to the number two position<br />
with market capitalisation of<br />
more than EUR 8.73 billion.<br />
Start in Ukraine,<br />
Russia and<br />
ex-Yugoslavia<br />
The geographic diversification<br />
of the property portfolio<br />
was substantially broadened<br />
during <strong>2006</strong>/<strong>07</strong>. Activities<br />
focused on the rapidly growing<br />
and profitable markets of<br />
Ukraine and Russia, while the<br />
first direct investments were<br />
made in Slovenia, Croatia and<br />
Serbia, the successor states<br />
of the former Yugoslavia.<br />
<strong>IMMOEAST</strong> is now present in<br />
13 countries and all key markets<br />
of Central, Eastern and<br />
South-eastern Europe as well<br />
as the former Soviet Union.<br />
Investment in<br />
Adama<br />
<strong>IMMOEAST</strong> significantly<br />
strengthened its business<br />
activities in the profitable<br />
residential sector by acquiring<br />
a stake in Adama, a leading<br />
Romanian developer of<br />
residential properties. Adama<br />
intends to use Romania as a<br />
base for expansion throughout<br />
the entire region. Specific<br />
projects are currently in the<br />
preparation stage, above all<br />
in the neighbouring countries<br />
of Ukraine, the Republic of<br />
Moldavia and Serbia. Adama<br />
has a development portfolio<br />
with 8,000 apartments, and<br />
preparations for 20 other<br />
projects are in progress.<br />
These apartment complexes<br />
are not held as long-term<br />
investments, but sold as<br />
condominium units.<br />
20.9% increase in<br />
share price<br />
The shareholders of<br />
<strong>IMMOEAST</strong> were again able<br />
to enjoy an excellent return<br />
in <strong>2006</strong>/<strong>07</strong>. With an increase<br />
of 20.9% in the share price,<br />
this financial year marked<br />
the highest-ever performance<br />
for the company’s owners.<br />
The average annual performance<br />
of the <strong>IMMOEAST</strong><br />
share since the initial public<br />
offering in December 2003<br />
rose to 19.3%.
EBIT: +246.4%<br />
in EUR million<br />
As of 30 April 20<strong>07</strong><br />
600<br />
500<br />
400<br />
300<br />
200<br />
100<br />
0<br />
2003/04 2004/05 2005/06 <strong>2006</strong>/<strong>07</strong><br />
Strong growth in revenues<br />
and rising property prices led<br />
to an improvement of more<br />
than 246% or EUR 541.3<br />
million in operating profit<br />
(EBIT) during <strong>2006</strong>/<strong>07</strong>. This<br />
represents the second year in<br />
succession with a more than<br />
twofold increase in EBIT.<br />
Net Asset Value:<br />
+21.4%<br />
in EUR per share<br />
As of 30 April 20<strong>07</strong><br />
12<br />
10<br />
8<br />
6<br />
4<br />
2<br />
0<br />
2003/04 2004/05 2005/06 <strong>2006</strong>/<strong>07</strong><br />
Over 333.5 million new shares<br />
were issued as part of the<br />
capital increase in <strong>2006</strong>/<strong>07</strong>.<br />
In spite of this development,<br />
net asset value, which<br />
represents the inherent value<br />
of the stock, rose by 21.4%<br />
to EUR 10.2 per share. The<br />
net asset value of <strong>IMMOEAST</strong><br />
tripled to an absolute total<br />
of nearly EUR 5.6 billion.<br />
Revenues:<br />
+141.1%<br />
in EUR million<br />
As of 30 April 20<strong>07</strong><br />
200<br />
150<br />
100<br />
50<br />
0<br />
2003/04 2004/05 2005/06 <strong>2006</strong>/<strong>07</strong><br />
Growth of 146% in rental<br />
income to EUR 146.2 million<br />
supported a twofold increase<br />
in Group revenues – which<br />
include operating costs,<br />
proceeds on the sale of properties<br />
and other income – to<br />
more than EUR 192.9 million.<br />
<strong>Report</strong> by the Executive Board 13<br />
Highlights <strong>2006</strong>/<strong>07</strong><br />
Business Model and Strategy<br />
Portfolio Structure<br />
Corporate Governance and Outlook<br />
Property Portfolio<br />
Development of Business<br />
Consolidated Financial Statements<br />
Service and Glossary<br />
Gross Cash Flow:<br />
+154.9%<br />
in EUR million<br />
As of 30 April 20<strong>07</strong><br />
60<br />
50<br />
40<br />
30<br />
20<br />
10<br />
0<br />
2003/04 2004/05 2005/06 <strong>2006</strong>/<strong>07</strong><br />
Gross cash flow rose by<br />
154.9% to EUR 63.4 million<br />
– and demonstrates the<br />
steady improvement in<br />
the internal financing power<br />
of <strong>IMMOEAST</strong>.
14 <strong>IMMOEAST</strong> <strong>Annual</strong> <strong>Report</strong> <strong>2006</strong>/<strong>07</strong><br />
i 1 i<br />
Haller Gardens<br />
i 2 i<br />
Antim Tower<br />
i 3 i<br />
Golden Babylon<br />
i 4 i<br />
IMAK Portfolio<br />
Investment in<br />
TriGránit<br />
Key investments in review<br />
<strong>IMMOEAST</strong> accelerated its investment activity to a new record level in <strong>2006</strong>/<strong>07</strong>. A total of 269 transactions<br />
with a total volume of EUR 5 billion were completed during this period. Acquisitions focused<br />
primarily on very large objects, with no less than 21 transactions reaching a dimension of more than<br />
EUR 100 million. The geographic focus of investments was placed on South-eastern Europe, while<br />
the sector distribution showed a concentration on retail properties.<br />
At the start of the financial year, <strong>IMMOEAST</strong><br />
acquired the Haller Gardens, an office project<br />
in Budapest with 49,000 sqm of letable space.<br />
The object is under construction by AIG Lincoln,<br />
one of the best known property developers in<br />
the world. Completion is scheduled for the summer<br />
of 2008, and the investment totals nearly<br />
EUR 80 million.<br />
In December <strong>2006</strong> <strong>IMMOEAST</strong> purchased a<br />
mixed use property in the Bulgarian capital<br />
of Sofia with roughly 10,000 sqm of letable<br />
space. An additional 90,000 sqm of modern<br />
office and retail areas will be added<br />
to this object in several stages by 2012.<br />
The investment for the Antim Tower with more than<br />
100,000 sqm of letable space will total approximately<br />
EUR 150 million.<br />
<strong>IMMOEAST</strong> completed its first direct investment in Russia<br />
during June <strong>2006</strong> with the purchase of two shopping<br />
centres in Moscow. The Golden Babylon I and II have a<br />
combined total of nearly 60,000 sqm of letable space<br />
and are fully occupied. This investment has a volume of<br />
EUR 198 million.<br />
In June <strong>2006</strong> <strong>IMMOEAST</strong> increased its previous 56.6% stake in<br />
IMAK CEE to 100%. This firm holds a portfolio of 11 fully occupied<br />
logistics and office properties in Hungary and Poland. The properties<br />
have letable space totalling 165,000 sqm and a fair value<br />
of roughly EUR 280 million.<br />
The largest investment of the <strong>2006</strong>/<strong>07</strong> financial year was closed<br />
in August <strong>2006</strong>: <strong>IMMOEAST</strong> acquired a 25% stake in the Hungarian<br />
TriGránit, the leading property developer in Central, Eastern<br />
and South-eastern Europe, for EUR 400 million. This highly profitable company is specialised in<br />
very large assignments and has completed a number of outstanding urban development projects.<br />
TriGránit currently holds a development portfolio with a value of EUR 8 billion in 11 countries.<br />
1<br />
2<br />
3<br />
4
6<br />
5<br />
7<br />
Key investments<br />
In August <strong>2006</strong> <strong>IMMOEAST</strong> acquired the majority stake in<br />
one of the largest office development projects in the Polish<br />
capital. The Equator Office in the dynamic Jerozolimskie<br />
business corridor has 125,000 sqm of letable space, comprising<br />
85,000 sqm of offices as well as warehouse and<br />
retail areas and underground garages. The investment volume<br />
totals EUR 190 million.<br />
Together with local partners <strong>IMMOEAST</strong> started work on<br />
four residential projects in August <strong>2006</strong> with a total of<br />
2,000 apartments in Poland, Slovakia, Romania and Bulgaria.<br />
This represents the first large-scale investment in the<br />
construction of condominium facilities. The four projects<br />
have a total volume of EUR 180 million.<br />
Another major investment was completed during August<br />
<strong>2006</strong> with the acquisition of the Jandarmeriei Office in<br />
Bucharest. Roughly 40,000 sqm of letable space will be<br />
constructed on this site by 2010 at a total investment of<br />
EUR 80 million. <strong>IMMOEAST</strong> also acquired the adjoining<br />
project, Jandarmeriei Residential, which involves the construction<br />
of 360 apartments.<br />
<strong>IMMOEAST</strong> completed its first investment in Slovenia<br />
during September <strong>2006</strong> with the purchase of two<br />
specialty shopping centres. These objects are<br />
located in Kranj and Nove Mesto, and have a total of<br />
19,000 sqm that is fully occupied. The objects have<br />
an investment volume of EUR 22.5 million.<br />
The Diamond Point office building in Prague was<br />
acquired during autumn <strong>2006</strong>. This object has<br />
27,000 sqm of letable space that is fully rented to<br />
well-known companies through long-term contracts.<br />
The investment totals roughly EUR 70 million. In a<br />
subsequent step 49% of the shares will be sold to<br />
the Allianz Group, one of the lead tenants.<br />
In autumn <strong>2006</strong> <strong>IMMOEAST</strong> increased its stake in the Mester Business Park from 45% to 75%. This<br />
major project will involve the construction of up to 250,000 sqm in letable space at a central location<br />
by 2010. The first stage of construction at the Mester Park was completed shortly after the end<br />
of the <strong>2006</strong>/<strong>07</strong> financial year.<br />
The purchase of the Galerija Apartmani (Francuska) residential project in August <strong>2006</strong> marked<br />
the entry of <strong>IMMOEAST</strong> into the promising Serbian property market. Plans call for the construction<br />
of more than 100 apartments, 1,100 sqm of offices, 1,000 sqm of retail areas and 184 underground<br />
garage spaces at a central location by the end of 2008. The investment volume equals<br />
EUR 13.3 million, and all apartments will be sold as condominiums.<br />
<strong>Report</strong> by the Executive Board 15<br />
Highlights <strong>2006</strong>/<strong>07</strong><br />
Business Model and Strategy<br />
Portfolio Structure<br />
Corporate Governance and Outlook<br />
Property Portfolio<br />
Development of Business<br />
Consolidated Financial Statements<br />
Service and Glossary<br />
i 5 i<br />
Equator<br />
Residential projects with a<br />
total of 2,000 apartments<br />
i 6 i<br />
Jandarmeriei Office<br />
Specialty shopping centres<br />
in Slovenia<br />
i 7 i<br />
Diamond Point<br />
Acquisition of majority<br />
stake in Mester Park<br />
Galerija Galerija Apartmani<br />
Apartmani<br />
(Francuska) residential<br />
project
16 <strong>IMMOEAST</strong> <strong>Annual</strong> <strong>Report</strong> <strong>2006</strong>/<strong>07</strong><br />
i 8 i<br />
Polus Center Cluj<br />
i 9 i<br />
Mokotow Business Park<br />
i 10 i<br />
5th Avenue<br />
i 11 i<br />
Brama Zachodnia<br />
i 12 i<br />
Grand Center Zagreb<br />
Grand Center Pardubice<br />
<strong>IMMOEAST</strong> carried out its largest investment in<br />
Romania during November <strong>2006</strong> with the acquisition<br />
of the Polus Center Cluj, a shopping centre<br />
that is located in Cluj in the booming province of<br />
Transylvania. With 100,000 sqm of letable space,<br />
it is one of the largest shopping centres in Romania.<br />
The investment totals EUR 210 million, and<br />
88% of the space was let several months before<br />
the completion of construction.<br />
In November <strong>2006</strong> <strong>IMMOEAST</strong> acquired the Mokotow<br />
Business Park through a 50:50 joint venture<br />
with Heitman European Property Partners, a firm<br />
in which <strong>IMMOEAST</strong> holds a stake of 7.13%. The<br />
Mokotow is the largest office complex in Warsaw<br />
and comprises nine buildings with 136,000<br />
sqm of letable space and an excellent level of<br />
occupancy. In addition, the building permit was<br />
granted for an additional office building. The total<br />
investment volume equals EUR 260 million.<br />
The 5th Avenue shopping centre in Moscow was purchased in<br />
November <strong>2006</strong>. This object is located in the Shukino district<br />
in the north-western section of Moscow and has 45.000 sqm<br />
of letable space, which is fully rented to well-known international<br />
retail chains. The investment in this project amounts to<br />
EUR 114 million.<br />
<strong>IMMOEAST</strong> acquired the Brama Zachodnia office property<br />
in Warsaw during autumn <strong>2006</strong>. This object is located in the<br />
Jerozolimskie business corridor and has 36,000 sqm of space<br />
that is fully let to major international corporations. <strong>IMMOEAST</strong><br />
invested a total of EUR 80 million in this project.<br />
In November <strong>2006</strong> <strong>IMMOEAST</strong> completed its first investment<br />
in Croatia by acquiring the recently completed Grand Center in<br />
the capital city of Zagreb. The property’s 21,400 sqm are fully let, and the largest<br />
tenants are international corporations that include Generali and Strabag.<br />
The investment volume totals EUR 40 million.<br />
The Grand Center Pardubice shopping mall in the North Bohemian city of<br />
Pardubice was acquired in November <strong>2006</strong>. This fully let object has 18,000<br />
sqm of space and a total investment volume of EUR 28 million.<br />
8<br />
10<br />
9<br />
11
13<br />
In December <strong>2006</strong> <strong>IMMOEAST</strong> acquired three fully let objects with a total of<br />
73,700 sqm in the BB Centrum office park, one of the top office locations in<br />
Prague. The investment volume totals EUR 160 million.<br />
16<br />
12<br />
The Polus Center in Constanta<br />
was purchased in March 20<strong>07</strong>.<br />
This object has 90,000 sqm<br />
and is scheduled for completion<br />
in autumn 2008. It will<br />
become the largest shopping<br />
centre in this Black See<br />
metropolis, which has a population<br />
of more than 300,000.<br />
The investment by <strong>IMMOEAST</strong><br />
amounted to EUR 185 million.<br />
In March 20<strong>07</strong> <strong>IMMOEAST</strong><br />
acquired a large portfolio with<br />
five objects in Prague and Brno.<br />
Roughly two-thirds of the 110,000<br />
sqm letable space represent offices,<br />
while the remainder comprises<br />
retail areas. Two of the objects<br />
are still under construction.<br />
The investment volume equals<br />
EUR 210 million, making this<br />
project the largest commitment<br />
by <strong>IMMOEAST</strong> to date in the Czech<br />
Republic.<br />
<strong>IMMOEAST</strong> acquired a strategic investment of 25% in Adama, a residential<br />
construction group that is active in South-eastern Europe, for<br />
EUR 60 million during March 20<strong>07</strong>. This company has already completed<br />
projects with a value of EUR 600 million, and has a development<br />
portfolio of 8,000 apartments. A further 20 projects are currently under<br />
preparation in Romania, Ukraine, Serbia and the Republic of Moldavia.<br />
Shortly before the end of the financial year in April 20<strong>07</strong> <strong>IMMOEAST</strong> acquired the recently completed<br />
Victoria Park in Bucharest. This object is located at a prime site between the city centre and<br />
international airport, and has nearly 30,000 sqm that are fully let to international corporations. The<br />
investment by <strong>IMMOEAST</strong> totalled EUR 60 million.<br />
Information on investments concluded after 30 April 20<strong>07</strong> is provided<br />
in the section “Subsequent events” beginning on page 59.<br />
15<br />
14<br />
Key investments<br />
<strong>Report</strong> by the Executive Board 17<br />
Highlights <strong>2006</strong>/<strong>07</strong><br />
Business Model and Strategy<br />
Portfolio Structure<br />
Corporate Governance and Outlook<br />
Property Portfolio<br />
Development of Business<br />
Consolidated Financial Statements<br />
Service and Glossary<br />
i 13 i<br />
BB Centrum<br />
i 14 i<br />
Polus Center Constanta<br />
i 15i<br />
Portfolio in<br />
Prague and Brno<br />
Investment in Adama<br />
i 16 i<br />
Victoria Park
<strong>IMMOEAST</strong> in<br />
European Comparison<br />
SELECTIVE GROWTH<br />
ANDASTABLEBASIS<br />
���������������������������������������<br />
������������������������������������������<br />
������������������������������������������������<br />
�������������������������������������������������<br />
�����������������������������������������������<br />
�������������������������������������������<br />
����������������������������
Advance to number 2 in Continental Europe<br />
<strong>IMMOEAST</strong> further improved its standing in branch comparison during <strong>2006</strong>/<strong>07</strong> and continued the<br />
rapid ascent it has recorded over recent years: At the end of the <strong>2006</strong>/<strong>07</strong> financial year <strong>IMMOEAST</strong><br />
was the fourth largest property company in Continental Europe based on market capitalisation. By<br />
the end of June 20<strong>07</strong> <strong>IMMOEAST</strong> ranked second, directly behind the merger giant Unibail-Rodamco<br />
and clearly ahead of all other competitors.<br />
15<br />
12<br />
9<br />
6<br />
3<br />
0<br />
14.0<br />
Unibail-<br />
Rodamco<br />
9.2<br />
IMMOFINANZ<br />
Group<br />
4.8<br />
The corporate group comprising <strong>IMMOEAST</strong> and its parent company IMMOFINANZ was also able to<br />
improve its position in European comparison during <strong>2006</strong>/<strong>07</strong>, with market capitalisation rising to<br />
EUR 9.2 billion by the end of June 20<strong>07</strong>.<br />
Number 1 in Eastern Europe<br />
This rapid advance reflects the company’s active growth strategy as well as a strong rise in the<br />
importance of property markets in the east. While property companies in the west act on largely<br />
developed markets, the east is characterised by a stormy recovery process that makes it possible<br />
for market players to generate relatively high rates of growth.<br />
An evaluation of property companies across the whole of Europe<br />
is more of a general benchmark, but a direct comparison with<br />
competitors in Central, Eastern and South-eastern Europe is a<br />
key indicator for performance. This ranking shows <strong>IMMOEAST</strong> far<br />
ahead of its next largest competitor based on market capitalisation,<br />
and the other companies are not half as large. Based on<br />
the property portfolio and investment volume, the lead is even<br />
greater. <strong>IMMOEAST</strong> is not only one of the most important players<br />
on the property markets in this region but also holds leading<br />
positions on numerous submarkets, including key cities like<br />
Bucharest, Budapest and Prague.<br />
This dominant market position makes <strong>IMMOEAST</strong> the preferred<br />
contact for major property developers, which also brings numerous<br />
offers to participate in or acquire attractive projects. That,<br />
in turn, creates additional prospects for growth and a steady<br />
improvement in earnings for <strong>IMMOEAST</strong>. The size of the portfolio<br />
also allows for greater diversification and the fine-tuning of<br />
regional and sector investments.<br />
4.4<br />
3.9<br />
IMMOFINANZ <strong>IMMOEAST</strong> Corio Klepierre Rodamco<br />
Europe<br />
2.9<br />
2.7<br />
2.5<br />
IVG<br />
Immobilien<br />
<strong>IMMOEAST</strong> in Comparison<br />
2.2<br />
Wereldhave<br />
1.9<br />
PSP Swiss<br />
Property<br />
A prize-winning job<br />
<strong>Report</strong> by the Executive Board 19<br />
Highlights <strong>2006</strong>/<strong>07</strong><br />
Business Model and Strategy<br />
Portfolio Structure<br />
Corporate Governance and Outlook<br />
Property Portfolio<br />
Development of Business<br />
Consolidated Financial Statements<br />
Service and Glossary<br />
<strong>IMMOEAST</strong> has established a<br />
firm position as as one of the top<br />
European property companies<br />
in only a few years.<br />
<strong>IMMOEAST</strong> in Continental<br />
European Comparison<br />
Market capitalisation based on<br />
free float in EUR billion<br />
As of 30.6.20<strong>07</strong><br />
The successful expansion and investment strategy of <strong>IMMOEAST</strong><br />
have gained significant recognition in the property branch, and<br />
were also reflected in numerous honours during <strong>2006</strong>/<strong>07</strong>. Two<br />
of the most important property awards in Central, Eastern and<br />
South-eastern Europe were presented to <strong>IMMOEAST</strong> during the<br />
past year.<br />
At the South-eastern Europe Real Estate Awards, which are presented<br />
by the “Europaproperty” business journal, <strong>IMMOEAST</strong><br />
was named “Investor of the Year” in South-eastern Europe for<br />
20<strong>07</strong> and was also honoured as “Property Company of the Year<br />
in South-eastern Europe” in the total ranking for all sectors of<br />
the property industry (investors, developers, banks, brokers<br />
and service companies). Only several weeks before this event,<br />
<strong>IMMOEAST</strong> was recognised as “Investor of the Year” at the Central<br />
& Eastern Europe Real Estate Quality Awards in Warsaw.
Business Model<br />
and Strategy<br />
DISTRIBUTION OF RISK THROUGH<br />
REGIONAL AND SECTOR DIVERSIFICATION<br />
������������������������������������������������������<br />
�������������������������������������������������������<br />
�������������������������������������������������������<br />
�����������������������������������������������������<br />
������������������������������������������������������<br />
���������������������������������������������������������<br />
������������������������������������������������������<br />
������������������������������������������������<br />
������������������������������
Broad-based diversification of the property portfolio<br />
Diversification<br />
The property markets in Central, Eastern and South-eastern Europe can in no way be classified as<br />
homogenous. Despite the many common factors – ranging from geographical proximity to a Communist<br />
past – there is a strong inherent differentiation. This applies to the various country markets as well<br />
as the individual property sectors. However, the correlation has weakened in recent years and the<br />
differences in the development of the many submarkets have become greater. A broadly diversified<br />
property portfolio is therefore connected with significantly greater security and stability for earnings<br />
and an increase in value than a portfolio that focuses only on selected countries or sectors such as<br />
offices, retail objects or residential properties.<br />
<strong>IMMOEAST</strong> has pursued a strategy of diversification since its founding, and has steadily increased<br />
this diversification over the years. That gives the company a very special position among the many<br />
listed property corporations that invest exclusively or predominately in Central, Eastern and Southeastern<br />
Europe.<br />
The geographic and sector diversification process was largely concluded during the <strong>2006</strong>/<strong>07</strong> financial<br />
year. Following the completion of its first direct investments in Russia, Ukraine, Serbia, Croatia<br />
and Slovenia, <strong>IMMOEAST</strong> is now represented in 13 countries and all major submarkets of the region.<br />
The company’s entry into the residential market with 10 projects, which cover 3,400 apartments<br />
in five countries, completed this sector diversification – and established <strong>IMMOEAST</strong> in the office,<br />
retail, logistics and residential sectors.<br />
Flexible concentration of business activities<br />
<strong>Report</strong> by the Executive Board 21<br />
Highlights <strong>2006</strong>/<strong>07</strong><br />
Business Model and Strategy<br />
Portfolio Structure<br />
Corporate Governance and Outlook<br />
Property Portfolio<br />
Development of Business<br />
Consolidated Financial Statements<br />
Service and Glossary<br />
Greater earnings stability and<br />
increase in in value with broad<br />
sector diversification<br />
Special Special position position in in Central, Central,<br />
Eastern and South-eastern<br />
South-eastern<br />
Europe<br />
Diversification with start in in<br />
five five additional additional countries and<br />
entry entry into residential sector<br />
The broad diversification of the property portfolio is an essential requirement for the implementation<br />
of another basic principle of the <strong>IMMOEAST</strong> investment strategy: the company does not follow a<br />
pre-defined, strict asset allocation policy in its acquisitions, but continually adjusts the focal points<br />
of its investment activities to reflect market trends. That allows <strong>IMMOEAST</strong> to make optimal use<br />
of new opportunities that are created by developments on the various submarkets. For example,<br />
in <strong>2006</strong>/<strong>07</strong> the share of investments in the Central European countries that joined the EU during<br />
2004 was substantially reduced in favour of projects in South-eastern Europe, above all the new<br />
EU member states of Romania and Bulgaria. In addition, the shift of investments from offices to<br />
retail objects will allow <strong>IMMOEAST</strong> to increase its presence in a property sector that is particularly<br />
attractive at the present time.<br />
Competitors that do not have a broadly diversified portfolio are generally unable to utilise these<br />
opportunities for practical reasons: the lead time for entering a market segment is normally too long<br />
to react quickly when new developments are identified. Only an investor with the necessary detailed<br />
market know-how and established contacts in a submarket can increase the investment volume in<br />
a particular segment fast enough to benefit from a changing situation.<br />
Close cooperation with the broker group CPB Immobilientreuhand (a subsidiary of Constantia<br />
Privatbank) also makes it possible for <strong>IMMOEAST</strong> to efficiently adjust its investment strategy to<br />
meet changing market conditions. Numerous consultations over property rentals make it possible<br />
to identify customer needs at an early point in time and subsequently include these requirements<br />
into the planning for new <strong>IMMOEAST</strong> projects.
22 <strong>IMMOEAST</strong> <strong>Annual</strong> <strong>Report</strong> <strong>2006</strong>/<strong>07</strong><br />
Combination of investment<br />
properties, development<br />
projects and investments in<br />
property companies<br />
Entry in new markets<br />
generally starts with indirect<br />
investments<br />
Strategic investments in in other other<br />
companies guarantee preferred<br />
access to attractive projects<br />
over the mid- and long-term<br />
However, <strong>IMMOEAST</strong> not only follows the usual criteria for geographic and sector diversification.<br />
Another important aspect is the distribution of objects according to various stages of development.<br />
The acquisition of development projects was increased as a supplement to the purchase of completed<br />
objects in <strong>2006</strong>/<strong>07</strong>, and the investment programme for 20<strong>07</strong>/08 calls for the volume of development<br />
projects to exceed investment properties for the first time.<br />
<strong>IMMOEAST</strong> also focuses on diversity in structuring its business activities – which means the<br />
investment programme includes the acquisition of objects and realisation of development projects<br />
through joint ventures as well as indirect investments through holdings in property companies.<br />
These stakes in local specialists or leading regional property developers also secure excellent<br />
investment opportunities for <strong>IMMOEAST</strong> over the mid-term, since agreements are generally concluded<br />
that require these companies to first offer their developed objects to <strong>IMMOEAST</strong> for acquisition<br />
(“right of first opportunity”).<br />
Holdings in and cooperation projects with local partners are also used by <strong>IMMOEAST</strong> to minimise<br />
the risk associated with entry into new markets. For this reason, the start of business in new<br />
“<strong>IMMOEAST</strong> countries” generally takes place through a joint venture or the purchase of a stake in<br />
a local firm. The development of <strong>IMMOEAST</strong> activities on the Russian market is an example of this<br />
approach: in 2005/06 the company acquired stakes in two Russian specialists, EPH and Fleming<br />
Family & Partner, and subsequently completed its first direct investments during <strong>2006</strong>/<strong>07</strong> with the<br />
acquisition of several shopping centres in Moscow.<br />
Strategic investments<br />
<strong>IMMOEAST</strong> holds investments in numerous property companies throughout Central, Eastern and<br />
South-eastern Europe as well as in Russia and Ukraine. These companies include property developers,<br />
local specialists and well-known international firms that are active in numerous countries<br />
of the region. This approach meets two objectives – <strong>IMMOEAST</strong> is able to realise good returns<br />
with its investments in successful property companies, while the holdings also establish preferred<br />
access to the projects developed by these companies and thereby provide attractive opportunities<br />
for acquisitions over the mid- and long-term.<br />
In <strong>2006</strong>/<strong>07</strong> <strong>IMMOEAST</strong> acquired stakes in a number of major property companies. Together with<br />
the strategic holdings purchased in previous years, these investments will play an important role<br />
in providing <strong>IMMOEAST</strong> with a wide selection of profitable investment opportunities in all regions<br />
and sectors. As a rule, the access to these projects is secured through a “right of first opportunity”,<br />
which means that completed objects must first be offered to <strong>IMMOEAST</strong> for purchase and may only<br />
be sold on the market if <strong>IMMOEAST</strong> chooses not to make the acquisition.
PL, Katowice, Debowe Tarasy – Silesia City Center Residential<br />
Strategic Investments<br />
TriGránit: leading property developer in Eastern Europe<br />
The largest holding acquired by <strong>IMMOEAST</strong> to date and, at the same time, the largest investment<br />
transaction of the <strong>2006</strong>/<strong>07</strong> financial year was the purchase of a stake in the Hungarian property<br />
developer TriGránit Holding Ltd. <strong>IMMOEAST</strong> acquired 25% of this firm for EUR 400 million. TriGránit<br />
has been active in Central, Eastern and South-eastern Europe for roughly ten years, and has established<br />
a position as the region’s leading property developer.<br />
TriGránit held a development portfolio with a value of roughly EUR 8 billion in 13 countries at the<br />
end of April 20<strong>07</strong>. The business activities of this firm are concentrated on multi-functional urban<br />
development projects and large shopping centres. It has also carried out major assignments in the<br />
office, residential, hotel and recreation sectors as well as infrastructure projects and conference<br />
centres. TriGránit was one of the first companies to become active in Central and Eastern Europe<br />
through public-private partnerships. This form of cooperation between federal and local authorities<br />
is expected to play an increasingly important role over the coming years.<br />
TriGránit was able to complete a highly unusual transaction in Russia during the early months of<br />
20<strong>07</strong> by signing a framework agreement for the realisation of 30 urban development projects in<br />
major Russian cities with Gazprombankinvest, a member company of the Gazprom Group. These<br />
development projects will have a minimum volume of EUR 5 billion, and will create a wide range of<br />
investment opportunities for <strong>IMMOEAST</strong> on the Russian market. The TriGránit pipeline also contains<br />
interesting projects in other countries, such as the Zagreb Arena in Croatia, the Bonanka City Center<br />
in Krakow, Poland, and the Passanger Center Ljubljana in Slovenia.<br />
An initial public offering by this company is also a realistic option because of its size, earning power<br />
and market potential as well as the excellent reputation of TriGránit. This possibility is currently under<br />
evaluation, whereby current plans indicate that an IPO by TriGránit would be possible in 2009.<br />
<strong>Report</strong> by the Executive Board 23<br />
Highlights <strong>2006</strong>/<strong>07</strong><br />
Business Model and Strategy<br />
Portfolio Structure<br />
Corporate Governance and Outlook<br />
Property Portfolio<br />
Development of Business<br />
Consolidated Financial Statements<br />
Service and Glossary<br />
The The TriGránit holding is<br />
the the largest investment<br />
by by <strong>IMMOEAST</strong> <strong>IMMOEAST</strong> to date at<br />
EUR 400 million<br />
Diversified development<br />
portfolio portfolio of EUR 8 billion<br />
in 13 countries countries<br />
H, Budapest, Duna Pest
24 <strong>IMMOEAST</strong> <strong>Annual</strong> <strong>Report</strong> <strong>2006</strong>/<strong>07</strong><br />
Development portfolio<br />
with 8,000 apartments<br />
Expansion into other<br />
markets in South-eastern Europe<br />
(Serbia, Ukraine, Republic<br />
of Moldavia)<br />
Focus on development<br />
projects in the Czech Republic,<br />
Poland and Romania<br />
CZ, Prague, Vitek<br />
CZ, Prague, Pankrác Business Corner<br />
Adama: leading residential property company in Romania<br />
<strong>IMMOEAST</strong> acquired another strategic investment in Romania during March 20<strong>07</strong> by purchasing<br />
a 25% stake in Adama, a development company that is specialised in residential projects. With<br />
EUR 600 million of realised projects and a development portfolio of 8,000 apartments, Adama is<br />
one of the leading property developers in the residential sector of Romania and the entire Southeast<br />
European region. The purchase price for the Adama investment, which was acquired for the<br />
most part through a capital increase, totalled EUR 60 million.<br />
Adama intends to use the funds raised through the capital increase to finance an extensive expansion<br />
programme. A total of 20 major residential construction projects are currently in preparation,<br />
which will allow Adama to further strengthen its strong position in Romania and also expand into<br />
other markets of South-eastern Europe. Projects in Ukraine, the Republic of Moldavia and Serbia<br />
have already entered the planning phase. In all four countries where Adama has invested or plans<br />
to invest, the residential property markets have registered high growth rates and the prices realised<br />
on apartment sales have been highly satisfactory.<br />
S+B CEE: Development projects in the Czech Republic, Poland and Romania<br />
In 2002/03 <strong>IMMOEAST</strong> acquired a 50% stake in S+B CEE, the East European subsidiary of the wellknown<br />
Austrian property developer S+B. Since that time, the scope of business has grown significantly<br />
and S+B CEE now manages development projects in the Czech Republic, Poland and Romania,<br />
above all in the office and retail sectors.<br />
This successful cooperation began with a series of projects in Prague, including the Park Hostivar<br />
shopping centre (23,900 sqm) and the Vitek office and retail complex (52,600 sqm). A number<br />
of these properties have since been acquired by <strong>IMMOEAST</strong>. At the end of 2005/06 S+B CEE<br />
started work on the Rondo Jaszdy Polskiej office complex in Warsaw. The investment volume for this<br />
centrally located object with 20,000 sqm of letable space totals EUR 36 million. S+B CEE is also<br />
a key development partner of <strong>IMMOEAST</strong> in the expansion of the STOP.SHOP. specialty shopping<br />
centre chain.
Prime Property: leading property developer in Bulgaria<br />
In Bulgaria <strong>IMMOEAST</strong> holds an investment of 42.23% in Prime Property. This company has grown<br />
rapidly since the entry of <strong>IMMOEAST</strong> and established a position as the leading property developer<br />
on the second largest market in South-eastern Europe.<br />
The business activities of Prime Property include highly successful holiday apartment projects on<br />
the Black Sea as well as the development of office buildings in Sofia. At the end of <strong>2006</strong>/<strong>07</strong> the<br />
development portfolio of Prime Property comprised six projects.<br />
RUS, Moscow, Mosmart Hypercenter<br />
Strategic Investments<br />
Eastern Property Holdings (EPH): on growth course in Russia<br />
<strong>IMMOEAST</strong> acquired an investment in Eastern Property Holdings, a company that trades on the<br />
Zurich Stock Exchange, in June 2005 and has gradually increased its holding since that time. At the<br />
end of <strong>2006</strong>/<strong>07</strong> <strong>IMMOEAST</strong> owned a stake of 19.78% in EPH.<br />
EPH is active as a developer and investor on the Russian market. In <strong>2006</strong> this company recorded<br />
an increase of 175% in its property portfolio to USD 140.6 million as well as earnings of USD 27<br />
million. As of 31 December <strong>2006</strong> EPH owned or held investments in five retail, office and logistics<br />
objects in Russia with 48,000 sqm of letable space. Among others, EPH holds stakes in a number<br />
of properties owned by the leading retail chain Mosmart. The largest investment made by EPH in<br />
the past year was the acquisition of the multi-functional Pertrovsky Fort with roughly 22,400 sqm<br />
of gross space for USD 65 million.<br />
The <strong>IMMOEAST</strong> investment in Eastern Property Holdings represented a value of EUR 56.6 million at<br />
the end of <strong>2006</strong>/<strong>07</strong> based on the share price. The annual performance of the EPH share equalled<br />
7.4% as of 30 April 20<strong>07</strong>.<br />
<strong>Report</strong> by the Executive Board 25<br />
Highlights <strong>2006</strong>/<strong>07</strong><br />
Business Model and Strategy<br />
Portfolio Structure<br />
Corporate Governance and Outlook<br />
Property Portfolio<br />
Development of Business<br />
Consolidated Financial Statements<br />
Service and Glossary<br />
42.23% stake in leading<br />
property property developer on growth<br />
market Bulgaria<br />
19.78% stake in listed<br />
Russia specialist<br />
BG, Sofia, Cerkovna
26 <strong>IMMOEAST</strong> <strong>Annual</strong> <strong>Report</strong> <strong>2006</strong>/<strong>07</strong><br />
Management of <strong>IMMOEAST</strong><br />
business operations is covered<br />
by management contract<br />
Performance-based<br />
management contract<br />
beginning in 20<strong>07</strong>/08 20<strong>07</strong>/08<br />
Management contract with Constantia Privatbank<br />
The direction of business and the management of <strong>IMMOEAST</strong> and its parent company IMMOFINANZ<br />
have been handled by Constantia Privatbank since the founding of these two companies. The contract<br />
covers the management of business operations, which include the duties of the Executive<br />
Board and other key managers of <strong>IMMOEAST</strong> as well as controlling, finance and accounting, treasury,<br />
investments and the representation of owner interests for the company’s property portfolio.<br />
<strong>IMMOEAST</strong> does not have a separate staff – Constantia Privatbank also provides the entire infrastructure<br />
for business operations (offices, furnishings, IT etc.).<br />
The services performed by Constantia Privatbank are covered by a flat-rate management fee that<br />
equals 1% of new investments plus 0.6% of the portfolio objects at the beginning of the year, whereby<br />
this fee is linked to the consumer price index.<br />
Roughly 500 employees of the Constantia Privatbank Group performed services on behalf of<br />
<strong>IMMOEAST</strong> during the <strong>2006</strong>/<strong>07</strong> financial year. This arrangement allows the company to profit from<br />
the broad-based expertise of Constantia Privatbank, which manages a wide range of investment<br />
products for the property sector – including property funds, property investment funds, ownerresident<br />
properties and apartments for retirement income, closed property funds etc. – and has<br />
extensive personnel resources for these activities.<br />
Amendment of management contract beginning in 20<strong>07</strong>/08<br />
The Supervisory Board approved an amendment to the management contract after the end of the<br />
reporting year. This modification reduces the fixed management fee and introduces a performancebased<br />
bonus that will be paid when a pre-determined increase in net asset value (NAV) per share<br />
is realised.<br />
The new guideline also calls for the payment of only the base fee of 0.6 percentage points to<br />
Constantia Privatbank for newly acquired objects, which is 0.4 percentage points less than the<br />
previous charge. When net asset value (NAV, inherent value) per share rises by more than 8% after<br />
payment of the base fee, Constantia Privatbank is entitled to a bonus. This bonus equals 20% of<br />
the increase in value over 8 percentage points.<br />
The new guideline took effect at the beginning of the 20<strong>07</strong>/08 financial year. Constantia Privatbank<br />
has accepted this amendment to the management contract.
Management contract<br />
Asset management by 46 highly qualified specialists<br />
The core of the team that works for <strong>IMMOEAST</strong> is formed by the asset management department.<br />
These experts are responsible for new investments as well as the management and optimisation of<br />
the property portfolio: 46 highly qualified specialists are active in this area of business.<br />
The asset management department of <strong>IMMOEAST</strong> is divided into four groups, which are managed<br />
by well-known experts with many years of experience in their fields:<br />
— Günther Bukor heads the group for direct property investments in South-eastern Europe,<br />
Russia and Ukraine.<br />
— Peter Oesterle heads the group for direct property investments in Central and Eastern Europe.<br />
— Edgar Rosenmayr heads the group for investments in other companies throughout the entire<br />
region as well as residential projects in Ukraine, in Russia and the Baltic States.<br />
— Walter Wölfler heads the group for shopping malls and specialty shopping centres in all countries<br />
of the region.<br />
Rental & property management<br />
The cooperation with Constantia Privatbank gives <strong>IMMOEAST</strong> a number of key advantages above<br />
and beyond the management contract – and these advantages are created above all by the Constantia<br />
Privatbank subsidiaries that are active in the property sector and by their expansion into Central,<br />
Eastern and South-eastern Europe.<br />
CPB Immobilientreuhand, Austria’s leading office broker, has founded subsidiaries in five countries<br />
– Hungary, the Czech Republic, Poland, Slovakia and Romania – and is now represented on the<br />
most important markets of the region. CPB plays a key role in the rental of the <strong>IMMOEAST</strong> properties<br />
and is a valuable addition to the local and international brokers with whom <strong>IMMOEAST</strong> also works.<br />
This creates a major competitive advantage over firms that do not have brokerage functions.<br />
The close cooperation with CPB also gives <strong>IMMOEAST</strong> an important head start during the planning<br />
stage for new projects and the evaluation of investment opportunities: the information on market<br />
developments and changing needs that is collected during the many discussions with potential<br />
tenants can flow directly into investment or planning decisions.<br />
IMV Immobilienmanagement und -verwaltung (IMV) is one of the leading property management<br />
companies in Europe with more than 3 million sqm of managed space. Similar to CPB, IMV also<br />
has subsidiaries in Hungary, the Czech Republic, Poland, Slovakia and Romania. Since many local<br />
property management companies in Central and Eastern Europe still have serious quality problems,<br />
the IMV network – which provides <strong>IMMOEAST</strong> with unlimited support – also forms a key competitive<br />
advantage. That guarantees the same quality of services and efficient property management found<br />
in Austria and other western markets.<br />
<strong>Report</strong> by the Executive Board 27<br />
Highlights <strong>2006</strong>/<strong>07</strong><br />
Business Model and Strategy<br />
Portfolio Structure<br />
Corporate Governance and Outlook<br />
Property Portfolio<br />
Development of Business<br />
Consolidated Financial Statements<br />
Service and Glossary<br />
Four competent experts<br />
with many many years of experience<br />
in the the region region head the asset<br />
management group<br />
Additional services for rental<br />
and property management<br />
Close cooperation provides key<br />
know-how advantages
28 <strong>IMMOEAST</strong> <strong>Annual</strong> <strong>Report</strong> <strong>2006</strong>/<strong>07</strong><br />
Accounting reflects EPRA<br />
recommendation for use of fair<br />
value model<br />
Property valuation by two<br />
independent companies<br />
Additional internal valuation of<br />
the portfolio each quarter<br />
Inherent value of of share<br />
determined determined by by discounted<br />
discounted<br />
cash flow method<br />
Property valuation by independent experts<br />
The preparation of the <strong>IMMOEAST</strong> financial statements also includes the application of the fair<br />
value model recommended by the European Public Real Estate Association (EPRA), which means<br />
the property portfolio is shown at fair value (present value) on the balance sheet. The calculation of<br />
fair value requires the regular revaluation of all properties owned by the company, and the results<br />
of this revaluation have a significant influence on the company’s earnings. The property portfolio is<br />
valued in accordance with the EPRA’s Best Practices Policy Recommendations using the fair value<br />
model defined in IAS 40.<br />
The property portfolio is valued by well-known external experts at the end of each financial year,<br />
which guarantees the correct and independent valuation of all properties. In order to optimise the<br />
quality and exactness of results, the valuations are performed by two companies.<br />
Up to and including the 2005/06 financial year, most of the properties owned by <strong>IMMOEAST</strong> were<br />
valued by a committee of three court-certified experts from Austria and a smaller number of objects<br />
were valued by international property companies. Beginning in <strong>2006</strong>/<strong>07</strong> this process was transferred<br />
completely to major property companies to ensure that the valuation meets standard international<br />
criteria. This changeover will facilitate the comparison of <strong>IMMOEAST</strong> with other listed property<br />
companies and also reflect the wishes of numerous institutional investors.<br />
Colliers International and DTZ, two of the best known global players in the property branch, were<br />
commissioned as valuation experts for the <strong>2006</strong>/<strong>07</strong> financial year. These firms are recognised specialists<br />
for property markets in Central, Eastern and South-eastern Europe.<br />
In addition to a valuation at year-end, the <strong>IMMOEAST</strong> portfolio is also valued by external experts<br />
at mid-year. The valuations for the first and third quarters are performed internally by <strong>IMMOEAST</strong>.<br />
The same principles used by the external experts are applied in these valuations, whereby the fair<br />
values determined by the last external valuation form the starting point for the internal valuation<br />
of the property portfolio.<br />
Use of the discounted cash flow method<br />
The properties are generally valued using the discounted cash flow method, which follows international<br />
valuation principles. Under this method, fair value is determined on the basis of the expected<br />
future cash flows generated by a property. Cash flows that will be received in the near future carry<br />
a greater weighting, while later cash flows are discounted at an appropriate rate. Additional opportunities<br />
for earnings are reflected in a premium to the discount rate, risks are accounted for through<br />
discounts. The discounts used in the valuation are established by the experts and correspond to the<br />
various property submarkets. The fair value of the portfolio plus other assets less debt equals net<br />
assets (net asset value or NAV). When this figure is divided by the number of shares outstanding,<br />
the results is net asset value or “inherent value” per share.
Outlook and strategic goals<br />
Property valuation, Strategic goals<br />
In spite of the high growth rates recorded in recent years, the property markets in Central, Eastern<br />
and South-eastern Europe have only exhausted a fraction of their long-term potential. A comparison<br />
with the established markets of the west gives an impressive picture of the potential that is offered<br />
by this region over the mid- to long-term.<br />
Although the size of the populations in Budapest and Vienna is comparable, Budapest has only<br />
around one-fourth the office space currently available in Vienna. In Berlin there is more office space<br />
than in the whole of Poland, and the Paris or London office market is larger than the entire office<br />
market in Central and Eastern Europe. The difference is even more apparent when the development<br />
of the property markets in South-eastern Europe is analysed: while Romania has a population of<br />
more than 20 million, the office market covers approx. 850,000 sqm. A similar developmental pattern<br />
can also be identified in other parts of the market such as the logistics or residential sectors.<br />
The rapid economic recovery that has taken hold throughout the region, in the EU countries as well<br />
as Ukraine, Russia and the successor states of the former Yugoslavia, will push economic performance<br />
up to western levels over the coming 15 to 20 years. The property market is also forecasted to<br />
show a corresponding improvement.<br />
The excellent growth perspectives for the entire market form the backdrop for the long-term strategic<br />
goals of <strong>IMMOEAST</strong>. The company has established a firm position as the largest property<br />
investor in the region and, as the market leader, can profit best from its growth. For this reason,<br />
<strong>IMMOEAST</strong> has placed the primary focus of activities on strengthening its leading position on the<br />
markets in which it is present. Expansion into new markets in Eastern and South-eastern Europe as<br />
well as other successor states of the former Soviet Union is generally planned, but <strong>IMMOEAST</strong> sees<br />
substantially greater opportunities for growth in its current markets.<br />
Diversification and higher share of development projects<br />
Current plans call for <strong>IMMOEAST</strong> to maintain the present structure of the property portfolio over the<br />
long-term. The broad sector diversification with a strong focus on retail, office, logistics and residential<br />
properties will remain a key element of the <strong>IMMOEAST</strong> strategy. That will allow the company<br />
to utilise the growth opportunities provided by all segments of the market and safeguard the stability<br />
of earnings and the further increase in the value of the portfolio over the long-term.<br />
The increase in investments for development projects – which exceeds the acquisition of investment<br />
properties for the first time in <strong>2006</strong>/<strong>07</strong> – will also continue over the long-term. As a result of<br />
the declining yields on completed objects, projects in the development area offer good opportunities<br />
for significantly higher initial returns and a sound potential for an increase in value.<br />
The long-term goal of <strong>IMMOEAST</strong> is to maintain its number one position in Central, Eastern and<br />
South-eastern Europe as well as Ukraine and Russia. Today <strong>IMMOEAST</strong> is the top player in a region<br />
where the volume of the property markets plays only a supporting role on the European stage. In<br />
15 to 20 years these markets should become the leading actors in a region that will represent more<br />
than one-third of the European property market based on its share of the European population.<br />
<strong>Report</strong> by the Executive Board 29<br />
Highlights <strong>2006</strong>/<strong>07</strong><br />
Business Model and Strategy<br />
Portfolio Structure<br />
Corporate Governance and Outlook<br />
Property Portfolio<br />
Development of Business<br />
Consolidated Financial Statements<br />
Service and Glossary<br />
Property markets in in<br />
Central, Eastern and Southeastern<br />
Europe still have<br />
great great potential<br />
Primary focus placed on<br />
growth in current markets<br />
Increased Increased share share of developmentment<br />
projects creates new new<br />
opportunities opportunities for earnings
Regional<br />
Portfolio Structure<br />
��������������<br />
��������<br />
�������<br />
������<br />
��������<br />
�������<br />
������<br />
�������<br />
���������<br />
�������<br />
��������
�������<br />
������<br />
Regional<br />
Regional distribution of the portfolio *)<br />
<strong>Report</strong> by the Executive Board 31<br />
Highlights <strong>2006</strong>/<strong>07</strong><br />
Business Model and Strategy<br />
Portfolio Structure<br />
Corporate Governance and Outlook<br />
Property Portfolio<br />
Development of Business<br />
Consolidated Financial Statements<br />
Service and Glossary<br />
Number of Proportional share of Share of total<br />
objects letable space sqm letable space<br />
Romania 101 1,632,051 33.4%<br />
Poland 60 799,251 16.3%<br />
Hungary 55 721,246 14.7%<br />
Czech Republic 87 691,551 14.1%<br />
Slovakia 24 310,238 6.3%<br />
Russia 16 220,412 4.5%<br />
Bulgaria 20 179,879 3.7%<br />
Ukraine 4 1<strong>07</strong>,037 2.2%<br />
Croatia 6 81,473 1.7%<br />
Slovenia 3 64,662 1.3%<br />
Serbia 5 52,978 1.1%<br />
Other countries **) 4 30,538 0.7%<br />
Total 385 4,891,316 100.0%<br />
*) excl. WIPARK Hungaria<br />
**) Estonia, Lithuania
32 <strong>IMMOEAST</strong> <strong>Annual</strong> <strong>Report</strong> <strong>2006</strong>/<strong>07</strong><br />
Focus of investments shifts to<br />
South-eastern Europe<br />
HR, Zagreb, Grand Center<br />
<strong>IMMOEAST</strong> <strong>IMMOEAST</strong> expands its<br />
regional presence and is is now<br />
represented in 13 countries<br />
Regional distribution of<br />
letable space as a %<br />
of the portfolio<br />
As of 30.4.20<strong>07</strong><br />
Business activities by region<br />
Concentration on more profitable markets inside and outside the EU<br />
<strong>IMMOEAST</strong> completed direct investments in a record number of countries during <strong>2006</strong>/<strong>07</strong>, and<br />
these transactions are leading to a gradual change in the focal points of the portfolio. The concentration<br />
of activities is shifting from Central and Eastern Europe (Poland, Slovakia, Czech Republic<br />
and Hungary) toward the south-eastern countries of this region (Romania, Bulgaria Slovenia,<br />
Croatia and Serbia). In addition, an increased share of the total portfolio and new investments will<br />
be directed to the two most important markets in the territory of the former Soviet Union, Ukraine<br />
and Russia.<br />
During the course of the reporting year <strong>IMMOEAST</strong> completed its first direct investments in five new<br />
countries, namely Russia (where a presence was established in earlier years through investments<br />
in two property companies that are specialised in this market) and Ukraine as well as Slovenia,<br />
Croatia and Serbia.<br />
— In June <strong>2006</strong> <strong>IMMOEAST</strong> entered the Russian market with the purchase of two shopping<br />
centres in Moscow, and in November <strong>2006</strong> another shopping centre (5th Avenue) was acquired<br />
in this capital city. A framework agreement concluded by the <strong>IMMOEAST</strong> holding TriGránit<br />
with the investment arm of the Gazprom Group for the construction of multi-functional urban<br />
development projects in more than 30 cities will prepare the development of a broad-based<br />
presence in the region’s largest and most populated market.<br />
— In June <strong>2006</strong> a joint venture was formed with the Ukrainian property developer Alacor for the<br />
construction of an office complex and logistics park in Kiev.<br />
— In September <strong>2006</strong> two fully occupied specialty shopping centres were acquired in Slovenia.<br />
— In October <strong>2006</strong> a housing project with 120 apartments in the capital city of Belgrade marked<br />
the start of investments in Serbia.<br />
— In December <strong>2006</strong> <strong>IMMOEAST</strong> acquired the Grand Center office building in Croatian capital of<br />
Zagreb.<br />
<strong>IMMOEAST</strong> is now represented in 13 countries – and a large number of the “blank spots” that were<br />
found on the company’s map before the <strong>2006</strong>/<strong>07</strong> financial year have since disappeared. The only<br />
countries in which there have been no business activities to date are markets such as Belarus,<br />
Albania, Bosnia and Macedonia, which are still problematic for long-term investors largely because<br />
of the political and economic situation. Preparations for market entry have also started in two other<br />
South-east European countries, the Republic of Moldavia and Montenegro. In both cases, the objective<br />
is to identify potential projects through investments in other companies or joint ventures.<br />
Other countries *) 4.8%<br />
Ukraine 2.2%<br />
Bulgaria 3.7%<br />
Russia 4.5%<br />
Slovakia 6.3%<br />
Czech Republic 14.1%<br />
Hungary 14.7%<br />
33.4% Romania<br />
16.3% Poland<br />
*) Croatia, Serbia, Slovenia,<br />
Estonia, Lithuania
The geographic structure of the portfolio was not only changed by the start of business in these new<br />
“<strong>IMMOEAST</strong> countries”. There has also been a noticeable shift in the weighting of the countries in<br />
which <strong>IMMOEAST</strong> was previously active. The most noticeable difference is the strong increase in<br />
investments in the countries of South-eastern Europe, especially Romania. This country is experiencing<br />
a rapid economic recovery, and advanced to become the most important investment location<br />
for <strong>IMMOEAST</strong> in <strong>2006</strong>/<strong>07</strong>. With a 33.4% share of the property portfolio, Romania has now overtaken<br />
the traditional investment targets of Hungary, the Czech Republic and Poland.<br />
The higher weighting of South-eastern Europe, Russia and Ukraine in the <strong>IMMOEAST</strong> investment programme<br />
will be further intensified during the 20<strong>07</strong>/08 financial year. The reason for this redirection is<br />
the current high level of returns that can be realised on investments in these countries as well as the<br />
growth rates that exceed the more mature markets in the countries that joined the EU in 2004.<br />
Central and Eastern Europe:<br />
returns approach western levels<br />
Regional<br />
The property markets in the countries of Central and Eastern Europe (Poland, Slovakia, Czech<br />
Republic and Hungary) have made substantial progress in their transformation from growth markets<br />
of the post-Communist era to established markets of the 21st Century. During the slightly more<br />
than three years since their accession to the European Union, the gap between these countries and<br />
the property markets in the “western” EU countries has steadily declined. In the areas of market<br />
transparency and legal security, there are now virtually no major differences.<br />
These changes have also influenced the development of returns, and the returns on property investments<br />
in the capital cities of the four above-mentioned countries are now only slightly higher than<br />
in the west. The top returns on fully let prime office properties has nearly reached the level of top<br />
returns in Vienna an Berlin.<br />
PL, Warsaw, Mistral Office<br />
<strong>Report</strong> by the Executive Board 33<br />
Highlights <strong>2006</strong>/<strong>07</strong><br />
Business Model and Strategy<br />
Portfolio Structure<br />
Corporate Governance and Outlook<br />
Property Portfolio<br />
Development of Business<br />
Consolidated Financial Statements<br />
Service and Glossary<br />
RO, Constanta, Harbourside<br />
Declining top rents require<br />
change in strategic approach
34 <strong>IMMOEAST</strong> <strong>Annual</strong> <strong>Report</strong> <strong>2006</strong>/<strong>07</strong><br />
PL, Warsaw,<br />
Wisniowy Business Park<br />
South-eastern Europe is<br />
the most important<br />
target region for new<br />
<strong>IMMOEAST</strong> investments<br />
Attractive rents, low<br />
vacancy rates and<br />
increasing legal security<br />
BG, Sofia, Enterprise Building<br />
This development was highly favourable for <strong>IMMOEAST</strong>. The decline in returns on all geographic and<br />
sector submarkets in Central and Eastern Europe led to a significant increase in the fair value of the<br />
property portfolio. However, rising property prices now make it more difficult to identify attractive<br />
investments.<br />
<strong>IMMOEAST</strong> expanded its portfolio in Central and Eastern Europe by a significant amount during<br />
<strong>2006</strong>/<strong>07</strong>. The number of properties increased from 89 to 230 and letable space rose from 1,190,251<br />
sqm to 2,552,824 sqm. In spite of this development, the representation of Central and Eastern<br />
Europe in the Group’s portfolio fell by 31.9 percentage points from 84.1% to 52.2% because of the<br />
strong increase in investments in other areas. The share of new investments made in this region<br />
during <strong>2006</strong>/<strong>07</strong> equalled 26%. Additional details on <strong>IMMOEAST</strong> investment activities in the countries<br />
of Central and Eastern Europe are provided in the segment reports beginning on page 86.<br />
South-eastern Europe: sound returns, strong growth<br />
Romania is the new economic driver for the Balkans<br />
South-eastern Europe (Romania, Bulgaria, Serbia, Croatia and Slovenia) became the most important<br />
target area for new investments during the <strong>2006</strong>/<strong>07</strong> financial year, with 60% of the company’s<br />
total investment volume allocated to this region. In this development, Romania plays a key role: with<br />
a population of roughly 30 million, it is not only the largest submarket but by far the most attractive<br />
country for international investors in all sectors. This strong momentum has also started to spread<br />
out into the neighbouring countries. Even countries like the Republic of Moldavia, which are less<br />
important from an economic standpoint, have profited from the Romania boom and become interesting<br />
markets for property investors over the mid- to long-term.<br />
In general, South-eastern Europe was an extremely attractive location for investments during the<br />
<strong>2006</strong>/<strong>07</strong> financial year. Excellent rents can be realised in all segments of the market and vacancy<br />
rates are low – while the demand for modern space is extremely high and many submarkets are<br />
characterised by an undersupply of space. Since the accession of Romania and Bulgaria to the EU<br />
in early 20<strong>07</strong>, the key national markets now have a standard of legal security that reflects the other<br />
member countries of the European Union.<br />
<strong>IMMOEAST</strong> expanded its portfolio in Central and Eastern Europe by a greater margin than in any<br />
other submarket during the <strong>2006</strong>/<strong>07</strong> financial year. The number of objects rose from 19 to 135 and<br />
letable space increased from 213,721 sqm to 2,011,043 sqm. The share of this region in the portfolio<br />
grew 26 percentage points from 15.1% to 41.1%. Details on <strong>IMMOEAST</strong> investment activities in<br />
the countries of South-eastern Europe are provided in the segment reports beginning on page 93.
Ukraine & Russia: first direct investments<br />
<strong>IMMOEAST</strong> closed its first direct investments in the two major successor states of the former Soviet<br />
Union during <strong>2006</strong>/<strong>07</strong>. The dynamic pace of economic development in Russia and Ukraine as well<br />
as the comparatively high returns on property markets in these two countries make them attractive<br />
targets for investments.<br />
Although <strong>IMMOEAST</strong> has purchased three shopping centres in Moscow and is managing a major<br />
development project, the primary driver for growth in Russia is formed by investments in other companies<br />
and joint ventures. In addition to current properties and development projects, two broadbased<br />
framework agreements between TriGránit (<strong>IMMOEAST</strong> stake: 25%) and the Gazprom Group<br />
and the city of St. Petersburg will create unusually large and attractive opportunities for growth in<br />
Russia over the mid- to long-term.<br />
<strong>IMMOEAST</strong> expanded its portfolio in Russia and Ukraine by a significant amount in <strong>2006</strong>/<strong>07</strong>. The<br />
number of objects grew from 8 to 20 and letable space rose from 10,990 sqm to 327,449 sqm.<br />
The share of these two countries in the portfolio increased 5.9 percentage points from 0.8% to<br />
6.7%. Details on <strong>IMMOEAST</strong> investment activities in Russia and Ukraine are provided in the segment<br />
reports beginning on page 97.<br />
RUS, Moscow, shopping centre 5th Avenue<br />
Regional<br />
<strong>Report</strong> by the Executive Board 35<br />
Highlights <strong>2006</strong>/<strong>07</strong><br />
Business Model and Strategy<br />
Portfolio Structure<br />
Corporate Governance and Outlook<br />
Property Portfolio<br />
Development of Business<br />
Consolidated Financial Statements<br />
Service and Glossary<br />
Investors profit from sound<br />
economic economic development and<br />
high returns<br />
Good opportunities for growth<br />
through projects by <strong>IMMOEAST</strong><br />
holdings TriGránit TriGránit and Adama
Sector Portfolio<br />
Structure<br />
Sector diversification provides<br />
protection against cyclical<br />
fluctuations on submarkets<br />
Significant improvement<br />
improvement<br />
in earnings stability through through<br />
sector diversification<br />
Sector distribution<br />
of letable space<br />
As of 30.4.20<strong>07</strong><br />
Broad diversification across all major property sectors<br />
The <strong>IMMOEAST</strong> portfolio is also widely diversified among the various sectors of the property market.<br />
The four strong focal points of the company – offices, retail, logistics and residential properties<br />
– form an important advantage over competitors who are only present in specific submarkets. The<br />
cyclical fluctuations that frequently characterise property markets generally conflict with the goal<br />
of long-term property investors to realise stable earnings and an increase in value. Although these<br />
cycles are still outweighed by the strong growth in Central, Eastern and South-eastern Europe, they<br />
will play a larger role as the markets mature.<br />
Different cycles in different sectors<br />
The cyclical movements on the various submarkets do not normally coincide because demand is<br />
driven by different macroeconomic developments. Whereas the demand for office space is based<br />
primarily on economic growth and the pace of investment activity by companies, the retail sector is<br />
influenced above all by changes in disposable income. The demand for housing, in turn, only starts<br />
to improve when other basic consumer needs are satisfied.<br />
The independent factors that affect the various submarkets demonstrate that the stability of the<br />
earnings generated by a property portfolio can be significantly improved through the broad diversification<br />
of investments by sector. <strong>IMMOEAST</strong> is an excellent example of this diversification policy:<br />
the most important areas of business are the retail and office sectors, which are complemented by<br />
a strong focus on investments in logistics and the still small, but rapidly growing residential sector.<br />
Fluctuations on individual submarkets can lead to a sharp decline in earnings for property companies<br />
that concentrate on only a single sector, but the resulting impact on the <strong>IMMOEAST</strong> portfolio is<br />
largely equalised by a balanced mixture of investments.<br />
100<br />
80<br />
60<br />
40<br />
20<br />
0<br />
2003/04 2004/05<br />
2005/06 <strong>2006</strong>/<strong>07</strong><br />
Parking<br />
Recreation/Hotel<br />
Retail<br />
Logistics<br />
Residential<br />
Offices
In addition to the increased stability of earnings, a further advantage of the diversification strategy<br />
pursued by <strong>IMMOEAST</strong> is that it provides the necessary know-how for multi-functional projects. The<br />
importance of these assignments is increasing, especially in connection with major urban development<br />
projects – and is illustrated by the <strong>IMMOEAST</strong> holding TriGránit, which will realise 30 urban<br />
development projects in Russia, over the coming years.<br />
Despite the evident advantages of a portfolio that is widely diversified by sector, this investment<br />
strategy is only followed by a small number of property companies. One main reason for this situation<br />
is the significantly higher cost of management compared with property portfolios that concentrate<br />
on only one or a few market segments. However, this is not a problem for <strong>IMMOEAST</strong>. The<br />
management contract with Constantia Privatbank provides the company with adequate personnel<br />
resources and a large number of experts – at no additional cost in relation to the management of a<br />
portfolio that is less diversified or not diversified at all.<br />
The benefits of know-how transfer<br />
Sector<br />
<strong>Report</strong> by the Executive Board 37<br />
Highlights <strong>2006</strong>/<strong>07</strong><br />
Business Model and Strategy<br />
Portfolio Structure<br />
Corporate Governance and Outlook<br />
Property Portfolio<br />
Development of Business<br />
Consolidated Financial Statements<br />
Service and Glossary<br />
Extensive know-how for<br />
multi-functional projects<br />
Management contract<br />
guarantees necessary<br />
personnel capacity<br />
For a large number of projects, secondary uses also play an important role in addition to the primary<br />
use of the property – for example, shopping centres that also let office space, or an office<br />
building that has large warehouse facilities. <strong>IMMOEAST</strong> and the entire IMMOFINANZ Group have<br />
compiled extensive know-how in all areas due to the broad sector diversification of the portfolio,<br />
which makes it possible to optimise the many different components of a project.<br />
The importance of this know-how transfer between sectors is illustrated by the parking segment:<br />
although <strong>IMMOEAST</strong> does not operate any commercial garages, roughly 6.6% of the letable space in<br />
the company’s portfolio is comprised of underground garages and other parking areas in buildings<br />
(not including outdoor parking spaces). Above all in office buildings and shopping centres, a major<br />
part of the available space is dedicated to this use. Therefore, the optimal management of parking<br />
facilities as well as the cost-effective operation of garages often has a major influence on the total<br />
return of a property.<br />
In this area, <strong>IMMOEAST</strong> can rely on the extensive know-how of its parent company IMMOFINANZ:<br />
the IMMOFINANZ subsidiary WIPARK is one of the leading garage operators in Austria and has<br />
also gained experience in the east with its three garages in Budapest. The exchange of know-how<br />
throughout the Group provides <strong>IMMOEAST</strong> with technical expertise as well as extensive experience<br />
in pricing, product design and the marketing of parking spaces, which allows for the optimisation<br />
of projects that include garages.
38 <strong>IMMOEAST</strong> <strong>Annual</strong> <strong>Report</strong> <strong>2006</strong>/<strong>07</strong><br />
Decline Decline in returns leads<br />
to higher fair values for<br />
<strong>IMMOEAST</strong> office objects objects<br />
Reduction of 6.4 percentage<br />
points in office space to 34.0%<br />
Office sector remains dominant<br />
The office sector continued its strong positive development during the <strong>2006</strong>/<strong>07</strong> financial year. In all<br />
countries in which <strong>IMMOEAST</strong> is present, the returns on office properties declined steadily. That had<br />
a favourable effect on the fair value of the property portfolio, but also reduced the realisable returns<br />
on new investments. This change in the operating environment also led to a change in the pattern<br />
of investments by <strong>IMMOEAST</strong>.<br />
Returns in Central Europe continue to approach western levels<br />
In the capital cities of Central and Eastern Europe (Prague, Warsaw, Budapest and Bratislava), the<br />
top returns for fully occupied office properties in prime locations declined steadily to a level of<br />
5.0% to 5.75% by the end of the financial year. This development significantly reduced the difference<br />
to returns in major western cities, and forecasts are now indicating that returns will equalise<br />
during 20<strong>07</strong>/08.<br />
The office sector remained the largest area of business for <strong>IMMOEAST</strong> in <strong>2006</strong>/<strong>07</strong>. As of 30 April<br />
20<strong>07</strong> this segment represented 34.0% of the portfolio (based on total letable space), which reflects<br />
a decline of 6.4 percentage points in comparison with the previous year. In spite of this shift, the<br />
share of office space still exceeds the steadily growing retail segment.<br />
As a percentage of new investments, the share of office projects fell behind the retail segment to<br />
equal only 29% in <strong>2006</strong>/<strong>07</strong>. A total of EUR 1.4 billion was invested in office properties during the<br />
reporting year, but the share of new investments in the retail sector fell to 39%.<br />
Most of the investments made in office properties during the reporting year represented completed<br />
objects, primarily with high occupancy rates between 80% and 100%. The new acquisitions include<br />
the Mokotow Business Park in Warsaw with 136,000 sqm of letable space that is almost fully occupied<br />
and three objects in the BB Centrum in Prague with a combined total of 73,000 sqm of fully<br />
CZ, Prague, BB Centrum
Sector<br />
let space. Other purchases of large office properties that are fully or almost fully let include the<br />
Diamond Point in Prague with 27,000 sqm, the Brama Zachodnia in Warsaw with 36,000 sqm, the<br />
Victoria Park in Bucharest with 30,000 sqm and the Grand Center in Zagreb with 21,400 sqm.<br />
This concentration on fully let objects is also a reaction to the vacancy rates in the capitals of Central<br />
and Eastern Europe. In these cities, vacancies are significantly higher for offices than in the<br />
retail, logistics or residential sector. Despite this situation, <strong>IMMOEAST</strong> started work on a number<br />
of impressive development projects during <strong>2006</strong>/<strong>07</strong>. The most notable project is undoubtedly the<br />
Equator Office in Warsaw, which involves the construction of 125,000 sqm of letable space. Another<br />
major project, the Jandarmeriei Office, was started in Bucharest and will entail the construction of<br />
40,000 sqm of letable space by 2010.<br />
Expansion of STOP.SHOP. specialty shopping centres<br />
throughout the region<br />
<strong>Report</strong> by the Executive Board 39<br />
Highlights <strong>2006</strong>/<strong>07</strong><br />
Business Model and Strategy<br />
Portfolio Structure<br />
Corporate Governance and Outlook<br />
Property Portfolio<br />
Development of Business<br />
Consolidated Financial Statements<br />
Service and Glossary<br />
Major office development<br />
projects in Warsaw and<br />
Bucharest<br />
Specialty shopping centres play an important role in <strong>IMMOEAST</strong> activities in the retail sector. These<br />
facilities represent mid-sized retail properties with a minimum area of 3,500 to 10,000 sqm, which<br />
are typically located at or near traffic crossroads in mid-sized cities. <strong>IMMOEAST</strong> has direct access to<br />
extensive know-how in the development of specialty shopping centres because its parent company<br />
IMMOFINANZ operates over 150 such facilities in Austria and has been the market leader in this segment<br />
for many years.<br />
The development of specialty shopping centres is based on a high degree of standardisation, which<br />
covers both the design of the objects as well as the tenant mix. This procedure creates significant cost<br />
and rental advantages for a major property investor who, like <strong>IMMOEAST</strong>, can develop a large number<br />
of locations at the same time. In contrast to shopping malls, there are no joint advertising or marketing<br />
activities and facilities management is also less extensive. These lower costs allow the centre owner to<br />
offer substantially lower rents. For this reason, specialty shopping centres are attractive above all for<br />
retail chains in the middle and lower price segments. <strong>IMMOEAST</strong> develops specialty shopping centres<br />
in many locations together with the same chains, providing these corporations with a tailor-made retail<br />
property and giving them the opportunity to build up a key part of their own network with a single<br />
property partner.<br />
Specialty shopping centres are generally “anonymous” in design, but <strong>IMMOEAST</strong> operates its facilities<br />
under a separate name with high brand recognition. Under the STOP.SHOP. brand name, a total of 45<br />
specialty shopping centres are currently under development throughout the entire region, and 11 of<br />
these facilities have already opened in Hungary, Slovakia and Slovenia. After the completion of extensive<br />
preparatory work, a STOP.SHOP. centre will open every two to three weeks on average during the<br />
20<strong>07</strong>/08 financial year. The Czech Republic will form the focal point of investments, where 18 specialty<br />
shopping centres will start operations by spring 2009. Eight objects will be built in Slovakia, and nine<br />
centres will be added to the current seven in Hungary. Additional properties are currently under construction<br />
in Poland and Romania.<br />
Above and beyond this expansion programme, work has started on a further development phase that<br />
will involve the construction of roughly 85 STOP.SHOP. specialty shopping centres in Poland, Ukraine,<br />
Romania, the Czech Republic, Slovakia and Hungary. <strong>IMMOEAST</strong> plans to develop a total of 120 STOP.<br />
SHOP. specialty shopping centres in this region over the coming years.
40 <strong>IMMOEAST</strong> <strong>Annual</strong> <strong>Report</strong> <strong>2006</strong>/<strong>07</strong><br />
Increase of 8.1 percentage<br />
points in retail space to 30.0%<br />
Good opportunities for<br />
growth and earnings earnings through<br />
expansion by international<br />
retail chains<br />
Separate asset management<br />
group for shopping malls and<br />
specialty shopping centres centres<br />
Strong increase in retail space<br />
The retail sector generated the highest growth rates in the <strong>IMMOEAST</strong> portfolio during the <strong>2006</strong>/<strong>07</strong><br />
financial year. The share of this sector in the total portfolio rose from 20.9% at the end of 2005/06<br />
to 30.0% as of 30 April 20<strong>07</strong>. This development largely reduced the difference to the largest segment,<br />
the office sector. Retail properties totalled 39.0% of all new investments for the reporting<br />
year, replacing office objects as the most important area of business. Investments in retail properties<br />
reached a volume of EUR 1.9 billion in <strong>2006</strong>/<strong>07</strong>.<br />
CZ, Tabor, STOP.SHOP.<br />
<strong>IMMOEAST</strong> is utilising this favourable market situation to adjust the focus of its investments, and<br />
thereby take advantage of the interesting opportunities in the retail sector. Nearly all countries<br />
in Central, Eastern and South-eastern Europe have recorded a steady improvement in disposable<br />
income over recent years. This development has made these markets more attractive for international<br />
retail chains, which have started to accelerate the pace of their expansion in the region. Retail<br />
space is now in high demand, above all at new locations outside the capital cities. A further plus<br />
point is the fact that returns on retail space are still substantially higher than offices. The difference<br />
in returns between top rents in the office segment and top rents in the retail segment equals 0.5 to<br />
1.0 percentage points.<br />
The growing importance of the retail segment in the <strong>IMMOEAST</strong> portfolio and the special challenges<br />
posed by the management of these properties were reflected in the creation of a separate group<br />
within the asset management department. Under the direction of Walter Wölfler, an experienced<br />
specialist for shopping centres, this group is responsible for facility management in the <strong>IMMOEAST</strong><br />
shopping malls and specialty shopping centres.
Higher share of development projects<br />
<strong>IMMOEAST</strong> investments in retail objects focus primarily on development projects, with the acquisition<br />
of completed properties playing a much less important role. The two largest retail investments<br />
completed during the <strong>2006</strong>/<strong>07</strong> financial year represent the acquisition of development projects:<br />
the largest investments in Romania, the Polus Center Cluj with roughly 100,000 sqm of letable<br />
space and the Polus Center Constanta with 90,000 sqm of letable space, were acquired during an<br />
early stage of construction in the form of forward purchases, contingent on completion and realisation<br />
of a pre-determined level of occupancy. Other major acquisitions, such as a shopping centre<br />
in Craiova, are also development projects. Completed objects were acquired above all in Russia,<br />
where three shopping centres were purchased in Moscow.<br />
An important reason for the high component of development projects is the favourable rental situation,<br />
since vacancy rates are substantially lower than in the office sector. That lowers the risk<br />
associated with vacancies, and most retail objects start with a very high level of occupancy or are<br />
fully let when they open. Therefore, the commitment in development projects is relatively low in<br />
this sector.<br />
The cooperation with TriGránit, a property developer in which <strong>IMMOEAST</strong> acquired a holding during<br />
July <strong>2006</strong>, has become an important factor for new investments in the retail sector. TriGránit is<br />
developing large shopping centres through Central, Eastern and South-eastern Europe. <strong>IMMOEAST</strong><br />
generally has a right of first opportunity to purchase the completed objects, which gives the company<br />
privileged access to investments in some of the most attractive retail properties in the region.<br />
H, Budapest, Millenium Tower I<br />
Sector<br />
<strong>Report</strong> by the Executive Board 41<br />
Highlights <strong>2006</strong>/<strong>07</strong><br />
Business Model and Strategy<br />
Portfolio Structure<br />
Corporate Governance and Outlook<br />
Property Portfolio<br />
Development of Business<br />
Consolidated Financial Statements<br />
Service and Glossary<br />
RO, Cluj, Polus Center Cluj<br />
Development projects in the<br />
retail sector form a major major part<br />
of the <strong>IMMOEAST</strong> portfolio
42 <strong>IMMOEAST</strong> <strong>Annual</strong> <strong>Report</strong> <strong>2006</strong>/<strong>07</strong><br />
Logistics sector declines<br />
by 4.2 percentage points<br />
to 14.2%<br />
Low vacancy rates and<br />
relatively high returns<br />
Steady expansion of logistics portfolio<br />
The logistics sector forms an important element of the overall concept for the <strong>IMMOEAST</strong> property<br />
portfolio. In addition to the two larger segments – offices and retail objects – it rounds out the<br />
company’s activities in the area of commercial properties. During the <strong>2006</strong>/<strong>07</strong> financial year, the<br />
number of logistics objects rose from 14 to 52 and letable space increased from 260,241 sqm to<br />
695,948 sqm. In spite of this impressive development, the growth of this sector was significantly<br />
slower than the overall expansion of the <strong>IMMOEAST</strong> portfolio. Accordingly, the share of logistics<br />
properties declined noticeably from 18.4% at the end of 2005/06 to 14.2% as of 30 April 20<strong>07</strong>.<br />
RO, Timis¸oara, Almera Logistics<br />
The logistics area is highly attractive for long-term investors, above all because of its low vacancy<br />
rates. In all countries where <strong>IMMOEAST</strong> has made such investments, the demand for modern logistics<br />
space remains high and most of the objects have occupancy rates clearly above 80% at the<br />
time they open.<br />
Higher returns than offices and retail objects<br />
The returns are also very attractive and exceed the comparable values that can be realised on<br />
investments in office or retail properties. In Central and Eastern Europe, South-eastern Europe,<br />
Russia and Ukraine, the difference between top returns in the logistics area and top returns in the<br />
office sector generally range from 1 to 2 percentage points.
The largest single investment in the logistics segment during <strong>2006</strong>/<strong>07</strong> was the acquisition of IMAK<br />
CEE, in which <strong>IMMOEAST</strong> held a majority stake of 56% before the reporting year. The IMAK CEE portfolio<br />
has a fair value of roughly EUR 280 million, and 60% of the letable space is located in logistics<br />
facilities. The investments are concentrated in Poland and Hungary, whereby the Euro Business<br />
Park near Budapest represents the most important logistics object with its Shark Park, Camel Park<br />
and Pharma Park properties.<br />
The Bucharest Distribution Park in the Romanian capital has also reached an important dimension.<br />
As part of a framework agreement, 149,000 sqm of logistics space will be built in eight objects. This<br />
is the largest investment made by <strong>IMMOEAST</strong> to date in the logistics sector. In Romania <strong>IMMOEAST</strong><br />
has signed an agreement covering an extensive development programme for logistics centres –<br />
400,000 to 500,000 sqm of logistics space will be built together with the European Future Group, a<br />
property developer, including the Pantelimon Warehouse near Bucharest with 52,000 sqm.<br />
The most important investment activities in numerous regions of Romania are taking place within<br />
the context of a traditional supplier market. In the greater Bucharest area modem logistics facilities<br />
reported virtually no vacancies at the end of the <strong>2006</strong>/<strong>07</strong> financial year, and the supply of modern<br />
logistics space in the districts surrounding the capital city totalled only approx. 200,000 sqm at the<br />
start of 20<strong>07</strong>. This supply will be unable to meet the level of demand, which is expected to arise over<br />
the coming years. According to a market report by the international property company DTZ, vacancy<br />
rates are less than 2% across the whole of Romania.<br />
Another notable project is the Alacor Logistics Park City in Ukraine, which has 47,200 sqm of<br />
letable space. This project is being realised together with the Ukrainian developer Alacor. In addition,<br />
<strong>IMMOEAST</strong> has also made indirect investments in the logistics sectors of other countries<br />
through acquisitions made by its holdings, for example in Poland and Russia.<br />
UA, Kiev, Alacor Logistics Park City<br />
Sector<br />
<strong>Report</strong> by the Executive Board 43<br />
Highlights <strong>2006</strong>/<strong>07</strong><br />
Business Model and Strategy<br />
Portfolio Structure<br />
Corporate Governance and Outlook<br />
Property Portfolio<br />
Development of Business<br />
Consolidated Financial Statements<br />
Service and Glossary<br />
Full acquisition of<br />
IMAK CEE CEE with a portfolio<br />
of EUR 280 million and<br />
high share of logistics<br />
RO, Bucharest, Pantelimon<br />
Traditional “supply market”<br />
in Romania with vacancy rates<br />
below 2%<br />
Alacor Logistics Park City:<br />
top project in Ukraine
44 <strong>IMMOEAST</strong> <strong>Annual</strong> <strong>Report</strong> <strong>2006</strong>/<strong>07</strong><br />
First direct investments<br />
investments<br />
in residential sector<br />
during during <strong>2006</strong>/<strong>07</strong><br />
Sale of completed apartment<br />
complexes in the<br />
form of condominiums<br />
Residential: new area of business with great potential<br />
The residential sector is the newest area of business for <strong>IMMOEAST</strong>. Prior to the 2005/06 financial<br />
year, the only investments in this sector represented indirect investments through stakes held by<br />
<strong>IMMOEAST</strong> in other property companies. However, residential properties now comprise 6.8% of the<br />
letable space in the <strong>IMMOEAST</strong> portfolio.<br />
The first direct investments were made during <strong>2006</strong>/<strong>07</strong>, and <strong>IMMOEAST</strong> is currently realising 10 of<br />
its own residential construction projects in five countries. All projects are being developed together<br />
with local partners, and will result in the production of more than 3,400 apartments with 220,000<br />
sqm of letable space. Despite the start of direct investments in this sector, the share of residential<br />
space declined from 6.8% to 13.8% due to the strong growth of the <strong>IMMOEAST</strong> property portfolio<br />
during the reporting year.<br />
CSG, Belgrade, Francuska<br />
The development of this segment within the portfolio does not reflect the growing importance of<br />
activities in the residential sector for <strong>IMMOEAST</strong>. This is due to a special feature of the residential<br />
market in this region: although the market for rental apartments is largely non-existent, the market<br />
for condominiums is excellent and shows high rates of growth. For this reason, the residential<br />
projects developed by <strong>IMMOEAST</strong> are not held over the long-term, but sold quickly as possible –<br />
often before completion – as condominiums. One example is the Silesia Residential project, where<br />
all of the roughly 250 apartments built in phase one were sold at the start of construction.
Sector<br />
Short-term investment of capital with high returns<br />
Figures that appear “negative” in the letable space statistics on the <strong>IMMOEAST</strong> property portfolio<br />
are reflected in even more positive results in the analysis of performance. The capital invested in<br />
these projects is tied up for a relatively short period of time, and the resulting returns lie far above<br />
the comparable indicators for other areas of business in which <strong>IMMOEAST</strong> holds investments over<br />
the long-term.<br />
For this reason, <strong>IMMOEAST</strong> has defined the residential sector as a key growth area and will steadily<br />
increase its commitment in these projects. The residential markets in the countries of Central and<br />
Eastern Europe, South-eastern Europe, Ukraine and Russia have a higher potential for growth than<br />
the markets for commercial properties over the mid- to long-term. The remaining supply of apartments<br />
from the Communist era is large, but in poor condition in many cities with low prospects for<br />
renovation or modernisation.<br />
The growing middle class is no longer prepared to accept this standard of housing and is increasingly<br />
in a position to finance the purchase of modern apartments. In combination with the demographic<br />
shift from rural to urban areas that currently characterises the entire region, there is an<br />
enormous undersupply of adequate housing above all in the capital cities and regional centres. This<br />
development will create optimal conditions for investors, at least over the next one decades.<br />
The most important projects started by <strong>IMMOEAST</strong> in <strong>2006</strong>/<strong>07</strong> include:<br />
— Silesia Residential (Poland): in Katowice 980 apartments are under construction in four stages<br />
next to the Silesia City Center, a shopping mall that is owned by <strong>IMMOEAST</strong>.<br />
— Jandarmeriei Residential (Poland): the Jandarmeriei project involves the construction of office<br />
space as well as 360 apartments.<br />
— Century Residence (Slovakia): 400 apartments will be built at a central location in the capital<br />
city of Bratislava.<br />
— Francuska (Serbia): close to the city centre of Belgrade, 120 apartments and 148 underground<br />
garage spaces are under construction.<br />
St. Vlas & Koral Bay: strong demand for apartments<br />
on the Black Sea<br />
<strong>Report</strong> by the Executive Board 45<br />
Highlights <strong>2006</strong>/<strong>07</strong><br />
Business Model and Strategy<br />
Portfolio Structure<br />
Corporate Governance and Outlook<br />
Property Portfolio<br />
Development of Business<br />
Consolidated Financial Statements<br />
Service and Glossary<br />
Short-term investment of of<br />
capital leads to higher returns<br />
compared with other sectors<br />
SK, Bratislava,<br />
Century Residence<br />
Rising standard of living<br />
and extremely low supply<br />
create optimal market market and<br />
growth opportunities<br />
Silesia Residential<br />
Jandarmeriei Residential<br />
Century Century Residences<br />
Residences<br />
Francuska<br />
A relatively small, but lucrative niche in the residential segment is the construction of holiday apartments<br />
and second homes in popular tourism areas. <strong>IMMOEAST</strong> is currently constructing two complexes<br />
with roughly 470 apartments on the Bulgarian Black Sea coast.<br />
The Koral Bay and St. Vlas apartment complexes are located directly on the beach, and therefore<br />
particularly attractive as second residences. The demand for these objects comes primarily from<br />
countries in the west, above all Great Britain. A large number of the apartments in both objects have<br />
already been sold, even though the properties are not yet completed.
Investor Relations<br />
NEW IMPULSES<br />
THROUGH NEW MARKETS<br />
�������������������������������������<br />
����������������������������������������<br />
��������������������������������������<br />
����������������������������������������<br />
���������������������������������<br />
��������������������������������������<br />
�����������������������������������
Capital Market & Development of Share<br />
Developments on international capital markets<br />
During the period from May <strong>2006</strong> to the end of April 20<strong>07</strong>, events on international markets were<br />
influenced by the volatile development of prices for raw materials and crude oil and the subsequent<br />
impact on economic growth, inflation and interest rates. Following massive declines in early<br />
summer, all major international stock indexes recorded positive performance for the fourth year in<br />
succession. However, this development was moderated by a strong but brief correction in February<br />
20<strong>07</strong> – the upward trend then continued during the first quarter of 20<strong>07</strong>, although macroeconomic<br />
factors and geopolitical risks clouded the general market climate. In year-on-year comparison, the<br />
DJ Euro Stoxx 50 recorded an increase of 14.4% as of April 20<strong>07</strong> and the leading German DAX<br />
reported a plus of 23.3%. The Austrian Traded Index (ATX) of the Vienna Stock Exchange closed with<br />
4,738 points at the end of April, which represents an increase of 13.5% over the previous year.<br />
Market environment for property shares<br />
The development of property shares outpaced the market during the <strong>2006</strong>/<strong>07</strong> financial year. Positive<br />
impulses were provided above all by dynamic growth in Eastern Europe and the resulting increase<br />
in the demand for space. The I-ATX property index of the Vienna Stock Exchange registered a plus<br />
of nearly 26% from May <strong>2006</strong> to the end of April 20<strong>07</strong>. However, in part significant corrections were<br />
noted during early summer 20<strong>07</strong>.<br />
Performance of the <strong>IMMOEAST</strong> share<br />
<strong>IMMOEAST</strong> has also recorded an impressive success story on the stock exchange since its initial public<br />
offering in December 2003. With average annual performance of almost 20% from the start of trading<br />
on 12 December 2003 to 30 April 20<strong>07</strong>, the stock has generated excellent results for shareholders.<br />
The <strong>IMMOEAST</strong> share was able to match its past performance without difficulty during <strong>2006</strong>/<strong>07</strong>. An<br />
increase of 20.8% for the financial year again demonstrated the stability of the upward trend in the<br />
share price. Three-year performance of 20.0% placed the share above the 20%-mark for the first<br />
time. Since the initial public offering <strong>IMMOEAST</strong> shareholders have also enjoyed an average annual<br />
performance that has nearly matched this level, with a plus of 19.3%.<br />
210<br />
200<br />
190<br />
180<br />
170<br />
160<br />
150<br />
140<br />
130<br />
120<br />
110<br />
100<br />
Dec 03 Mar 04 Jun 04 Sep 04 Dec 04 Mar 05 Jun 05 Sep 05 Dec 05 Mar 06 Jun 06 Sep 06 Dec 06 Mar <strong>07</strong> Jun <strong>07</strong><br />
Investor Relations<br />
<strong>IMMOEAST</strong><br />
Immobilien ATX<br />
MSCI World<br />
<strong>Report</strong> by the Executive Board 47<br />
Highlights <strong>2006</strong>/<strong>07</strong><br />
Business Model and Strategy<br />
Portfolio Structure<br />
Corporate Governance and Outlook<br />
Property Portfolio<br />
Development of Business<br />
Consolidated Financial Statements<br />
Service and Glossary<br />
Continuation of<br />
upward trend<br />
Property index outperforms<br />
market with a plus of 26%<br />
Share price reaches<br />
historic high of EUR 12.0<br />
Development of <strong>IMMOEAST</strong><br />
share price vs. I-ATX and MSCI<br />
World<br />
from 12.12.2003 to 29.6.20<strong>07</strong><br />
in %
48 <strong>IMMOEAST</strong> <strong>Annual</strong> <strong>Report</strong> <strong>2006</strong>/<strong>07</strong><br />
<strong>IMMOEAST</strong> share with<br />
improved liquidity<br />
Market capitalisation of<br />
property companies traded on<br />
the Vienna Stock Exchange<br />
As of 30.6.20<strong>07</strong>, in EUR mill.<br />
Capital increase carried<br />
out at mid-year<br />
Largest issue by a European<br />
property company<br />
<strong>Annual</strong> Performance of the <strong>IMMOEAST</strong> share as of 30 April 20<strong>07</strong><br />
Pre-tax return<br />
Period After-tax return (inv. subject to withholding tax)<br />
1 year 20.9% 27.7%<br />
3 years 20.0% 26.7%<br />
Since IPO on 11 December 2003 19.3% 25.5%<br />
The liquidity of the <strong>IMMOEAST</strong> share continued to improve during <strong>2006</strong>/<strong>07</strong>, with the trading volume<br />
reaching EUR 5,832 million for the financial year. In comparison with 2005/06, the increase represents<br />
115%. This development ranked <strong>IMMOEAST</strong> among the ten stocks with the highest turnover<br />
on the Vienna Stock Exchange. As a result of the capital increase and strong rise in the price of the<br />
share, market capitalisation rose by a substantial margin to EUR 5.78 billion as of 30 April 20<strong>07</strong> and<br />
a year-on-year increase of 200%.<br />
10,000<br />
8,000<br />
6,000<br />
4,000<br />
2,000<br />
0<br />
<strong>IMMOEAST</strong> Meinl European<br />
Land<br />
IMMOFINANZ CA Immobilien Conwert Sparkassen<br />
Immobilien<br />
CA Immo<br />
International<br />
ECO Business<br />
Immobilien<br />
Capital increases<br />
The previously announced capital increase by <strong>IMMOEAST</strong> was successfully carried out in June <strong>2006</strong>.<br />
A total of 277.9 million shares were offered for sale and, although the stock market climate was<br />
clearly negative at that time – the leading Austrian ATX index lost 15.7% from the start of the financial<br />
year on 1 May <strong>2006</strong> to the conclusion of the capital increase on 8 June <strong>2006</strong> – this transaction<br />
was a full success. The issue was clearly oversubscribed and many purchase orders, especially from<br />
institutional investors, could only be filled in part.<br />
The price of the new shares was established through a bookbuilding procedure, which was used for<br />
the first time in Austria in connection with this <strong>IMMOEAST</strong> issue. The resulting price of EUR 8.25 per<br />
share produced a total volume of EUR 2.75 billion for the issue. That represents the largest capital<br />
market transaction ever carried out by a property company in Europe and the second largest issue<br />
ever completed by an Austrian corporation.<br />
This capital increase firmly established <strong>IMMOEAST</strong> as one of the major European property companies,<br />
and also substantially increased the company’s standing on international capital markets. As<br />
a consequence of this development, <strong>IMMOEAST</strong> was included in the GPR 15, the index of the 15<br />
most important listed property companies in Europe, at the start of July <strong>2006</strong>. <strong>IMMOEAST</strong> and its<br />
parent company IMMOFINANZ are the only corporate group to be represented with two stocks in this<br />
key index for property blue chips in Europe.
Strengthening of investor relations<br />
<strong>IMMOEAST</strong> strongly expanded its activities in the area of investor relations during <strong>2006</strong>/<strong>07</strong>. Numerous<br />
road shows were held in financial centres throughout Europe to present the company to key institutional<br />
investors, especially in advance of the capital increase carried out in June <strong>2006</strong> and the capital<br />
increase carried out after the end of the <strong>2006</strong>/<strong>07</strong> financial year in June 20<strong>07</strong>.<br />
In addition to these wide-ranging investor relations programmes, a large number of presentations were<br />
also organised. <strong>IMMOEAST</strong> took part in all major international property conferences and presented<br />
itself at road shows in London, Paris, Frankfurt, Munich, Stockholm, Amsterdam, Zurich, Geneva, New<br />
York, San Francisco, Boston, Sydney and Melbourne. The members of the Executive Board held more<br />
than 250 individual meetings and 30 group presentations in <strong>2006</strong>/<strong>07</strong>. These activities played a key role<br />
in making <strong>IMMOEAST</strong> the most important property share for Central, Eastern and South-eastern Europe<br />
on global financial markets.<br />
The following investment houses have published analyses on the <strong>IMMOEAST</strong> share:<br />
— CA IB<br />
— Credit Suisse<br />
— Deutsche Bank<br />
— Erste Bank<br />
— Exane BNP Paribas<br />
— ING<br />
— Kempen & Co<br />
— Merrill Lynch<br />
— Morgan Stanley<br />
— RCB<br />
Regular information for private shareholders carries the same importance as communications with<br />
institutional investors. The vehicles used to provide this information include press reports and the<br />
“<strong>IMMOEAST</strong> <strong>Report</strong>” newsletter as well as participation in shareholder trade fairs such as the GEWINN<br />
in Vienna and the “Moneyworld” in Salzburg.<br />
Financial Calendar<br />
13 September 20<strong>07</strong> 8th <strong>Annual</strong> General Meeting<br />
14 September 20<strong>07</strong> <strong>Report</strong> on the First Quarter as of 31 July 20<strong>07</strong><br />
20 December 20<strong>07</strong> <strong>Report</strong> on the First Six Months as of 31 October 20<strong>07</strong><br />
20 March 2008 <strong>Report</strong> on the First three Quarters as of 31 January 2008<br />
Investor Relations<br />
<strong>Report</strong> by the Executive Board 49<br />
Highlights <strong>2006</strong>/<strong>07</strong><br />
Business Model and Strategy<br />
Portfolio Structure<br />
Corporate Governance and Outlook<br />
Property Portfolio<br />
Development of Business<br />
Consolidated Financial Statements<br />
Service and Glossary<br />
Presentations and road shows<br />
in numerous financial centres<br />
throughout Europe
50 <strong>IMMOEAST</strong> <strong>Annual</strong> <strong>Report</strong> <strong>2006</strong>/<strong>07</strong><br />
Information on the <strong>IMMOEAST</strong> share<br />
Contact for investor relations Margit Hermentin<br />
Shareholders’ telephone +43/1/532 87 60-0<br />
E-mail investor@immoeast.com<br />
Internet www.immoeast.com<br />
Stock market Vienna Stock Exchange: Standard Market, Prime Market segment, Ticker Symbol IEA<br />
Warsaw Stock Exchange (since May 20<strong>07</strong>): Main Market, Ticker Symbol IEA<br />
ISIN AT0000642806<br />
Reuters IMEA.VI<br />
Bloomberg IEA AV Equity<br />
Included in the following indexes WBI, ATX Prime, Immobilien-ATX, EPRA, GPR 15, GPR 20, CA IB Emerging Europe Real Estate Index, MSCI World,<br />
MSCI World Real Estate, MSCI Europe, DJ Euro Stoxx, DJ Stoxx 600, FTSE World Europe, FTSE World Mid Cap<br />
IPO 12.12.2003<br />
Key Data on the <strong>IMMOEAST</strong> share<br />
<strong>2006</strong>/<strong>07</strong> Change in % 2005/06 2004/05<br />
Equity as of 30.4. in EUR mill. 4,9<strong>07</strong>.3 195.3% 1,662.0 4<strong>07</strong>.7<br />
Number of shares as of 30.4. in mill. 555.9 150.0% 222.4 59.3<br />
<strong>Annual</strong> high in EUR 12.0 29.0% 9.3 7.3<br />
<strong>Annual</strong> low in EUR 8.2 18.8% 6.9 6.1<br />
Price at year-end in EUR 10.4 20.9% 8.6 7.2<br />
Market capitalisation as of 30.4. in EUR mill. 5,751.2 200.8% 1,912.2 428.7<br />
Stock market turnover in EUR mill.<br />
Fair value as of 30.4. in EUR mill.<br />
5,831.7 114.6% 2,717.4 197.9<br />
(incl. contracted investments) 9,019.2 115.7% 4,181.0 648.8 *)<br />
Net asset value per share in EUR 10.2 21.4% 8.4 7.7<br />
Earnings per share in EUR 1.0 25.0% 0.8 1.0<br />
Price/earnings ratio as of 30.4.<br />
*) Fair value, excl. contracted investments<br />
10.2 -7.3% 11.0 7.5<br />
Market Capitalisation and Weighting in the ATX Prime Market<br />
Weighted by free float as of 29.6.20<strong>07</strong><br />
Company Market capitalisation EUR mill. Weighting in %<br />
Erste Bank der Österreichischen Sparkassen AG 13,298.9 15.1%<br />
OMV AG 11,135.3 12.6%<br />
Raiffeisen International Bank Holding AG 8,402.0 9.5%<br />
VOESTALPINE AG 7,425.0 8.4%<br />
Telekom Austria AG 6,382.5 7.2%<br />
IMMOFINANZ AG 4,961.8 5.6%<br />
<strong>IMMOEAST</strong> AG 4,365.1 5.0%<br />
Wienerberger AG 4,057.0 4.6%<br />
Verbundgesellschaft AG KAT. A 2,860.3 3.2%<br />
Wiener Städtische Versicherung AG 2,772.0 3.1%<br />
Andritz AG 1,910.6 2.2%<br />
CA Immobilien Anlagen AG 1,903.1 2.2%<br />
BOEHLER-UDDEHOLM AG 1,887.0 2.1%<br />
Conwert Immobilien Invest AG 1,220.6 1.4%<br />
Flughafen Wien AG 1,151.6 1.3%
Corporate<br />
Governance<br />
<strong>Report</strong><br />
Commitment to the Austrian Corporate Governance Code<br />
The Austrian Corporate Governance Code is a voluntary, self-regulating work that comprises elements<br />
of Austrian stock corporation law and recognised international standards of good corporate<br />
management. The goals of the code include the creation of more transparent corporate structure<br />
and effective control as well as the provision of information on the financial position and development<br />
of a company to all stakeholder groups. <strong>IMMOEAST</strong> is committed to compliance with the rules<br />
of the Austrian Corporate Governance Code in its current version from January <strong>2006</strong>, and is dedicated<br />
to the principles of responsible management in order to realise a sustainable and long-term<br />
increase in the value of the company. Furthermore, special emphasis is placed on the development<br />
and continuous improvement of an efficient system of corporate control and risk management.<br />
The code comprises important legal requirements (“L rules”) as well as recognised international<br />
standards, whereby any failure to observe these standards (“C rules”) must be disclosed and<br />
explained. In addition, the code includes a number of recommendations (“R rules”) that exceed<br />
mandatory requirements and call for voluntary compliance. <strong>IMMOEAST</strong> complied with the Austrian<br />
Corporate Governance Code during the <strong>2006</strong>/<strong>07</strong> financial year. The company deviated from the following<br />
C rule during the past year, and explains this difference as follows:<br />
Rule 18<br />
Depending on the size of a company, an internal audit function must be installed as a separate staff<br />
department or these activities must be outsourced to a qualified institution. A risk analysis performed<br />
by <strong>IMMOEAST</strong> indicated that the creation of a traditional internal audit department would<br />
not support the reasonable optimisation of risk management because of the specific characteristics<br />
of the group. In accordance with the results of this analysis, internal control and audit functions are<br />
carried out as part of group controlling activities. The Executive Board provides regular reports to<br />
the Supervisory Board on the results of monitoring and controls. <strong>IMMOEAST</strong> will also comply with<br />
the regulations of the Austrian Corporate Governance Code during the 20<strong>07</strong>/08 financial year. Since<br />
an internal audit department was established as a separate staff department at the beginning of<br />
20<strong>07</strong>/08, <strong>IMMOEAST</strong> now also meets the requirements defined in rule 18 of the code.<br />
Executive Board and Supervisory Board<br />
Members of the Executive Board<br />
Karl Petrikovics, born 20 May 1954, appointed to 30 April 2010<br />
Chairman and Chief Executive Officer<br />
Norbert Gertner, born 15 February 1956, appointed to 30 April 2010<br />
Member of the Executive Board<br />
Christian Thornton, born 28 January 1969, appointed to 30 April 2010<br />
Member of the Executive Board<br />
Edgar Rosenmayr, born 14 November 1956, appointed to 30 April 2010<br />
Deputy Member of the Executive Board<br />
<strong>Report</strong><br />
<strong>Report</strong> by the Executive Board 51<br />
Highlights <strong>2006</strong>/<strong>07</strong><br />
Business Model and Strategy<br />
Portfolio Structure<br />
Corporate Governance and Outlook<br />
Property Portfolio<br />
Development of Business<br />
Consolidated Financial Statements<br />
Service and Glossary<br />
Support for Code in the<br />
version from January <strong>2006</strong>
52 <strong>IMMOEAST</strong> <strong>Annual</strong> <strong>Report</strong> <strong>2006</strong>/<strong>07</strong><br />
Full attendance at all all meetings,<br />
four of of five Supervisory Board<br />
members declare<br />
their independance<br />
No remuneration for the<br />
Executive Board due to<br />
management management contract<br />
Members of the Supervisory Board<br />
Helmut Schwager, born 14 November 1943<br />
Chairman of the Supervisory Board. First appointed on 3 September 2001, current term ends with<br />
the annual general meeting in 2010. Member of the Managing Board of Constantia Packaging AG.<br />
Positions on the supervisory boards of other listed companies: member of the Supervisory Board<br />
of IMMOFINANZ AG.<br />
Wolfgang Reithofer, born 30 December 1948<br />
Vice-Chairman. First appointed on 3 September 2001, current term ends with the annual general<br />
meeting in 2010. Chief Executive Officer of Wienerberger AG. No other positions on the supervisory<br />
boards of listed companies.<br />
Christian Böhm, born 20 September 1958<br />
Member. First appointed on 9 October 2003, current term ends with the annual general meeting in<br />
2010. Chairman of the Managing Board of APK-Pensionskasse AG. No other positions on the supervisory<br />
boards of listed companies.<br />
Herbert Kofler, born 14 May 1949<br />
Member. First appointed on 9 October 2003, current term ends with the annual general meeting<br />
in 2010. Professor and Head of the Department for Business Finance and Taxes at the University of<br />
Klagenfurt. No other positions on the supervisory boards of listed companies.<br />
Audit Committee and activities of the Supervisory Board<br />
The Supervisory Board created an Audit Committee to deal with issues concerning the accounting<br />
and audit of the company and the group. The members of this committee are Herbert Kofler (Chairman),<br />
Wolfgang Reithofer and Christian Böhm. Helmut Kofler has been designated as the financial<br />
expert in accordance with the provisions of the Austrian Corporate Governance Code. The rules of<br />
procedure for the Supervisory Board call for the creation of additional committees only when this<br />
body has more than six members.<br />
The Supervisory Board held four meetings during the <strong>2006</strong>/<strong>07</strong> financial year; all members of the<br />
Supervisory Board were present at every meeting. The financial position and corporate strategy as<br />
well as important events and investments were discussed at these meetings. In addition, the Chairmen<br />
of the Executive Board and Supervisory Board conferred regularly on major events and decisions<br />
between the meetings. The approval of the Supervisory Board was requested for all investment and<br />
sale decisions after written and verbal reports had been provided. The members of the Supervisory<br />
Board have defined criteria for independence in accordance with the guidelines established by the<br />
Austrian Corporate Governance Code. Every member of this body evaluated his position and, with<br />
the exception of Helmut Schwager, all members are considered to be independent.<br />
Remuneration<br />
Based on the management contract with Constantia Privatbank, the members of the <strong>IMMOEAST</strong><br />
Executive Board do not receive any remuneration from the company. The remuneration for the Supervisory<br />
Board is determined by the annual general meeting, and equalled TEUR 97.5 in <strong>2006</strong>/<strong>07</strong> (for<br />
work performed by the Supervisory Board during 2005/06). Details are provided in the notes to<br />
the financial statements on page 233. The members of the Executive Board and Supervisory Board<br />
owned a total of 295,345 <strong>IMMOEAST</strong> shares as of 30 April 20<strong>07</strong> (558,631 shares as of 31 July 20<strong>07</strong>).<br />
No options have been issued for <strong>IMMOEAST</strong> shares. Information on the purchase and sale of the<br />
company’s shares by members of the Executive Board and Supervisory Board is provided on the<br />
<strong>IMMOEAST</strong> website www.immoeast.com under “Directors´ Dealings”.
Transactions with related parties<br />
<strong>IMMOEAST</strong> is a subsidiary of IMMOFINANZ AG, which holds 50.46% of the shares and voting rights.<br />
Constantia Privatbank Aktiengesellschaft as well as its corporate bodies and subsidiaries are considered<br />
related parties in the sense of IAS 24. In addition to services provided on the basis of the<br />
management contract, a wide range of other services are performed by these companies at arm’s<br />
length. Detailed information on this subject is provided in the notes to the financial statements<br />
beginning on page 231.<br />
Compliance<br />
In accordance with the Issuer Compliance Regulations issued by the Austrian Financial Markets<br />
Supervisory Authority, <strong>IMMOEAST</strong> defined internal rules for the distribution of data, in order to<br />
prevent the misuse of insider information. <strong>IMMOEAST</strong> has extended these rules to also cover the<br />
Supervisory Board, and monitors compliance on a regular basis.<br />
External evaluation<br />
The implementation and correctness of the statement of compliance by <strong>IMMOEAST</strong> were examined<br />
by KPMG Wirtschaftsprüfungs- und Steuerberatungs GmbH based on the rules issued by the<br />
International Federation of Accountants (IFAC) for activities related to the review of annual financial<br />
statements (ISRE 2400).<br />
Summary of the evaluation of compliance with the<br />
Austrian Corporate Governance Code during the <strong>2006</strong>/<strong>07</strong> Business Year<br />
We have evaluated compliance with the Austrian Corporate Governance Code by the Executive Board and Supervisory<br />
Board of <strong>IMMOEAST</strong> AG, Vienna, as presented in the public statement made by the Executive Board. The Executive<br />
Board and Supervisory Board of the company are responsible for compliance with the individual regulations as<br />
well as public reporting. Our responsibility is to issue a report on compliance with the regulations of the code based<br />
on our evaluation. We conducted our evaluation in accordance with the rules issued by the International Federation<br />
of Accountants (IFAC) for activities related to the review of annual financial statements (ISRE 2400). These principles<br />
require that we plan and perform the evaluation to obtain reasonable assurance about whether the statement<br />
by the Executive Board on compliance with the Corporate Governance Code is free of material misstatements. The<br />
evaluation basically includes interviews with the responsible persons as well as an examination, on a test basis,<br />
of compliance with the Austrian Corporate Governance Code. We performed our evaluation based on the questionnaire<br />
issued by the Austrian Working Group for Corporate Governance. Our evaluation we did not reveal any facts<br />
that conflict with the statement issued by the Executive Board on compliance with the provisions of the Austrian<br />
Corporate Governance Code. Our liability as auditors of the annual financial statements is determined by the provisions<br />
of § 275 Par. 2 of the Austrian Commercial Code.<br />
Vienna, 1 August 20<strong>07</strong><br />
KPMG<br />
Wirtschaftsprüfungs- und Steuerberatungs GmbH<br />
Yann-Georg Hansa Günther Hirschböck<br />
Certified Public Accountants Certified Public Accountants<br />
<strong>Report</strong><br />
<strong>IMMOEAST</strong> is listed on the Vienna Stock Exchange and, since 25 May 20<strong>07</strong>, also on the Warsaw<br />
Stock Exchange. In addition to the Austrian Corporate Governance Code, <strong>IMMOEAST</strong> also declares<br />
its support for the “Best Practices in Public Companies”, a guideline issued by the Warsaw Stock<br />
Exchange, and follows these rules to the greatest extent possible. Deviations from this guideline<br />
are related primarily to rules that are not met because of the company’s primary focus on Austrian<br />
regulations. Detailed information on the Polish corporate governance regulations is provided on the<br />
<strong>IMMOEAST</strong> homepage under www.immoeast.com.<br />
<strong>Report</strong> by the Executive Board 53<br />
Highlights <strong>2006</strong>/<strong>07</strong><br />
Business Model and Strategy<br />
Portfolio Structure<br />
Corporate Governance and Outlook<br />
Property Portfolio<br />
Development of Business<br />
Consolidated Financial Statements<br />
Service and Glossary<br />
Continuous monitoring of<br />
rules defined by Issuer<br />
Compliance Compliance Regulations<br />
KPMG KPMG evaluates<br />
implementation implementation and and<br />
correctness of statement<br />
of compliance<br />
compliance
<strong>Report</strong> of the<br />
Supervisory Board<br />
Continuous involvement of the<br />
Supervisory Board<br />
Successful continuation of<br />
expansion course creates basis<br />
for excellent results<br />
The Supervisory Board and the Executive Board worked closely together during <strong>2006</strong>/<strong>07</strong> for the<br />
benefit of the company and in accordance with the principles of good corporate governance. The<br />
financial position and strategic development of the company as well as major events and investments<br />
were discussed extensively and candidly at these meetings. Specific issues and decisions<br />
were evaluated between the meetings in discussions between the Chairmen of the Supervisory<br />
Board and Executive Board. The investments planned by the company were deliberated and analysed<br />
in detail at the Supervisory Board meetings, and the Executive Board requested and received<br />
the approval of the Supervisory Board for all investment and sale transactions after providing verbal<br />
and written reports. In particularly urgent cases, the Supervisory Board passed its resolutions in<br />
writing.<br />
The activities of the Supervisory Board during the <strong>2006</strong>/<strong>07</strong> financial year focused above all on<br />
examining the long-term business opportunities for the company together with the Executive Board<br />
and thereby setting the course for the profitable expansion strategy of <strong>IMMOEAST</strong> AG. In order<br />
to finance the company’s investment programme, the <strong>Annual</strong> General Meeting approved a capital<br />
increase in March <strong>2006</strong>; this capital market transaction was carried out during May and June<br />
<strong>2006</strong>. It is an impressive confirmation of the positive development of the company that the entire<br />
proceeds from this capital increase have already been invested in a large number of acquisitions or<br />
development projects and generated excellent results in <strong>2006</strong>/<strong>07</strong>.<br />
The Executive Board provided the Supervisory Board with regular, timely and comprehensive verbal<br />
and written reports and information on all key issues concerning the development of business and<br />
the risk position of the company. This enabled the Supervisory Board to monitor and support the<br />
management activities of the Executive Board on a continuous basis.<br />
The Supervisory Board held four meetings during the <strong>2006</strong>/<strong>07</strong> financial year, which were attended<br />
by all members.<br />
The Audit Committee of the Supervisory Board met once during the reporting year. In the presence<br />
of the auditor, the Audit Committee discussed the annual financial statements, consolidated<br />
financial statements and recommendation for the distribution of profits, and recommended that the<br />
Supervisory Board approve the annual financial statements. The Audit Committee obtained a state-
ment of independence from the auditor and issued a recommendation for the election of the auditor<br />
for the <strong>2006</strong>/<strong>07</strong> financial year. The Supervisory Board of <strong>IMMOEAST</strong> AG supports compliance with<br />
the Austrian Corporate Governance Code, and thereby also endorses the principles of responsible<br />
corporate management and control as well as the achievement of a high degree of transparency for<br />
all stakeholders of the company. A summary of the measures taken by <strong>IMMOEAST</strong> AG to implement<br />
the Austrian Corporate Governance Code is presented in the annual report and on the homepage<br />
of the company.<br />
Since the terms of office for the members of the Executive Board were scheduled to expire on<br />
30 April 20<strong>07</strong>, the Supervisory Board also dealt with the issue of succession planning for this body<br />
during the reporting year. In addition to the reappointment of Karl Petrikovics and Norbert Gertner,<br />
the Supervisory Board appointed Christian Thornton as a full member of the Executive Board and<br />
Edgar Rosenmayr as a deputy member of the Executive Board effective 1 May 20<strong>07</strong>. These appointments<br />
will secure the valuable experience of two long-standing <strong>IMMOEAST</strong> key managers for the<br />
benefit of the company in the future. Furthermore, Karl Petrikovics was reappointed as Chairman of<br />
the Executive Board and Chief Executive Officer.<br />
The annual financial statements and management report of <strong>IMMOEAST</strong> AG as of 30 April 20<strong>07</strong><br />
(<strong>2006</strong>/<strong>07</strong> financial year), which were prepared by the Executive Board, as well as the consolidated<br />
financial statements and consolidated management report as of 30 April 20<strong>07</strong> (<strong>2006</strong>/<strong>07</strong> financial<br />
year), which were prepared by the Executive Board in accordance with International Financial<br />
<strong>Report</strong>ing Standards (IFRS), were audited by KPMG Austria GmbH Wirtschaftsprüfungs- und Steuerberatungsgesellschaft<br />
and awarded an unqualified opinion. All documentation for the financial<br />
statements as well as the audit reports, management letter and recommendation for the distribution<br />
of profit were discussed in detail by the Audit Committee in the presence of the auditor and<br />
presented to the Supervisory Board. The Supervisory Board has examined this documentation as<br />
required by § 96 of the Austrian Stock Corporation Act and accepted the annual financial statements<br />
for <strong>2006</strong>/<strong>07</strong>, which are therefore considered approved in accordance with § 125 (2) of the Austrian<br />
Stock Corporation Act. The Supervisory Board also declared its agreement with the consolidated<br />
financial statements and consolidated management report, and approved the recommendation of<br />
the Executive Board for the use of retained earnings. The annual report by the internal audit department<br />
did not identify any risks which, in the absence of controls, could have a material effect on<br />
the continued existence or development of business in the company. Consequently, there were no<br />
grounds for objections.<br />
Erhard Schaschl, who was a member of the Supervisory Board since 9 October 2003, resigned at the<br />
end of February 20<strong>07</strong> for personal reasons. The Supervisory Board would like to thank him for his<br />
many years of service and valuable contribution to the successful development of the company.<br />
In conclusion, the Supervisory Board would like to thank the management and employees of<br />
<strong>IMMOEAST</strong> AG for their commitment and performance during <strong>2006</strong>/<strong>07</strong>.<br />
Vienna, 9 July 20<strong>07</strong><br />
Helmut Schwager<br />
Chairman of the Supervisory Board<br />
<strong>Report</strong> of the Supervisory Board<br />
<strong>Report</strong> by the Executive Board 55<br />
Highlights <strong>2006</strong>/<strong>07</strong><br />
Business Model and Strategy<br />
Portfolio Structure<br />
Corporate Governance and Outlook<br />
Property Portfolio<br />
Development of Business<br />
Consolidated Financial Statements<br />
Service and Glossary<br />
Expansion of Executive Board<br />
and extension of contracts for<br />
current members<br />
Acceptance and approval of<br />
annual financial statements
Future<br />
Developments<br />
PLANNED INVESTMENT PROGRAMME OF<br />
NEARLY EUR 6 BILLION AT RECORD LEVEL<br />
��������������������������������������<br />
������������������������������������������<br />
���������������������������������������<br />
����������������������������������������<br />
������������������������������������<br />
����������������������������������������<br />
����������������������������������������<br />
������������������������������������<br />
�����������������������������������
Investment Programme 20<strong>07</strong>/08<br />
Investment Programme 20<strong>07</strong>/08<br />
Acquisitions of EUR 6 billion<br />
<strong>IMMOEAST</strong> plans to carry out an investment programme with a total volume of nearly EUR 6 billion<br />
during 20<strong>07</strong>. These expansion steps will be financed with the proceeds from the capital increase<br />
that was completed in May 20<strong>07</strong>, which raised equity of EUR 2.84 billion. That means the financing<br />
– including a debt component of roughly 50% – for the full range of investments is now secured. The<br />
20<strong>07</strong>/08 investment programme will top the previous high marked by the EUR 5 billion acquisition<br />
programme in <strong>2006</strong>/<strong>07</strong> by roughly EUR 1 billion.<br />
The investment programme for the coming year was prepared in detail during <strong>2006</strong>/<strong>07</strong>. All projects<br />
were evaluated and analysed by the <strong>IMMOEAST</strong> asset management department at the start of the<br />
financial year and presented to the Supervisory Board for approval. 77% of the investment volume<br />
have been approved by the Supervisory Board and is now in the final stage of negotiations or due<br />
diligence, and 23% were completed before the end of the reporting year on 30 April 20<strong>07</strong>.<br />
These broad-based investments will also lead to a fundamental change in the structure of the<br />
<strong>IMMOEAST</strong> portfolio. New geographic and sector focal points will be established, and adjustments<br />
will also be made to the structure of investments:<br />
— From a geographic standpoint, the focus of investments will shift from Central and Eastern<br />
Europe (Poland, Slovakia, Czech Republic, Hungary) to South-eastern Europe (Romania,<br />
Bulgaria, Croatia, Serbia and Slovenia). The portfolio as of 30 April 20<strong>07</strong> shows a dominating<br />
share of 57.4% for the countries of Central and Eastern Europe that joined the EU in 2004,<br />
while the latest investment programme includes 43.26% for South-eastern Europe and only<br />
32.81% for Central and Eastern Europe. The share of investments in Russia and Ukraine, which<br />
previously represented only 7.4% of the Group’s investment properties, will be significantly<br />
increased and is reflected in a 23.91% share of the 20<strong>07</strong>/08 investment programme.<br />
— The sector focus shows a clear shift toward retail properties: approx. 61% of investments will<br />
be directed to this market in 20<strong>07</strong>/08, while the comparable portfolio figure for <strong>2006</strong>/<strong>07</strong><br />
equalled only approx. 30%. Parallel to this development, the office sector will be reduced<br />
from its previous overriding level of 37.7% to roughly 30% of new investments. The increasing<br />
concentration on the retail sector will also lead to a reduction of investments in the logistics<br />
and residential areas.<br />
— The share of investments in development projects will also rise significantly. In the 20<strong>07</strong>/08<br />
investment programme, these projects represent two-thirds of the total volume. Nearly 9% of<br />
investments will represent the acquisition of stakes in other property companies, generally in<br />
property developers. However, this figure does not include the purchase of objects developed<br />
by companies in which <strong>IMMOEAST</strong> is a shareholder. For this reason, the strategic importance<br />
of participations in other companies is not reflected in the nominal percentage of these holdings<br />
in relation to the total investment volume.<br />
<strong>Report</strong> by the Executive Board 57<br />
Highlights <strong>2006</strong>/<strong>07</strong><br />
Business Model and Strategy<br />
Portfolio Structure<br />
Corporate Governance and Outlook<br />
Property Portfolio<br />
Development of Business<br />
Consolidated Financial Statements<br />
Service and Glossary<br />
Proceeds of EUR 2.84 billion<br />
from the capital increase in<br />
May 20<strong>07</strong> support the largest<br />
investment programme to<br />
date by <strong>IMMOEAST</strong><br />
Investment Investment programme<br />
programme<br />
triggers geographic and<br />
sector changes
58 <strong>IMMOEAST</strong> <strong>Annual</strong> <strong>Report</strong> <strong>2006</strong>/<strong>07</strong><br />
Investment programme<br />
20<strong>07</strong>/08 of EUR 6 billion<br />
by sector<br />
As of 30.4.20<strong>07</strong><br />
The increase in the share of development projects will also strengthen the earnings potential of the<br />
portfolio. As a rule, <strong>IMMOEAST</strong> does not take on the full development risk associated with these<br />
projects but acts in cooperation with local or international developers. The agreements concluded<br />
for development projects generally transfer the risk associated with the construction of a property<br />
– and frequently also the full or partial risk of rental – to the developer. Although these agreements<br />
reduce the earnings opportunities for <strong>IMMOEAST</strong>, they permit the exact management and<br />
limitation of risk.<br />
Residential 4.0%<br />
Logistics 5.0%<br />
Offices 30.0%<br />
Transactions and investment properties in figures<br />
and in the annual financial statements<br />
Significant parts of the 20<strong>07</strong>/08 investment programme will not be recognised in the financial statements<br />
for that financial year, in particular development projects. The costs for these projects are<br />
distributed regularly over several financial years and are therefore not recognised in total at the<br />
same time but in stages over a number of accounting periods. This procedure automatically leads<br />
to major differences between the presentation of the property portfolio and investment programme<br />
from a commercial standpoint, on the one hand, and the property portfolio and investments as<br />
reported on the balance sheet and cash flow statement (cash flow from investing activities), on the<br />
other hand.<br />
Construction projects or forward purchases are typical examples of projects that involve the accounting<br />
recognition of a major part of the contracted investments in subsequent periods. For construction<br />
projects, only the generally minor cost of the land is recorded when the investment decision is<br />
made; the substantially higher construction costs are reflected in the financial statements during<br />
later periods as development progresses. Forward purchases – for example, an agreement with a<br />
developer to acquire an office building at a fixed price after completion – are recognised in full only<br />
in later periods.<br />
61.0% Retail
Strategic partnerships 9.0%<br />
Investment properties 25.0%<br />
Central and Eeastern<br />
Europe (CEE) 32.8%<br />
Commonwealth of<br />
Independent States<br />
(CIS 23.9%<br />
Subsequent Events<br />
Subsequent Events<br />
66.0% Development properties<br />
43.3% South-eastern Europe (SEE)<br />
Continuation of growth course<br />
On the first day of the 20<strong>07</strong>/08 financial year, <strong>IMMOEAST</strong> started the largest issue of shares in the<br />
history of the company: the capital increase carried out from 2 to 21 May 20<strong>07</strong> led to the sale of<br />
277.9 million new shares. The issue price was determined through a bookbuilding procedure, and<br />
equalled EUR 10.20 per share. The volume of the issue totalled EUR 2.84 billion. This capital market<br />
transaction by <strong>IMMOEAST</strong> was the largest issue to date by a European property company and the<br />
second largest capital increase by a listed company in Austria.<br />
Strong demand by institutional and private investors led to the easy placement of the issue, which<br />
was oversubscribed roughly two-times. The public offering in Poland also generated substantial<br />
interest (see text box: “Second listing in Warsaw”). The majority shareholder IMMOFINANZ exercised<br />
its subscription rights in full and continues to hold a stake of 50.46%.<br />
This capital market transaction led to a strong increase in the market capitalisation of <strong>IMMOEAST</strong>.<br />
At the end of June the stock exchange value of the company totalled EUR 8.7 billion That makes<br />
<strong>IMMOEAST</strong> the Number 2 listed property company in Continental Europe. A ranking of property companies<br />
that focus on investments in Central, Eastern and South-eastern Europe and the successor<br />
states of the former Soviet Union shows <strong>IMMOEAST</strong> with a substantial lead as Number 1.<br />
<strong>Report</strong> by the Executive Board 59<br />
Highlights <strong>2006</strong>/<strong>07</strong><br />
Business Model and Strategy<br />
Portfolio Structure<br />
Corporate Governance and Outlook<br />
Property Portfolio<br />
Development of Business<br />
Consolidated Financial Statements<br />
Service and Glossary<br />
Investment programme<br />
20<strong>07</strong>/08 of EUR 6 billion<br />
by type of investment<br />
As of 30.4.20<strong>07</strong><br />
Investment programme<br />
20<strong>07</strong>/08 of EUR 6 billion<br />
by primary segment<br />
As of 30.4.20<strong>07</strong><br />
Successful EUR 2.84 billion<br />
capital increase<br />
Issue clearly over-subscribed<br />
despite record volume
60 <strong>IMMOEAST</strong> <strong>Annual</strong> <strong>Report</strong> <strong>2006</strong>/<strong>07</strong><br />
Supervisory Board expands<br />
Executive Board to reflect reflect<br />
increasing scope of business<br />
activities<br />
Investment programme for<br />
20<strong>07</strong>/08 with record volume of<br />
nearly EUR 6 billion<br />
Expansion of the Executive Board<br />
The Executive Board of <strong>IMMOEAST</strong> was also expanded at the start of the 20<strong>07</strong>/08 financial year to<br />
reflect the strong growth in the scope of business activities. Christian Thornton, the long-standing<br />
head of Group accounting at <strong>IMMOEAST</strong>, was appointed as a new member of the Executive Board.<br />
In this position, Thornton will also be responsible for finances. Furthermore, Edgar Rosenmayr, one<br />
of the leading asset managers of <strong>IMMOEAST</strong>, was appointed to the Executive Board as a deputy<br />
member. The <strong>Annual</strong> General Meeting in September 20<strong>07</strong> will be asked to approve an amendment<br />
to the Articles of Association, which will permit an increase in the Executive Board to more than the<br />
three members currently allowed.<br />
Fast start for new investment programme<br />
<strong>IMMOEAST</strong> will use the funds raised by the capital increase in May 20<strong>07</strong> to finance an extensive<br />
investment programme with a total volume of EUR 5.975 billion. Since the <strong>2006</strong>/<strong>07</strong> investment programme<br />
was completed in full after only three quarters, several projects from the new programme<br />
were started earlier than originally planned and transactions with a volume of EUR 1.4 billion were<br />
concluded at the start of 20<strong>07</strong>/08. Investments of EUR 2.3 billion – or roughly 38% of the total<br />
planned volume for the year – were realised after only two months by the end of June 20<strong>07</strong>. The most<br />
important transactions concluded after the end of the reporting period include the following:<br />
— Gold Plaza Shopping Centre (Romania)<br />
<strong>IMMOEAST</strong> acquired 80% of the Gold Plaza development project in Baia Mare, a city with a<br />
population of 150,0000. The investment volume for this property totals EUR 97 million. The<br />
shopping centre with 43,000 sqm of letable space is scheduled for completion during the<br />
fourth quarter of 2008, and <strong>IMMOEAST</strong> plans to acquire the remaining shares at that time.<br />
— Pantelimon + Logistics Developments (Romania)<br />
Together with a local partner, <strong>IMMOEAST</strong> has signed an agreement to develop ten logistics<br />
centres in Romania with 400,000 to 500,000 sqm of letable space. The investment volume will<br />
equal roughly EUR 300 million. The first project, the Pantelimon Warehouse Logistics Centre<br />
(52,000 sqm) on the outskirts of Bucharest, will be completed later this year.<br />
— Euro Mall Pitesti (Romania)<br />
The Euro Mall in the university city of Pitesti was acquired for EUR 87 million. This facility was<br />
completed in May 20<strong>07</strong> and is fully occupied. The Euro Mall Pitesti meets the highest international<br />
standards and has 32,000 sqm of letable space.<br />
— Rondo Jazdy Polskiej (Poland)<br />
The Rondo Jazdy Polskiej office project in the centre of Warsaw is under development by S+B<br />
CEE, an <strong>IMMOEAST</strong> shareholding. This object has excellent connections to the transportation<br />
network and will be completed in summer 2009; the investment volume totals EUR 36 million.
Subsequent Events<br />
— TriGránit Urban Development Projects in St. Petersburg (Russia)<br />
The property developer TriGránit (<strong>IMMOEAST</strong> stake 25%) and the city government of<br />
St. Petersburg have signed a framework agreement covering a number of major urban<br />
development projects. This makes TriGránit the most important developer in this<br />
second largest city in Russia.<br />
— STOP.SHOP. Offensive (Czech Republic)<br />
<strong>IMMOEAST</strong> has started an extensive investment programme in the retail sector of the Czech<br />
Republic. Beginning in autumn of this year, 18 new specialty shopping centres will be opened<br />
at a rate of nearly one each month up to the end of 2009. Construction has started on nearly<br />
all objects. The letable space in all properties amounts to roughly 115,000 sqm and a total of<br />
EUR 137 million will be invested.<br />
— S-Park (Romania)<br />
In the booming northern district of Bucharest, <strong>IMMOEAST</strong> acquired the S-park office development<br />
project with 45,000 sqm. The object was fully let before its completion in August 20<strong>07</strong>.<br />
A detailed list of investments made after the end of the reporting period is provided on page 254f.<br />
<strong>Report</strong> by the Executive Board 61<br />
Highlights <strong>2006</strong>/<strong>07</strong><br />
Business Model and Strategy<br />
Portfolio Structure<br />
Corporate Governance and Outlook<br />
Property Portfolio<br />
Development of Business<br />
Consolidated Financial Statements<br />
Service and Glossary<br />
Second listing of <strong>IMMOEAST</strong> on the Warsaw Stock Exchange<br />
<strong>IMMOEAST</strong> combined its most recent capital increase with a second listing on the Warsaw Stock<br />
Exchange, and trading began on 25 May 20<strong>07</strong>. Prior to this date, <strong>IMMOEAST</strong> shares were tendered to<br />
private investors in Poland through a public subscription offer. This issue drew substantial interest<br />
and was heavy oversubscribed, with the banks unable to fill all orders by Polish investors.<br />
The start of trading on the Warsaw Stock Exchange represents an important step by <strong>IMMOEAST</strong> to<br />
broaden the international structure of its shareholder base. In addition to numerous institutional<br />
investors that hold stakes in the company, there are now a larger number of private shareholders<br />
outside Austria. <strong>IMMOEAST</strong> was also able to add numerous shareholders through public subscription<br />
offerings in the Czech Republic and Slovakia during <strong>2006</strong>/<strong>07</strong>.<br />
The listing in Warsaw is also of major importance for institutional investors. <strong>IMMOEAST</strong> has always<br />
been an “eastern company” from a business standpoint, but its listing in Vienna as an Austrian<br />
corporation marked it as a “western company” – and, for this reason, some institutional investors<br />
were unable to purchase <strong>IMMOEAST</strong> shares based on their investment guidelines. That problem has<br />
now been eliminated with the start of trading in Warsaw. <strong>IMMOEAST</strong> management has confirmed<br />
that there are no plans to apply for further stock exchange listings at the present time.
Property Portfolio<br />
���������������<br />
�����������������<br />
OFFICE PROPERTIES<br />
BG-Sofia<br />
Antim I<br />
BG-Sofia iNi<br />
Antim Tower<br />
BG-Sofia iNi<br />
Antim Tower (3 Projects)<br />
BG-Sofia iNi<br />
Enterprise Building<br />
(2 Objects)<br />
BG-Sofia iNi<br />
Elite<br />
CZ-Brno iNi<br />
Brno Business Park I<br />
(2 Objects)<br />
iNi =New<br />
CZ-Brno iNi<br />
Brno Business Park II<br />
(2 Projects)<br />
CZ-Brno iNi<br />
OC Petrov<br />
CZ-Prague<br />
Airport Business Center<br />
CZ-Prague<br />
Andel Park B<br />
CZ-Prague<br />
Anglická 20<br />
CZ-Prague<br />
Arbes<br />
CZ-Prague iNi<br />
BB Centrum (3 Objects)<br />
CZ-Prague iNi<br />
Diamond Point<br />
CZ-Prague<br />
European Business Center<br />
CZ-Prague iNi<br />
Havodka (4 Objects)<br />
CZ-Prague<br />
Italská<br />
CZ-Prague<br />
Jindrisská 16<br />
CZ-Prague<br />
Jungmannova 15<br />
CZ-Prague iNi<br />
Jungmannova Plaza<br />
CZ-Prague iNi<br />
Kilcullen Portfolio<br />
CZ-Prague<br />
Na Florenci 23<br />
CZ-Prague<br />
Na Prikope 14<br />
CZ-Prague<br />
Pankrác Business Corner
CZ-Prague<br />
Pankrác House<br />
CZ-Prague<br />
Panska 9<br />
CZ-Prague<br />
Pekarska Office<br />
(2 Objects)<br />
CZ-Prague<br />
Perlova 5<br />
CZ-Prague<br />
Prague Office Park I<br />
CZ-Prague<br />
Prague Office Park II<br />
CZ-Prague<br />
Prokopova 20<br />
CZ-Prague iNi<br />
Skofin Office Building<br />
CZ-Prague<br />
Stetkova 18<br />
CZ-Prague<br />
Valdek<br />
CZ-Prague<br />
Vinice<br />
CZ-Prague<br />
Vitek<br />
H-Budapest<br />
Árpád Center<br />
H-Budapest iNi<br />
Central Business Center<br />
H-Budapest<br />
East-West Business Centre<br />
H-Budapest<br />
Globe 3<br />
H-Budapest<br />
Globe 13<br />
H-Budapest<br />
Greenpoint 7<br />
H-Budapest iNi<br />
Haller Gardens<br />
H-Budapest<br />
Mester Business Park<br />
H-Budapest<br />
Óbuda Gate Office Center<br />
H-Budapest<br />
Optima “A” Office Building<br />
H-Budapest iNi<br />
Riverside Offices<br />
Millenium Towers I<br />
Vodafone Building<br />
<strong>Report</strong> by the Executive Board 63<br />
Highlights <strong>2006</strong>/<strong>07</strong><br />
Business Model and Strategy<br />
Portfolio Structure<br />
Corporate Governance and Outlook<br />
Property Portfolio<br />
Development of Business<br />
Consolidated Financial Statements<br />
Service and Glossary<br />
H-Budapest<br />
Szépvölgyi Business Park<br />
H-Budapest<br />
West Gate Business Park<br />
H-Budapest<br />
Xenter 13 Office Building<br />
H iNi<br />
TriGránit Holding Portfolio<br />
(11 Projects)<br />
HR-Zagreb iNi<br />
Grand Center<br />
PL-Krakow<br />
Lubicz Office Building<br />
PL-Poznan<br />
Poznan Financial Center
64 <strong>IMMOEAST</strong> <strong>Annual</strong> <strong>Report</strong> <strong>2006</strong>/<strong>07</strong><br />
PL-Warsaw<br />
Atrium Centrum<br />
PL-Warsaw<br />
Atrium Plaza<br />
PL-Warsaw<br />
BokserskaOfficeCenter<br />
PL-Warsaw iNi<br />
Brama Zachodnia<br />
PL-Warsaw<br />
Crown Point<br />
PL-Warsaw<br />
Crown Tower<br />
iNi =New<br />
PL-Warsaw<br />
Cybernetyki Office Centre<br />
PL-Warsaw<br />
Equator Office iNi<br />
Development (4 Projects)<br />
PL-Warsaw<br />
IO-1<br />
PL-Warsaw<br />
Mistral Office Building<br />
PL-Warsaw iNi<br />
Mokotow Business Park<br />
(9 Objects)<br />
PL-Warsaw iNi<br />
Mokotow Business Park<br />
Vega Development<br />
PL-Warsaw iNi<br />
Mokotow Business Park<br />
Vega Tower<br />
PL-Warsaw iNi<br />
Salzburg Center<br />
PL-Warsaw iNi<br />
Wisniowy Business Park C<br />
PL-Warsaw iNi<br />
Wisniowy Business Park D<br />
PL-Warsaw iNi<br />
Wisniowy Business Park E<br />
PL-Warsaw iNi<br />
Passat Office Building<br />
PL iNi<br />
TriGránit Holding Portfolio<br />
(11 Projects)<br />
RO-Bucharest<br />
Baneasa Airport Tower<br />
RO-Bucharest<br />
Bucharest Corporate<br />
Center BCC<br />
RO-Bucharest<br />
Feper<br />
RO-Bucharest<br />
Global Business Center<br />
RO-Bucharest<br />
Iride Business Park<br />
RO-Bucharest iNi<br />
Iride Business Park IV<br />
RO-Bucharest iNi<br />
Iride Business Park V<br />
RO-Bucharest iNi<br />
Jandarmeriei Street 5-9<br />
RO-Bucharest<br />
Otopeni<br />
RO-Bucharest<br />
Petricani Street<br />
RO-Bucharest<br />
Pipera Center I
RO-Bucharest<br />
Pipera II<br />
RO-Bucharest iNi<br />
Poarta (City Gate)<br />
RO-Bucharest iNi<br />
Victoria Park (4 Projects)<br />
RUS-Moscow<br />
Berlin House<br />
RUS-Moscow<br />
Gogolevsky Boulevard 11<br />
RUS-Moscow<br />
Lesnaya Street 3<br />
RUS-St. Petersburg iNi<br />
Petrovsky Fort<br />
Business Center<br />
SCG iNi<br />
TriGránit Holding Portfolio<br />
SK-Bratislava<br />
Bratislava Business Center<br />
IIIundIV(2Objects)<br />
SK-Bratislava<br />
Bratislava Business<br />
Center V<br />
SK-Bratislava iNi<br />
Lakeside<br />
SK-Bratislava<br />
Polus Center<br />
Millenium Tower I<br />
SK-Bratislava<br />
Polus Center<br />
Millenium Tower II<br />
SK-Bratislava<br />
Polus Center<br />
Millenium Tower III<br />
SK iNi<br />
TriGránit Holding Portfolio<br />
(2 Projects)<br />
RECREATION/HOTEL<br />
PROPERTIES<br />
H-Budapest iNi<br />
Palace of Arts<br />
RETAIL/<br />
COMMERCIAL<br />
PROPERTIES<br />
Investment in iNi<br />
M.O.F. Immobilien AG<br />
(4 Objects)<br />
BG iNi<br />
TriGránit Holding Portfolio<br />
BG-Sofia<br />
Predgarov<br />
CZ-Breclav iNi<br />
My Box Breclav<br />
(MyBoxPhase2)<br />
CZ-Hradec Kralove<br />
Futurum Centrum<br />
CZ-Hranice iNi<br />
STOP.SHOP. Hranice<br />
CZ-Jablonec iNi<br />
My Box Jablonec<br />
(MyBoxPhase2)<br />
CZ-Jihlava iNi<br />
Shopping Centre Jihlava<br />
(Roma)<br />
CZ-Kolin iNi<br />
STOP.SHOP. Kolin<br />
CZ-Olomouc<br />
Hana Centrum<br />
CZ-Olomouc<br />
Olympia Centre<br />
<strong>Report</strong> by the Executive Board 65<br />
Highlights <strong>2006</strong>/<strong>07</strong><br />
Business Model and Strategy<br />
Portfolio Structure<br />
Corporate Governance and Outlook<br />
Property Portfolio<br />
Development of Business<br />
Consolidated Financial Statements<br />
Service and Glossary<br />
CZ-Ostrava<br />
Futurum Centrum<br />
CZ-Pardubice iNi<br />
Grand Pardubice<br />
CZ-Prague iNi<br />
Metropolitan Properties JV<br />
CZ-Prague<br />
Shopping Centre STOP.-<br />
SHOP. Uherske Hradiste<br />
CZ-Prague iNi<br />
Kilcullen Portfolio,<br />
Showroom<br />
CZ-Prague<br />
Palladium<br />
CZ-Prague<br />
Park Hostivar<br />
CZ-Prague iNi<br />
Retail Project<br />
CZ-Pribram iNi<br />
STOP.SHOP. Pribram<br />
CZ-Rakovnik iNi<br />
STOP.SHOP. Rakovnik<br />
CZ-Sokolov iNi<br />
STOP.SHOP. Sokolov<br />
CZ-Strakonice iNi<br />
STOP.SHOP.<br />
Strakonice
66 <strong>IMMOEAST</strong> <strong>Annual</strong> <strong>Report</strong> <strong>2006</strong>/<strong>07</strong><br />
CZ-Tabor iNi<br />
Shopping Centre<br />
Tabor (Roma)<br />
CZ-Trebic iNi<br />
Shopping Centre<br />
Trebic (Roma)<br />
CZ iNi<br />
TriGránit Holding Portfolio<br />
H-Bekescsaba iNi<br />
STOP.SHOP. Phase III<br />
H-Bekescsaba iNi<br />
STOP.SHOP. Phase IV<br />
H-Budapest<br />
STOP.SHOP. (3 Objects)<br />
H-Debrecen iNi<br />
STOP.SHOP. Phase III<br />
H-Érd<br />
STOP.SHOP.<br />
H-Érd iNi<br />
STOP.SHOP. Expansion<br />
H-Gödöllö iNi<br />
STOP.SHOP. Phase III<br />
H-Gyöngyös iNi<br />
STOP.SHOP. Gyöngyös<br />
Phase III<br />
H-Gyöngyös iNi<br />
STOP.SHOP. Phase IV<br />
H-Kaposvar iNi<br />
STOP.SHOP. Phase III<br />
H-Keszthely iNi<br />
STOP.SHOP. Phase III<br />
H-Mateszalka iNi<br />
STOP.SHOP. Mateszalka<br />
Phase III<br />
H-Miscolc iNi<br />
STOP.SHOP. Phase III<br />
H-Nagykanizsa iNi<br />
STOP.SHOP. Nagykanizsa<br />
Phase III<br />
H-Nyíregyháza<br />
STOP.SHOP.<br />
H-Oroshaza iNi<br />
STOP.SHOP. Oroshaza<br />
Phase III<br />
H-Salgotarjan iNi<br />
STOP.SHOP. Salgotarjan<br />
Phase III<br />
H-Tatabanya iNi<br />
STOP.SHOP. Phase IV<br />
H-Veszprém<br />
STOP.SHOP.<br />
H-Veszprém iNi<br />
STOP.SHOP. Expansion<br />
HR-Vrbani iNi<br />
Vrbani Shopping Centre<br />
PL-Kalisz iNi<br />
Shopping Centre Kalisz<br />
PL-Katowice<br />
Silesia City Center<br />
PL-Lodz iNi<br />
Diamond Business Park<br />
PL-Wloclawek<br />
Real Hypermarket<br />
RO-Brasov iNi<br />
IUS Brasov (4 Projects)<br />
RO-Cluj iNi<br />
Polus Center Cluj<br />
RO-Constanta<br />
Harbourside Constanta<br />
RO-Constanta iNi<br />
Polus Center Constanta<br />
RO-Craiova iNi<br />
Shopping Centre Craiova<br />
RO-Galati iNi<br />
Euromall Galati<br />
RO-Glina iNi<br />
Shopping Centre Glina<br />
RO-Pitesti iNi<br />
Euromall Pitesti<br />
RO-Sibiu iNi<br />
EKZ Sibiu (S+B CEE)<br />
RO-Targu Jiu iNi<br />
EYEMAXX RetailPortfolio (Shopping Centre Targu Jiu)<br />
RO-Targu Mures iNi<br />
Shopping Centre Targu Mures<br />
(S+B CEE)<br />
RO iNi<br />
EYEMAXX RetailPortfolio (25 Projects)<br />
RO iNi<br />
TriGránit Holding Portfolio<br />
(2 Projects)<br />
RUS-Moscow iNi<br />
Fifth Avenue<br />
RUS-Moscow iNi<br />
Golden Babylon I<br />
RUS-Moscow iNi<br />
Golden Babylon II<br />
RUS-Moscow iNi<br />
Hypercenter<br />
RUS-Moscow<br />
Hypercenter<br />
Investment SA I<br />
RUS-Moscow<br />
Hypercenter<br />
Investment SA II<br />
RUS-Moscow<br />
Hypercenter<br />
Investment SA III<br />
RUS-Moscow<br />
Hypercenter<br />
Investment SA IV<br />
iNi =New
RUS-Moscow iNi<br />
Rostokino<br />
SK-Bratislava<br />
Polus City Center<br />
SK-Bratislava iNi<br />
STOP.SHOP. Bratislava<br />
SK-Lucenec iNi<br />
STOP.SHOP. Lucenec<br />
SK-Nitra iNi<br />
STOP.SHOP. Nitra<br />
SK-Nove Zamky iNi<br />
STOP.SHOP.<br />
Nové Zámky<br />
SK-Poprad<br />
STOP.SHOP. Poprad<br />
SK-Presov iNi<br />
STOP.SHOP. Presov<br />
SK-Prievidza iNi<br />
Arkadia Shopping Center<br />
SK-Ruzomberok iNi<br />
STOP.SHOP. Ruzomberok<br />
SK-Trenčín iNi<br />
STOP.SHOP. Trenčín<br />
SK-Trnava iNi<br />
Arkadia Trnava Shopping<br />
Park<br />
SK-Zvolen iNi<br />
STOP.SHOP. Zvolen<br />
SLO-Kranj iNi<br />
Shopping Centre Kranj<br />
SLO-Nove Mesto iNi<br />
Shopping Centre<br />
Nove Mesto<br />
SLO iNi<br />
TriGránit Holding Portfolio<br />
LOGISTICS<br />
PROPERTIES<br />
CZ-Brno iNi<br />
Honeywell Center<br />
CZ-Brno iNi<br />
Honeywell Center<br />
Development<br />
CZ-Prague<br />
Rudna Logistics Park<br />
(16 Objects)<br />
CZ-Prague<br />
Rudna Logistics Park<br />
Phase II<br />
CZ-Prague<br />
Westpoint Distribution<br />
Park<br />
H-Budapest<br />
Camel Park<br />
H-Budapest<br />
Pharma Park<br />
H-Budapest<br />
Shark Park<br />
H-Dunaharaszti<br />
Logistics property<br />
Dunaharaszti<br />
LT-Dobrovole iNi<br />
Dobrovoles Warehouse<br />
PL-Kolonia Klepaczka<br />
Silesia Logistic Park<br />
PL-Warsaw<br />
Bokserska Distribution<br />
Park<br />
PL-Warsaw<br />
Lopuszánska Business<br />
Park<br />
PL-Warsaw iNi<br />
Platan Park<br />
<strong>Report</strong> by the Executive Board 67<br />
Highlights <strong>2006</strong>/<strong>07</strong><br />
Business Model and Strategy<br />
Portfolio Structure<br />
Corporate Governance and Outlook<br />
Property Portfolio<br />
Development of Business<br />
Consolidated Financial Statements<br />
Service and Glossary<br />
PL-Warsaw iNi<br />
Warsaw Distribution Centre<br />
PL-Warsaw<br />
Zeran Park<br />
RO-Bucharest iNi<br />
Bucharest Distribution<br />
Park (8 Projects)<br />
RO-Ploiesti iNi<br />
Almera Logistik Portfolio<br />
RO-Timis¸oara iNi<br />
Almera Logistik Portfolio<br />
RO iNi<br />
Almera Logistik Portfolio<br />
(4 Projects)<br />
RUS-Moscow iNi<br />
Sholohovo<br />
RUS-Moscow iNi<br />
Tomilino-Project<br />
RUS-St. Petersburg<br />
Warehouse Complex<br />
Shushary<br />
SK-Bratislava<br />
Senec Cargo Center<br />
(2 Objects)<br />
UA-Kiev iNi<br />
Alacor Business Park City<br />
(2 Projects)<br />
UA-Kiev iNi<br />
Alacor Logistics Park City<br />
Obukhov
68 <strong>IMMOEAST</strong> <strong>Annual</strong> <strong>Report</strong> <strong>2006</strong>/<strong>07</strong><br />
RESIDENTIAL<br />
PROPERTIES<br />
BG-Sofia<br />
Cerkovna<br />
BG-Sofia iNi<br />
Engel Joint Venture III<br />
(6 Projects)<br />
BG-St. Vlas<br />
Sunny Beach<br />
BG-Zarevo iNi<br />
Koral Bay I<br />
BG-Zarevo iNi<br />
Koral Bay II<br />
CZ-Prague<br />
Netlu<br />
CZ-Prague<br />
Novy Eden<br />
iNi =New<br />
CZ-Prague<br />
Stodulky<br />
CZ-Prague<br />
Vokovice<br />
EE-Tallinn<br />
Haabersti (Ronnamoisa<br />
tee)<br />
H-Budapest iNi<br />
Duna-Pest Condominium<br />
H-Budapest<br />
Engel Park<br />
H-Budapest<br />
Sun Palace<br />
H-Gyõr<br />
Gyõr<br />
H iNi<br />
Engel Joint Venture III<br />
HR iNi<br />
TriGránit Holding Portfolio<br />
(3 Projects)<br />
PL-Katowice iNi<br />
DeboweTarasy–Silesia<br />
City Center Residential<br />
PL-Warsaw<br />
Lesna Polana (2 Objects)<br />
PL-Wilanow iNi<br />
Engel Joint Venture III<br />
(5 Projects)<br />
PL-Wilanow<br />
Hines Residential<br />
RO-Bucharest iNi<br />
America School<br />
RO-Bucharest<br />
Baneasa (Felicity)<br />
RO-Bucharest iNi<br />
CEFIN Residential JV<br />
RO-Bucharest iNi<br />
Euromall Residential<br />
RO-Bucharest iNi<br />
Floreasca Gardens<br />
RO-Bucharest iNi<br />
Ghencea Residential<br />
Project<br />
RO-Bucharest iNi<br />
Jandarmeriei Street 5-9<br />
RO iNi<br />
Adama (22 Objects)<br />
SCG-Belgrade iNi<br />
BEWO Bregalnicka Corner<br />
SCG-Belgrade iNi<br />
Francuska<br />
SCG-Dalmatinska iNi<br />
BEWO Dalmatinska<br />
SCG-Trnska iNi<br />
BEWO Trnska<br />
SK-Bratislava iNi<br />
Century Residence<br />
UA iNi<br />
TriGránit Holding Portfolio
The Development<br />
of Business in<br />
<strong>2006</strong>/<strong>07</strong><br />
Content<br />
1. The Economic Environment 69<br />
2. The Market Environment 70<br />
3. Corporate Profile 71<br />
4. Accounting and Valuation Policies 71<br />
5. Results for the <strong>2006</strong>/<strong>07</strong> Financial Year 71<br />
5.1. Earnings Position 71<br />
5.2. Financial Position 81<br />
5.3. Asset Position 82<br />
6. Segment <strong>Report</strong>s 86<br />
6.1. Segment CEE 86<br />
6.2. Segment SEE 93<br />
6.3. Segment CIS 97<br />
1. The Economic Environment<br />
The global economy was characterised by strong growth in <strong>2006</strong>, which reinforced the positive<br />
trend set in past years. Development in Asia was generally stable, while the USA experienced a<br />
moderate slowdown and Western Europe reported an upturn. The momentum in Central and Eastern<br />
Europe has now outpaced the western economies for a number of years, with strong investment<br />
activity and rising disposable income driving growth by providing support for consumer spending.<br />
Forecasts call for a continuation of this sound performance during the coming years, even through<br />
individual countries such as Hungary or the Czech Republic may slowly approach the pace of development<br />
in the west. Russia, Ukraine, Bulgaria and Romania are expected to maintain a level of<br />
growth that exceeds the comparable figures for Western Europe. A comparison of the gross domestic<br />
product per capita confirms the enormous pent-up demand in these countries: the average for all<br />
OECD countries equalled USD 31,206, compared with USD 33,488 in the Euro zone and USD 44,187<br />
in the USA. In contrast, Poland reported per capita GDP of USD 8,882, Russia USD 9,800, Bulgaria<br />
USD 8,200 and Romania USD 7,700.<br />
Interest rates<br />
The low interest rate policy pursued up to 2004 – the key rate set by the US Federal Reserve was<br />
1.6% at that time – has since been replaced by a gradual increase in interest rate levels, with the<br />
three-month rate climbing to 5.25% by the end of <strong>2006</strong>. Although a noticeable decline is not expected<br />
during 20<strong>07</strong>, the actual results will depend on economic developments. The European Central<br />
Bank gradually raised the prime rate from 2.5% in December 2005 to 3.5% in late <strong>2006</strong> and 4.0%<br />
at the end of June 20<strong>07</strong>. In this operating environment the use of hedging instruments, the develop-<br />
<strong>Report</strong> by the Executive Board 69<br />
Highlights <strong>2006</strong>/<strong>07</strong><br />
Business Model and Strategy<br />
Portfolio Structure<br />
Corporate Governance and Outlook<br />
Property Portfolio<br />
Development of Business<br />
Consolidated Financial Statements<br />
Service and Glossary<br />
Economic upturn in Europe,<br />
slight weakness in USA<br />
Increase in interest rates
70 <strong>IMMOEAST</strong> <strong>Annual</strong> <strong>Report</strong> <strong>2006</strong>/<strong>07</strong><br />
Exchange rates rise in<br />
key submarkets<br />
GDP growth in comparison<br />
in %<br />
Expansion of business<br />
to include Ukraine, Russia,<br />
Bulgaria, Serbia, Croatia Croatia<br />
and Slovenia<br />
ment of innovative financing models and the identification of an optimal balance of equity and debt<br />
to utilise the leverage effect represent key success factors for property investors like <strong>IMMOEAST</strong>.<br />
Foreign exchange rates<br />
Of the 13 countries in which <strong>IMMOEAST</strong> invests, Poland, Hungary, the Czech Republic, Slovakia,<br />
Slovenia, Romania and Bulgaria are members of the European Union. Only Slovenia is also a member<br />
of the European Monetary Union and uses the Euro as its official currency. Slovakia is the only<br />
participant in the ERM II exchange rate system, which is a prerequisite for the introduction of the<br />
common currency and limits the fluctuations in the Slovakian Krone to a maximum of 15%. The<br />
Bulgarian Leu is tied to the Euro through a currency board. The other countries in which <strong>IMMOEAST</strong><br />
is present have their own independent national currencies which, in turn, represent the functional<br />
currencies on which the annual financial statements of <strong>IMMOEAST</strong> are based. Foreign exchange<br />
gains and losses that result from the translation of monetary assets and liabilities are recognised<br />
to the income statement in the year they occur. The currencies of Hungary, Poland, Slovakia and<br />
Romania increased in value compared with the Euro during <strong>2006</strong>/<strong>07</strong>, with the Hungarian Forint<br />
demonstrating strong volatility.<br />
6<br />
5<br />
4<br />
3<br />
2<br />
1<br />
0<br />
Austria Euro zone<br />
*) Estonia, Latvia, Lithuania, Malta, Poland, Slovakia, Slovenia, Czech Republic, Hungary, Cyprus, Bulgaria, Romania<br />
2. The Market Environment<br />
USA EU-12*)<br />
20<strong>07</strong>e<br />
The activities of <strong>IMMOEAST</strong> concentrated on Hungary, the Czech Republic, Poland, Slovakia and<br />
Romania in recent years, but this radius was extended during <strong>2006</strong>/<strong>07</strong>. In addition to Ukraine,<br />
Russia and Bulgaria, the first direct investments were made in Slovenia, Croatia and Serbia. These<br />
markets are currently in different stages of development: while the Czech Republic and Hungary<br />
have approached western levels in several sectors during recent years, the pent-up demand in<br />
South-eastern Europe, Ukraine and Russia remains enormous. <strong>IMMOEAST</strong> is able to profit from<br />
these varying stages of maturity with an optimal diversification of risk as well as a high degree of<br />
flexibility in determining the focal points of investments. Each of these markets has its own unique<br />
characteristics, which are also examined in the following analysis of the development of business<br />
during the <strong>2006</strong>/<strong>07</strong> financial year.<br />
<strong>2006</strong><br />
2005
3. Corporate Profile<br />
<strong>IMMOEAST</strong> is one of the largest and most successful property investors in Central and Eastern Europe.<br />
The company is a leading player in this region with a property portfolio that currently includes 213<br />
directly owned properties as well as 172 objects held through various investment vehicles that cannot<br />
or may not be consolidated, for a proportional share of letable space totalling 4,891,316 sqm.<br />
The <strong>IMMOEAST</strong> portfolio is diversified through two different types of segments: the segmentation<br />
based on region comprises the CEE segment (Hungary, Czech Republic, Poland and Slovakia), SEE<br />
segment (Romania, Bulgaria, Serbia, Croatia and Slovenia) and CIS (Russia and Ukraine) segment,<br />
while the segmentation based on sector reflects the various uses or types of properties such as<br />
offices, logistics facilities, commercial and residential objects. <strong>IMMOEAST</strong> does not manage car<br />
parks and parking spaces as a separate area of business because the revenues generated from<br />
these activities are generally related to the rental of offices or logistics properties. However, parking<br />
is classified as a secondary segment of business due to its financial importance.<br />
In addition to operational diversification, <strong>IMMOEAST</strong> also holds financial investments that support<br />
a broader distribution of risk and provide access to attractive projects. These investments in<br />
other companies represent property holdings in Russia, Bulgaria and Serbia as well as the countries<br />
listed above as primary segments.<br />
<strong>IMMOEAST</strong> receives operational support from Constantia Privatbank AG through a management<br />
contract that was concluded between the two companies.<br />
4. Accounting and Valuation Policies<br />
The introduction of new accounting standards and a change in the accounting methods selected<br />
from available options have had a significant influence on the results reported by <strong>IMMOEAST</strong> and<br />
limit comparability with previous annual financial statements. Information on the accounting and<br />
valuation methods used by <strong>IMMOEAST</strong> is provided on page 172f of the notes.<br />
5. Results for the <strong>2006</strong>/<strong>07</strong> Financial Year<br />
5.1 Earnings position<br />
The following table shows summarised data from the <strong>IMMOEAST</strong> income statements for the <strong>2006</strong>/<strong>07</strong><br />
and 2005/06 financial years according to the fair value model defined in IAS 40.33:<br />
Income Statement – Summary<br />
All amounts in TEUR <strong>2006</strong>/<strong>07</strong> 2005/06 Change in %<br />
Revenues 192,920.4 80,014.5 141.1%<br />
Operating profit (EBIT) 541,288.7 156,269.4 246.4%<br />
Financial results 104,163.5 26,676.3 290.5%<br />
Earnings before tax (EBT) 645,452.2 182,945.7 252.8%<br />
Net profit for the period 536,183.1 145,291.4 269.0%<br />
Earnings per share in EUR 1.02 0.76 34.8%<br />
The full income statement can be found on page 103.<br />
Economy and Branch<br />
Corporate Profile<br />
Results for <strong>2006</strong>/<strong>07</strong><br />
<strong>Report</strong> by the Executive Board 71<br />
Highlights <strong>2006</strong>/<strong>07</strong><br />
Business Model and Strategy<br />
Portfolio Structure<br />
Corporate Governance and Outlook<br />
Property Portfolio<br />
Development of Business<br />
Consolidated Financial Statements<br />
Service and Glossary<br />
Regional and sector<br />
segmentation
72 <strong>IMMOEAST</strong> <strong>Annual</strong> <strong>Report</strong> <strong>2006</strong>/<strong>07</strong><br />
Rental income and revenues by primary segment<br />
Rental Income Revenues<br />
All amounts in TEUR <strong>2006</strong>/<strong>07</strong> 2005/06 Change in % <strong>2006</strong>/<strong>07</strong> 2005/06 Change in %<br />
Hungary 23,775.2 15,399.4 8,375.8 54.4% 32,568.4 21,029.1 11,539.3 54.9%<br />
Czech Republic 31,096.0 16,863.8 14,232.2 84.4% 40,153.4 22,703.6 17,449.8 76.9%<br />
Poland 32,443.0 10,109.3 22,333.7 220.9% 45,845.3 14,692.3 31,153.0 212.0%<br />
Slovakia 14,566.7 5,254.0 9,312.7 177.3% 23,633.9 7,466.2 16,167.7 216.5%<br />
Segment CEE 101,881.0 47,626.6 54,254.4 113.9% 142,201.0 65,891.1 76,309.8 115.8%<br />
Romania 19,128.2 11,697.1 7,431.1 63.5% 22,806.3 14,115.6 8,690.7 61.6%<br />
Bulgaria 482.5 0.0 482.5 - 482.5 0.0 482.5 -<br />
Croatia 1,551.6 0.0 1,551.6 - 1,589.7 0.0 1,589.7 -<br />
Serbia 1.2 0.0 1.2 - 1.2 0.0 1.2 -<br />
Slovenia 961.8 0.0 961.8 - 1,113.1 0.0 1,113.1 -<br />
Segment SEE 22,125.4 11,697.1 10,428.3 89.2% 25,992.9 14,115.6 11,877.3 84.1%<br />
Russia 22,145.0 0.0 22,145.0 - 24,726.6 0.0 24,726.6 -<br />
Ukraine 0.0 0.0 0.0 - 0.0 -<br />
Segment CIS 22,145.0 0.0 22,145.0 - 24,726.6 0.0 24,726.6 -<br />
-<br />
Consolidation 0.1 0.0 0.1 - 0.1 -7.8 7.9 -101.1%<br />
Total 146,151.2 59,323.7 86,827.5 146.4% 192,920.4 80,014.5 112,905.8 141.1%<br />
Highest revenue growth<br />
in CEE segment<br />
Revenues rose by TEUR 112,905.9 (141%) to TEUR 192,920.4 and rental income increased by<br />
TEUR 86,827.5 (146%) to TEUR 146,151.2 during the <strong>2006</strong>/<strong>07</strong> financial year. Properties acquired<br />
during the financial year were responsible for TEUR 44,955.4 or approx. 40% of the growth in<br />
revenues.<br />
The CEE segment – which comprises Hungary, the Czech Republic, Poland and Slovakia – generated<br />
the largest share of revenues in <strong>2006</strong>/<strong>07</strong>. Rental income in this segment rose by TEUR 54,254.4<br />
or 114% over the previous reporting year. Within the CEE segment, Poland recorded the highest<br />
relative growth in rental income with a plus of 221%. This development was supported by major<br />
acquisitions such as the Mokotow Business Park and Brama Zachodnia as well as the purchase of<br />
the remaining 43.4% stake in IMAK CEE. The second largest country market in the CEE segment is<br />
the Czech Republic, which recorded rental income of TEUR 31,096.0 in <strong>2006</strong>/<strong>07</strong> for an impressive<br />
increase of TEUR 16,863.8 or 84% over the 2005/06 financial year. The growth in this segment<br />
resulted above all from new acquisitions such as the three BB Centrum office buildings, the Diamond<br />
Point and the Lordship portfolio with properties in Brno and Prague. The subsegment Hungary<br />
also reported a substantial increase of 54% or TEUR 8,375.8 in rental income, which was related<br />
primarily to new acquisitions like the Central Business Center and the purchase of the remaining<br />
shares in IMAK CEE. The subsegment Slovakia reported a relative improvement of 177% or TEUR<br />
9,312.7 in rental income. It should be noted that the prior year figures reflect only four months of<br />
rental income from this region, while the <strong>2006</strong>/<strong>07</strong> data cover a full period.
Russia 15.2%<br />
Bulgaria 0.3%<br />
Slovenia 0.7%<br />
Croatia 1.1%<br />
Romania 13.1%<br />
Slovakia 10.0%<br />
SEE<br />
CIS<br />
CEE<br />
The CIS segment is responsible for the second largest contribution to Group rental income. Approximately<br />
15% of the total rental income reported by <strong>IMMOEAST</strong> in <strong>2006</strong>/<strong>07</strong>, or TEUR 22,145.0, was<br />
earned in Russia. The strong growth in this segment was driven by three acquisitions in Moscow:<br />
the Golden Babylon I and II properties and the 5th Avenue shopping mall.<br />
The SEE segment with Romania, Bulgaria, Croatia, Serbia and Slovenia reported an increase of<br />
89% in rental income during <strong>2006</strong>/<strong>07</strong>. The major part of this income was recorded in Romania with<br />
TEUR 19,128.2. In addition, the first rental income in Croatia and Slovenia was registered during<br />
<strong>2006</strong>/<strong>07</strong>.<br />
Structure of rental income by secondary segment<br />
22.2% Poland<br />
21.3% Czech Republic<br />
16.3% Hungary<br />
Results for <strong>2006</strong>/<strong>07</strong><br />
All amounts in TEUR <strong>2006</strong>/<strong>07</strong> 2005/06 Change in %<br />
Offices 74,054.4 35,122.1 38,932.3 110.8%<br />
Logistics/commercial 68,544.1 22,765.3 45,778.8 201.1%<br />
Residential 55.4 55.2 0.2 0.4%<br />
Parking 3,497.3 1,381.0 2,116.3 153.2%<br />
Rental income 146,151.2 59,323.7 86,827.5 146.4%<br />
Sale of inventories 818.2 277.0 541.2 195.3%<br />
Operating costs 40,830.1 18,596.5 22,233.6 119.6%<br />
Other revenues 5,120.9 1,817.4 3,303.5 181.8%<br />
Revenues 192,920.4 80,014.5 112,905.8 141.1%<br />
An analysis of rental income by secondary segment shows a noticeable shift between the individual<br />
sectors during the reporting year. While 59% of Group rental income was recorded in the office<br />
sector during 2005/06, this figure declined to 50.7% in <strong>2006</strong>/<strong>07</strong>. In contrast, the share of rental<br />
income generated by logistics and commercial space rose to 47%. This development reflects the<br />
<strong>IMMOEAST</strong> strategy, which calls for the acquisition of large shopping centres in major cities and<br />
important secondary municipalities as well as the continued expansion of the Group’s STOP.SHOP.<br />
brand with its smaller retail facilities in the CEE and SEE regions. This sector registered growth of<br />
201% to TEUR 68,544.1, while the increase in rental income from office space rose by a less-thanaverage<br />
111% to TEUR 74,054.4 of the Group total.<br />
<strong>Report</strong> by the Executive Board 73<br />
Highlights <strong>2006</strong>/<strong>07</strong><br />
Business Model and Strategy<br />
Portfolio Structure<br />
Corporate Governance and Outlook<br />
Property Portfolio<br />
Development of Business<br />
Consolidated Financial Statements<br />
Service and Glossary<br />
Structure of rental income<br />
<strong>2006</strong>/<strong>07</strong> by primary segment<br />
in %<br />
15% of rental income<br />
generated in Russia<br />
Growing importance<br />
of SEE segment<br />
Higher rental income<br />
in all segments
74 <strong>IMMOEAST</strong> <strong>Annual</strong> <strong>Report</strong> <strong>2006</strong>/<strong>07</strong><br />
Structure of rental income<br />
by secondary segment<br />
in TEUR<br />
Three primary segments with<br />
different sector structures<br />
160,000<br />
120,000<br />
80,000<br />
40,000<br />
0<br />
2004/05 2005/06 <strong>2006</strong>/<strong>07</strong><br />
Rental income and revenues by primary and secondary segment<br />
Parking<br />
Residential<br />
Logistics/commercial<br />
C E E S E E C I S<br />
All amounts in TEUR <strong>2006</strong>/<strong>07</strong> 2005/06 Change in % <strong>2006</strong>/<strong>07</strong> 2005/06 Change in % <strong>2006</strong>/<strong>07</strong> 2005/06<br />
Offices 52,963.9 23,425.0 126.1% 21,090.5 11,697.1 80.3% 0.0 0.0<br />
Logistics/commercial 45,464.8 20,382.9 123.1% 961.8 0.0 - 22,117.5 0.0<br />
Retail 0.0 2,382.4 -100.0% 0.0 0.0 - 0.0 0.0<br />
Residential 55.4 55.2 0.4% 0.0 0.0 - 0.0 0.0<br />
Parking 3,396.8 1,381.0 146.0% 73.0 0.0 - 27.5 0.0<br />
Rental income 101,881.0 47,626.6 113.9% 22,125.4 11,697.1 89.2% 22,145.0 0.0<br />
Sale of inventories 818.2 276.7 195.7% 0.0 0.3 -100.0% 0.0 0.0<br />
Operating costs charged on 37,373.6 16,178.3 131.0% 3,839.3 2,418.2 58.8% 1,820.8 0.0<br />
Other 2,128.2 1,809.5 17.6% 28.2 0.0 - 760.8 0.0<br />
Revenues 142,201.0 65,891.1 115.8% 25,992.9 14,115.6 84.1% 24,726.6 0.0<br />
Offices<br />
(continued) Transition <strong>IMMOEAST</strong> Group<br />
All amounts in TEUR <strong>2006</strong>/<strong>07</strong> 2005/06 <strong>2006</strong>/<strong>07</strong> 2005/06<br />
Offices 0.0 0.0 74,054.4 35,122.1<br />
Logistics/commercial 0.0 0.0 68,544.2 20,382.9<br />
Retail 0.0 0.0 0.0 2,382.4<br />
Residential 0.0 0.0 55.4 55.2<br />
Parking 0.0 0.0 3,497.3 1,381.0<br />
Rental income 0.0 0.0 146,151.3 59,323.7<br />
Sale of inventories 0.0 0.0 818.2 277.0<br />
Operating costs charged on 0.0 0.0 43,033.7 18,596.5<br />
Other 0.0 7.8 2,917.2 1,817.4<br />
Revenues 0.0 7.8 192,920.4 80,014.5<br />
The CEE segment reported rental income of TEUR 52,963.9 for <strong>2006</strong>/<strong>07</strong>, which equals 36% of rental<br />
income recorded by the Group. The largest share of rental income from office space as well as the<br />
largest share of commercial space with rental income of TEUR 45,464.8 (31% of Group rental income)<br />
was recorded by this segment. This is a direct result of the many years of investment activity in the<br />
region. The second oldest segment – SEE and here, above all, Romania – is currently responsible for<br />
15% of total rental income. In this segment 95% of rental income is registered in the office sector,<br />
but the development of retail projects will change the weighting in the SEE segment, presumably by<br />
mid-2009. In the CIS region, <strong>IMMOEAST</strong> investments were limited to retail objects in Moscow during
<strong>2006</strong>/<strong>07</strong>. However, the extensive investment programme planned for the coming years is expected<br />
to lead to a more equal distribution of rental income over a number of sectors.<br />
Revaluation results<br />
Revaluation results include all increases and decreases in the value of investment properties as well<br />
as any impairment charges to development projects. In comparison to the previous year, revaluation<br />
results rose by 322% to TEUR 493,095.1. Properties acquired during the reporting year generated<br />
TEUR 297,464.9 or roughly 60% of the total amount. This significant increase was the result of two<br />
main factors: on the one hand, the yield compression in Central and Eastern Europe intensified significantly<br />
in relation to 2005/06 –Hungary was the only country to report a different development.<br />
On the other hand, <strong>IMMOEAST</strong> was able to acquire a number of interesting sites for future project<br />
development, which were revalued during <strong>2006</strong>/<strong>07</strong>. Also included here are properties that did not<br />
exceed their acquisition cost in revaluations carried out during earlier years. Revaluation results<br />
include TEUR 163,541.0 from the revaluation of property sites in <strong>2006</strong>/<strong>07</strong>, which represent 33% of<br />
total revaluation results.<br />
A strong rise in the Polish Zloty, Romanian Leu, Hungarian Forint and Slovakian Krone had a substantial<br />
negative impact on revaluation results for the year. This effect was particularly significant<br />
in Slovakia, where a 9.8% increase in the value of the Krone over the prior year level had an equal<br />
impact on revaluation results. The Hungarian Forint gained 6.4% in relation to the Euro, a development<br />
that was also reflected in revaluation results.<br />
Revaluation results by segment and as a % of property<br />
Results for <strong>2006</strong>/<strong>07</strong><br />
Revaluation results Property<br />
<strong>Report</strong> by the Executive Board 75<br />
Highlights <strong>2006</strong>/<strong>07</strong><br />
Business Model and Strategy<br />
Portfolio Structure<br />
Corporate Governance and Outlook<br />
Property Portfolio<br />
Development of Business<br />
Consolidated Financial Statements<br />
Service and Glossary<br />
Strong development in spite<br />
of foreign exchange effects<br />
All amounts in TEUR <strong>2006</strong>/<strong>07</strong> 2005/06 Change in % <strong>2006</strong>/<strong>07</strong> 2005/06 Increase in value in %<br />
Hungary 13,596.8 46,637.2 -33,040.4 -70.8% 495,474.2 361,370.9 2.82% 14.8%<br />
Czech Republic 146,145.4 13,015.1 133,130.3 1,022.9% 933,479.6 390,231.5 18.56% 3.5%<br />
Poland 60,746.9 37,890.9 22,856.0 60.3% 821,483.2 375,275.0 7.99% 11.2%<br />
Slovakia 12,257.0 -3,623.9 15,880.9 - 293,278.9 241,370.0 4.36% -1.5%<br />
Segment CEE 232,746.1 93,919.3 138,826.8 147.8% 2,543,715.9 1,368,247.4 10.<strong>07</strong>% 7.4%<br />
Romania 117,134.2 23,066.8 94,067.4 4<strong>07</strong>.8% 425,734.8 218,129.2 37.96% 11.8%<br />
Bulgaria 78,740.4 0.0 78,740.4 - 102,881.3 0.0 326.17% -<br />
Slovenia 8,818.7 0.0 8,818.7 - 31,329.2 0.0 39.18% -<br />
Segment SEE 210,901.6 23,066.8 187,834.8 814.3% 605,717.9 218,129.2 53.42% 11.8%<br />
Russia 49,447.4 0.0 49,447.4 - 352,480.7 0.0 16.32% -<br />
Segment CIS 49,447.4 0.0 49,447.4 - 352,480.7 0.0 16.32% -<br />
Total 493,095.1 116,986.1 376,109.0 321.5% 3,501,914.5 1,586,376.6 16.39% 8.0%<br />
-
76 <strong>IMMOEAST</strong> <strong>Annual</strong> <strong>Report</strong> <strong>2006</strong>/<strong>07</strong><br />
Highest increase in value<br />
in Czech Republic<br />
SEE profits from rise in value<br />
of property sites<br />
Decline in other operating<br />
income due to development<br />
of good will<br />
Deduction of deferred tax<br />
liabilities in determining<br />
book value of CGU<br />
The CEE segment recorded an impressive year-on-year increase of roughly 10% in the value of its<br />
investment properties during <strong>2006</strong>/<strong>07</strong>. In comparison with the prior year, revaluation results in this<br />
segment rose by TEUR 138,826.8 or 148%. As explained above, the value of properties in Hungary<br />
and Slovakia increased by a relatively low 2.8% and 4.4%, respectively, in relation to assets. The<br />
strongest increase, both in percent and absolute value, was recorded by the Czech Republic with<br />
18.6% or TEUR 146,145.4. This development was supported by the yield compression, which was<br />
stronger here than in the other CEE countries and also continued after the end of the <strong>2006</strong>/<strong>07</strong> financial<br />
year. Furthermore, the start of a redevelopment project in the CSOB portfolio led to an additional<br />
revaluation gain of TEUR 40,410.5. The returns that are used in the valuation of investment<br />
properties ranged between 6.5% and 5.25%. Transactions with returns below 5.0% were noted<br />
after the balance sheet date on 30 April 20<strong>07</strong>, and indicate a further potential for an increase in the<br />
value of properties in this segment during 20<strong>07</strong>/08.<br />
The SEE segment recorded an increase of 53.4% in the value of its investment properties in relation<br />
to the property portfolio. This represents a revaluation gain of TEUR 210,901.6, which includes<br />
TEUR 151,835.5 from an increase in the value of property sites. The returns used in the valuation<br />
ranged from 8.75% to 6.5%.<br />
The CIS segment recognised an interim increase in value of 16% or TEUR 49,447.4, which resulted<br />
primarily from the yield compression that has also started to take hold in Russia. The returns used<br />
in the valuation ranged between 9.5% and 9.0%.<br />
Other operating income<br />
Other operating income is comprised primarily of gains on the sale of investment properties, the<br />
reversal of negative goodwill, gains and losses on the translation of foreign currency items related<br />
to operating activities, deconsolidation income and other positions.<br />
The slight decline of 11% in other operating income from TEUR 51,334.4 in 2005/06 to TEUR 45,724.6<br />
for the reporting year is the result of a decrease in negative goodwill, which represented 86% of<br />
other operating income in the prior year but fell to 11% in <strong>2006</strong>/<strong>07</strong>. This development resulted from<br />
the use of the agreed transaction price for the recognition of properties at fair value on the acquisition<br />
date, instead of a revaluation based on expert opinions. In addition, negative goodwill from the<br />
acquisition of Salzburg Center S.A. was reversed because the returns defined in a forward purchase<br />
contract exceeded the current market value.<br />
Negative goodwill of TEUR 43,951.0 in the previous financial year resulted above all from the acquisition<br />
of Center Invest kft., the owner of the STOP.SHOP. chain in Hungary (TEUR 12,768.2), as well<br />
as the purchase of the remaining 90% of shares in Nowe Centrum sp. z o.o., the owner of the Silesia<br />
City Center (TEUR 19,726.2).<br />
Other operating income was positively influenced by foreign exchange effects of TEUR 15,411.4<br />
relating to the operating business as well as the sale of the Europe Tower, which generated a<br />
respectable gain of TEUR 14,053.1 on sale.<br />
Depreciation and amortisation<br />
This item is comprised chiefly of impairment charges to goodwill and depreciation on tangible<br />
assets. Depreciation and amortisation rose by TEUR 5,609.8 or 37% over 2005/06. In contrast to<br />
the prior year, the procedure followed in <strong>2006</strong>/<strong>07</strong> involved the deduction of deferred tax liabilities<br />
in determining the book value of a cash-generating unit (CGU) and a comparison with the fair value<br />
of the CGU. The fair value of deferred tax liabilities was set at zero in all cases because the deduc-
Results for <strong>2006</strong>/<strong>07</strong><br />
tion of these items in determining the purchase price for a property is generally not possible in the<br />
region in which <strong>IMMOEAST</strong> is active.<br />
Impairment charges of TEUR 43,244.0 to goodwill were largely the result of insufficient reserves<br />
(IAS 16) or insufficient valuation results. Any goodwill allocated to a property that was identified as<br />
impaired was also reduced through an impairment charge.<br />
Expenses related to properties<br />
Expenses related to properties consist for the most part of operating costs, valuation adjustments<br />
to receivables and other directly allocated expenses. The increase in these expenses is proportional<br />
to the growth in rental income.<br />
Other operating expenses<br />
Other operating expenses are comprised of administrative charges, consulting fees, taxes on property<br />
and legal transactions as well as commissions and advertising expenses. These expenses rose<br />
by 148% over the prior year to total TEUR 54,272.7 in <strong>2006</strong>/<strong>07</strong>. The increase resulted primarily from<br />
higher administrative fees charged by Constantia Privatbank AG based on the management contract<br />
with <strong>IMMOEAST</strong>, which rose by 189% to TEUR 50,366.4. This development was triggered by the<br />
expansion of <strong>IMMOEAST</strong> and strong growth in the property portfolio.<br />
Legal, auditing and consulting expenses rose by 38% to TEUR 8,312.4. The need for consulting<br />
services increased during the reporting year, above all as a result of rapid changes in the legal and<br />
tax environments of the countries in Eastern Europe. In addition, audit costs rose due to an increase<br />
in the number of managed companies from 154 to 300. These expenses are expected to increase<br />
further over the coming years.<br />
Taxes and duties also rose by a significant 144% to TEUR 4,666.7, primarily as a result of building<br />
taxes that are charged in certain Central and East European countries. These taxes, in turn, triggered<br />
an increase in transaction taxes because of the higher number of properties in the portfolio.<br />
In addition, the trade tax in Hungary and the capital investment tax on direct shareholder contributions<br />
in Austria contributed to the increase in this category of expenses. The many investor relations<br />
events held during the reporting year also resulted in higher advertising expenses, which rose by<br />
24% to TEUR 1,914.1.<br />
A sharp rise of TEUR 1,808.8 to TEUR 2,254.9 was recorded in the cost of expert opinions, which<br />
resulted chiefly from the initial preparation of valuations by the international property experts<br />
Colliers and DTZ. In subsequent periods, the expenses for property valuation will decline by roughly<br />
30% for objects owned by <strong>IMMOEAST</strong> during the <strong>2006</strong>/<strong>07</strong> financial year.<br />
Miscellaneous other operating expenses include TEUR 9,748.3 of exchange rate effects that were<br />
allocated to operating activities. The increase of TEUR 2,465.63 in penalties to TEUR 4,134.8 represents<br />
a provision for risk.<br />
<strong>Report</strong> by the Executive Board 77<br />
Highlights <strong>2006</strong>/<strong>07</strong><br />
Business Model and Strategy<br />
Portfolio Structure<br />
Corporate Governance and Outlook<br />
Property Portfolio<br />
Development of Business<br />
Consolidated Financial Statements<br />
Service and Glossary<br />
Expansion-related increase<br />
in administrative fees<br />
Number of managed<br />
companies rises<br />
from 154 to 300<br />
Initial valuation valuation by<br />
Colliers International<br />
International<br />
and DTZ
78 <strong>IMMOEAST</strong> <strong>Annual</strong> <strong>Report</strong> <strong>2006</strong>/<strong>07</strong><br />
246% increase in EBIT<br />
Development of earnings<br />
influenced by declining returns<br />
in Central and Eastern Europe<br />
Operating profit (EBIT)<br />
EBIT reached a new record level in <strong>2006</strong>/<strong>07</strong>, rising by 246% to TEUR 541,288.7. As in previous years,<br />
this development was strongly influenced by the development of revaluation results. In 2005/06<br />
revaluation results represented 75% or TEUR 116,986.1 of Group EBIT totalling TEUR 156,269.4,<br />
but this figure comprised 91% or TEUR 493,095.1 of Group EBIT (TEUR 541,288.6) for the reporting<br />
year. The contribution made by revenues to EBIT declined from TEUR 80,014.5 or 51% in 2005/06 to<br />
TEUR 192,920.4 or 36% in the <strong>2006</strong>/<strong>07</strong> financial year.<br />
The primary reason for this development was the yield compression, which influenced the entire<br />
Central and East European region. While prime yields averaged slightly more than 6.0% in the previous<br />
year, transactions – above all in the CEE segment – approached the 5.0%-mark and, in individual<br />
cases, fell below this level after the balance sheet date on 30 April 20<strong>07</strong>. Returns in the SEE<br />
segment fell by a more substantial margin, especially in Romania and Bulgaria. The prime yield<br />
remained near 8.0% in the previous year, but is now only slightly more than 6.0% in Romania and<br />
7.0%, in Bulgaria.<br />
This development is clearly demonstrated by the above comparison of EBIT and revaluation results<br />
by segment. The CEE segment recorded an increase of roughly 175% or TEUR 189,728.7 over<br />
the previous year, maintaining its leading position over the other two segments. The largest contributions<br />
to EBIT and revaluation results in the CEE segment were provided by the Czech Republic<br />
(TEUR 157,<strong>07</strong>1.0) and Poland (TEUR 81,234.3).<br />
Comparison of EBIT and revaluation results by primary segment<br />
EBIT Revaluation results<br />
All amounts in TEUR <strong>2006</strong>/<strong>07</strong> 2005/06 Change in % <strong>2006</strong>/<strong>07</strong> 2005/06 Share in %<br />
Hungary 36,310.6 54,550.3 -18,239.7 -33.4% 13,596.8 46,637.2 37.4% 85.5%<br />
Czech Republic 157,<strong>07</strong>1.0 19,550.8 137,520.1 703.4% 146,145.4 13,015.1 93.0% 66.6%<br />
Poland 81,234.3 56,023.5 25,210.8 45.0% 60,746.9 37,890.9 74.8% 67.6%<br />
Slovakia 23,816.7 -21,420.8 45,237.5 -211.2% 12,257.0 -3,623.9 51.5% 16.9%<br />
Segment CEE 298,432.5 108,703.8 189,728.7 174.5% 232,746.1 93,919.3 78.0% 86.4%<br />
Romania 128,009.7 31,804.7 96,205.0 302.5% 117,134.2 23,066.8 91.5% 72.5%<br />
Bulgaria 78,643.7 0.0 78,643.7 - 78,740.4 0.0 100.1% -<br />
Croatia 7,350.3 0.0 7,350.3 - 6,208.2 0.0 84.5% -<br />
Serbia -259.0 0.0 -259.0 - 0.0 0.0 0.0% -<br />
Slovenia 9,406.0 0.0 9,406.0 - 8,818.7 0.0 93.8% -<br />
Segment SEE 223,150.8 31,804.7 191,346.1 601.6% 210,901.6 23,066.8 94.5% 72.5%<br />
Russia 61,424.0 0.0 61,424.0 - 49,447.4 0.0 80.5% -<br />
Ukraine -12,230.1 0.0 -12,230.1 - 0.0 0.0 0.0% -<br />
Segment CIS 49,193.9 0.0 49,193.9 - 49,447.4 0.0 0.0% -<br />
Consolidation 29,488.6 15,760.8 -45,249.4 - 0.0 0.0 0.0% -<br />
Total 541,288.6 156,269.4 385,019.3 246.4% 493,095.1 116,986.1 91.1% 74.9%
The SEE segment generated TEUR 223,150.8 or 41% of Group EBIT in <strong>2006</strong>/<strong>07</strong>. This development<br />
was supported above all by Romania (TEUR 128,009.7) and Bulgaria (TEUR 78,740.4). Only Serbia<br />
reported negative EBIT of TEUR -259.0, which resulted from impairment charges to goodwill.<br />
The first contribution by the new CIS segment to Group EBIT totalled TEUR 49,193.9 or 9%. EBIT<br />
reported by Ukraine was negative because of an impairment charge recognised to goodwill in the<br />
Alacor Group.<br />
Cash EBIT totalled TEUR 65,383.6 for the <strong>2006</strong>/<strong>07</strong> financial year.<br />
Results for <strong>2006</strong>/<strong>07</strong><br />
Central and Eastern Europe, the oldest and largest segment of <strong>IMMOEAST</strong>, reported an above-average<br />
increase of TEUR 72,299.0 in cash EBIT.<br />
Cash EBIT and cash EBIT margin by primary segment<br />
C E E S E E C I S<br />
All amounts in TEUR <strong>2006</strong>/<strong>07</strong> <strong>2006</strong>/<strong>07</strong> <strong>2006</strong>/<strong>07</strong><br />
Operating profit (EBIT) 298,432.4 223,150.8 49,193.9<br />
Revaluation of properties -232,746.1 -210,901.6 -49,447.4<br />
Depreciation and amortisation 22,058.4 4,746.0 16,668.0<br />
Gain/loss on the sale of non-current assets -14,026.2 0.0 16.6<br />
Other non-cash income/expenses 163.7 -4,189.9 495.7<br />
Income taxes paid -1,583.1 -1,187.7 -4,149.0<br />
Cash EBIT 72,299.0 11,617.7 12,777.9<br />
Revenues 142,200.9 25,992.9 24,726.6<br />
Cash EBIT margin 50.8% 44.7% 51.7%<br />
(continued) Other and Group Eliminations <strong>IMMOEAST</strong> Group<br />
All amounts in TEUR <strong>2006</strong>/<strong>07</strong> <strong>2006</strong>/<strong>07</strong><br />
Operating profit (EBIT) -29,488.5 541,288.7<br />
Revaluation of properties 0.0 -493,095.1<br />
Depreciation and amortisation 343.9 43,816.3<br />
Gain/loss on the sale of non-current assets -0.1 -14,009.7<br />
Other non-cash income/expenses -2,132.6 -5,663.1<br />
Income taxes paid -33.7 -6,953.5<br />
Cash EBIT -31,310.9 65,383.6<br />
Revenues 0.0 192,920.4<br />
Cash EBIT margin 0.0% 33.9%<br />
<strong>Report</strong> by the Executive Board 79<br />
Highlights <strong>2006</strong>/<strong>07</strong><br />
Business Model and Strategy<br />
Portfolio Structure<br />
Corporate Governance and Outlook<br />
Property Portfolio<br />
Development of Business<br />
Consolidated Financial Statements<br />
Service and Glossary
80 <strong>IMMOEAST</strong> <strong>Annual</strong> <strong>Report</strong> <strong>2006</strong>/<strong>07</strong><br />
Improvement of 290%<br />
in financial results<br />
2% effective tax rate<br />
Financial results<br />
Financial results comprise current financing costs (interest income and interest expense) as well<br />
as profit and loss on financial investments and the proportional share of profit and loss from associated<br />
companies. The <strong>2006</strong>/<strong>07</strong> financial year brought an increase of 290% or TEUR 77,487.3 in<br />
financial results to TEUR 104,163.5. This development resulted from the strong expansion of the<br />
Group’s financing activities on behalf of partners and the parent company, which led to the first<br />
clearly positive net financing costs of TEUR 14,131.8. In addition, the investment of surplus liquid<br />
funds from the capital increase and the valuation of financial instruments generated TEUR 48,429.7<br />
in <strong>2006</strong>/<strong>07</strong> compared with TEUR 14,680.3 in the prior year. Distributions from financial instruments<br />
held by <strong>IMMOEAST</strong> totalled TEUR 5,422.2. Exchange rate gains and losses equalled TEUR 34,356.6<br />
in <strong>2006</strong>/<strong>07</strong> compared with TEUR 11,141.5 in 2005/06.<br />
Financial results by segment<br />
All amounts in TEUR <strong>2006</strong>/<strong>07</strong> 2005/06 Change in %<br />
Hungary 2,654.0 -16,591.0 19,245.0 116.0%<br />
Czech Republic -12,926.9 4,505.9 -17,432.8 -386.9%<br />
Poland -10,873.1 1,505.4 -12,378.5 -822.3%<br />
Slovakia 10,459.7 -271.5 10,731.2 -3,952.6%<br />
Segment CEE -10,686.3 -10,851.2 164.9 -1.5%<br />
Romania -6,730.9 -1,602.9 -5,128.0 319.9%<br />
Bulgaria -441.8 0.0 -441.8 -<br />
Croatia -684.3 0.0 -684.3 -<br />
Serbia -19.5 0.0 -19.5 -<br />
Slovenia -0.2 0.0 -0.2 -<br />
Segment SEE -7,876.7 -1,602.9 -6,273.8 391.4%<br />
Russia -2,350.3 0.0 -2,350.3 -<br />
Ukraine -40.5 0.0 -40.5 -<br />
Segment CIS -2,390.8 0.0 -2,390.8 -<br />
Consolidation 125,117.3 39,130.4 -85,986.9 -<br />
Total 104,163.5 26,676.3 77,487.3 290.5%<br />
The above table shows that financial results – with the exception of foreign exchange effects – are<br />
generated to a limited extent by the operating segments and realised primarily at the holding company<br />
level.<br />
Income taxes<br />
This item includes income tax expense as well as provisions for deferred taxes. Income tax expense<br />
for the group rose from TEUR -37,654.3 in the prior year to TEUR -109,269.1 for <strong>2006</strong>/<strong>07</strong>, but<br />
represents a decrease in the group tax rate from von 20.6% to 16.9%. A calculation based on<br />
TEUR -13,062.8 of income taxes actually paid for the reporting year shows a rate of 2% for the<br />
actual taxation of earned income.
5.2 Financial position<br />
Cash flow statement<br />
All amounts in TEUR <strong>2006</strong>/<strong>07</strong> 2005/06 Change in %<br />
Gross cash flow 63,361.5 24,854.1 154.9%<br />
Cash flow from operating activities -121,097.5 6,783.7 -1,885.1%<br />
Cash flow from investing activities -2,174,279.3 -799,448.5 172.0%<br />
Cash flow from financing activities 2,664,752.7 1,056,146.7 152.3%<br />
Cash and cash equivalents at the beginning of the period 317,728.7 58,811.7 440.2%<br />
Cash and cash equivalents at the end of the period 702,146.3 317,728.7 121.0%<br />
Change in cash and cash equivalents 384,417.6 258,917.0 48.5%<br />
The full consolidated cash flow statement is shown on page 105.<br />
Results for <strong>2006</strong>/<strong>07</strong><br />
Gross cash flow<br />
Gross cash flow demonstrates the strength of a company’s operational earnings. However, the<br />
strong growth of <strong>IMMOEAST</strong> in recent years has made this indicator less important than earnings<br />
data for an accurate evaluation of performance. In spite of this fact, it can be noted that gross cash<br />
flow rose by 155% over the prior year to TEUR 63,361.5 for <strong>2006</strong>/<strong>07</strong> – an above-average increase<br />
compared with the growth in revenues. Income taxes paid rose by 691% to TEUR 13,062.8 due to<br />
the sale of the Europe Tower in Budapest through an asset deal, which did not allow for the (full)<br />
elimination of tax expense.<br />
Cash flow from operating activities<br />
Cash flow from operating activities is based on gross cash flow, and includes the changes in the<br />
various components of working capital. For the reporting year, cash flow from operating activities<br />
fell significantly below gross cash flow because of a sharp rise in other receivables. This increase<br />
was related to amounts due from taxation authorities in various East European countries for input<br />
VAT as well as recently granted financing.<br />
Cash flow from investing activities<br />
Cash flow from investing activities clearly reflects the expansion strategy of <strong>IMMOEAST</strong>, with an<br />
increase of 172% from TEUR 799,448.5 in 2005/06 to TEUR 2,174,279.3 for the reporting year. The<br />
most important positions were the acquisition of property companies for TEUR 732,135.1 and the<br />
purchase of financial assets for TEUR 544,875.0, whereby the acquisition of a 25% stake in TriGránit<br />
represents a major component of this item.<br />
Cash flow from financing activities<br />
Cash flow from financing activities is comprised primarily of net proceeds of TEUR 2,658,792.3<br />
from the <strong>IMMOEAST</strong> capital increase, and also includes the increase in and repayment of financial<br />
liabilities.<br />
Financing<br />
<strong>IMMOEAST</strong> currently has an equity ratio of 73.2% and gearing of 19.7%. This standing reflects the<br />
capital increase that was carried out during the <strong>2006</strong>/<strong>07</strong> financial year.<br />
Information on the conditions of financial liabilities is provided in the notes to the financial statements<br />
on page 2<strong>07</strong>ff.<br />
<strong>Report</strong> by the Executive Board 81<br />
Highlights <strong>2006</strong>/<strong>07</strong><br />
Business Model and Strategy<br />
Portfolio Structure<br />
Corporate Governance and Outlook<br />
Property Portfolio<br />
Development of Business<br />
Consolidated Financial Statements<br />
Service and Glossary<br />
Growth higher than<br />
revenues<br />
Negative cash cash flow from<br />
operating activities activities due due to<br />
increase in receivables<br />
Intensity of expansion<br />
reflected in plus of 172%<br />
Capital increase leads to<br />
improvement in equity ratio
82 <strong>IMMOEAST</strong> <strong>Annual</strong> <strong>Report</strong> <strong>2006</strong>/<strong>07</strong><br />
Extension of balance sheet<br />
and improved risk allocation<br />
5.3 Asset position<br />
Consolidated balance sheet<br />
All amounts in TEUR <strong>2006</strong>/<strong>07</strong> 2005/06 Change in %<br />
Property 3,501,914.5 1,586,376.6 120.7%<br />
Property under construction 242,772.6 85,632.7 183.5%<br />
Other non-current assets 1,002,787.5 158,487.8 532.7%<br />
Non-current assets 4,747,474.5 1,830,497.1 159.4%<br />
Receivables and other assets 1,196,878.6 478,005.0 150.4%<br />
Property held for sale - 42,847.6 -100.0%<br />
Inventories 81,694.3 18,375.5 344.6%<br />
Securities, cash and cash equivalents 702,146.3 317,728.7 121.0%<br />
Current assets 1,980,719.2 856,956.8 131.1%<br />
ASSETS 6,728,193.7 2,687,453.9 150.4%<br />
Equity 4,923,085.8 1,661,954.3 196.2%<br />
Financial liabilities 957,489.0 614,655.6 55.8%<br />
Other non-current liabilities 528,817.1 205,365.3 157.5%<br />
Non-current liabilities 1,486,306.1 820,020.9 81.3%<br />
Current liabilities 318,801.8 205,478.7 55.2%<br />
EQUITY AND LIABILITIES 6,728,193.7 2,687,453.9 150.4%<br />
Non-current assets<br />
The development of non-current assets reflected the expansion strategy of <strong>IMMOEAST</strong> during the<br />
reporting year, rising by 159% or TEUR 2,916,977.5 to TEUR 4,747,474.6. Investments were concentrated<br />
on the acquisition of investment properties as well as development projects. In addition, the<br />
group increased its focus on the purchase of strategic investments in development companies such<br />
as TriGránit and Adama in order to improve the diversification of risk and, at the same time, secure<br />
access to new projects.<br />
Current assets<br />
Current assets rose by TEUR 1,123,762.4 in 2005/06 to TEUR 1,980,719.2 as of 30 April 20<strong>07</strong>.<br />
This growth was supported in part by liquid funds remaining from the capital increase that was<br />
carried out in <strong>2006</strong>/<strong>07</strong> as well as an increase in receivables due from the parent company to<br />
TEUR 993.142,2.<br />
Equity<br />
The above-mentioned capital increase and improvement in results for the reporting period increased<br />
equity by TEUR 3,261,131.5. The equity ratio reached 73.2% and asset coverage rose to over 96%.
Non-current liabilities<br />
Non-current liabilities rose by 81% or TEUR 666,285.2 to TEUR 1,486,306.1, primarily as a result of<br />
liabilities taken over in connection with the acquisition of companies. Deferred tax liabilities also<br />
increased by a substantial 153% to TEUR 473,099.1, above all due to the revaluation of assets as<br />
part of the initial consolidation of acquisitions or the revaluation of properties at year-end.<br />
Current liabilities<br />
Current liabilities rose by TEUR 113,323.1 to TEUR 318,801.8.<br />
Net asset value<br />
Results for <strong>2006</strong>/<strong>07</strong><br />
All amounts in TEUR <strong>2006</strong>/<strong>07</strong> 2005/06<br />
Equity before minority interests 4,9<strong>07</strong>,297.5 1,661,971.7<br />
Goodwill -180,722.4<br />
Deferred tax assets -61,089.0 -23,042.5<br />
Deferred tax liabilities<br />
Property under<br />
473,099.1 5,138,585.2 186,946.7 1,825,876.0<br />
construction (carrying value) 242,772.6 85,632.7<br />
Property under construction (fair value) 569,1<strong>07</strong>.9 326,335.3 95,387.3 9,754.6<br />
Inventories (carrying value) 81,694.3<br />
Inventories (fair value)<br />
Residual value of forward purchase contracts and<br />
151,751.6 70,057.3<br />
investments in other companies carried at cost 41,144.9<br />
Property held for sale (carrying value) 0.0 42,847.6<br />
Property held for sale (fair value) 0.0 0.0 54,125.0 11,277.4<br />
Shares in associated companies (carrying value) 372,468.8 21,574.4<br />
Shares in associated companies (fair value) 438,102.6 65,633.7 39,979.4 18,404.9<br />
Net asset value 5,641,756.5 1,865,312.9<br />
Number of shares (in 1,000) 555,882.8 222,353.1<br />
Net asset value per share (in EUR) 10.2 8.4<br />
Net asset value per share rose by 21.4% from EUR 8.4 in the prior year to EUR 10.2 in <strong>2006</strong>/<strong>07</strong>. This<br />
figure includes the valuation of all development projects, inventories and investments in other companies<br />
that are not carried at fair value. The increase was supported by two main factors: on the one<br />
hand, <strong>IMMOEAST</strong> was able to acquire numerous new development projects that carry a high potential<br />
for future earnings and, on the other hand, the yield compression on investment properties led<br />
to significant increases in value. The calculation of net asset value is based on a Best Practices<br />
Policy Recommendation (6.3) of the European Public Real Estate Association (EPRA).<br />
<strong>Report</strong> by the Executive Board 83<br />
Highlights <strong>2006</strong>/<strong>07</strong><br />
Business Model and Strategy<br />
Portfolio Structure<br />
Corporate Governance and Outlook<br />
Property Portfolio<br />
Development of Business<br />
Consolidated Financial Statements<br />
Service and Glossary<br />
Net asset value rises by 21.4%<br />
to EUR 10.2 per share
84 <strong>IMMOEAST</strong> <strong>Annual</strong> <strong>Report</strong> <strong>2006</strong>/<strong>07</strong><br />
Initial calculation<br />
of NNNAV<br />
Triple Net Asset Value<br />
All amounts in TEUR 30 April 20<strong>07</strong><br />
Net asset value (NAV) 5,641,756.5 5,641,756.5<br />
Deferred taxes (fair value) -8,554.0 -8,554.0<br />
Triple net asset value (NNNAV) 5,633,202.4<br />
Number of shares (in 1,000) 555,882.8<br />
Triple net asset value per share (in EUR) 10.1<br />
Since <strong>IMMOEAST</strong> now has inventories that will inevitably result in tax effects when they are sold<br />
– even after the utilisation of opportunities for the reduction of taxes – triple net asset value was<br />
calculated for the first time. This calculation is based on the assumption that the full gain on sale<br />
will be taxed at the current tax rate.<br />
Net operating income<br />
Net operating income on an annual basis – derived from let investment properties – is as follows:<br />
All amounts in TEUR<br />
Country Fair value NOI (a) Return<br />
Czech Republic 837,993.2 49,874.8 6.0%<br />
Slovakia 293,278.9 17,197.9 5.9%<br />
Hungary 495,474.2 30,400.9 6.1%<br />
Poland 802,255.8 47,858.7 6.0%<br />
Total CEE 2,429,002.1 145,332.2 6.0%<br />
Slovenia 31,329.2 1,973.7 6.3%<br />
Croatia 45,772.5 2,998.1 6.6%<br />
Romania 318,475.4 20,567.8 6.5%<br />
Total SEE 395,577.1 25,539.6 6.5%<br />
Russia 352,480.7 31,240.8 8.9%<br />
Total CIS 352,480.7 31,240.8 8.9%<br />
Total 3,177,059.9 202,112.6 6.4%<br />
Net operating income is defined as net rental income for the year after the deduction of rental costs<br />
that cannot be charged to other parties. The returns in the above table represent the weighted<br />
average discount rate used for the valuation of properties.
The expected net operating income from development projects (excluding inventories) is shown below:<br />
Development projects, excluding inventories<br />
All amounts in TEUR<br />
Country Construction costs NOI (e) Development yield Fair value yield<br />
Czech Republic 297,1<strong>07</strong>.73 31,555.38 10.6% 6.1%<br />
Hungary 537,359.44 49,218.76 9.2% 7.2%<br />
Poland 229,011.44 20,830.06 9.1% 7.4%<br />
Slovakia 289,958.12 33,190.26 11.4% 11.2%<br />
Total CEE 1,353,436.74 134,794.46 10.0% 7.9%<br />
Romania 1,054,350.56 105,310.33 10.0% 8.1%<br />
Bulgaria 162,718.93 28,823.52 17.7% 10.9%<br />
Total SEE 1,217,069.50 134,133.85 11.0% 8.7%<br />
Russia 619,292.52 58,832.79 9.5% 9.5%<br />
Ukraine 58,173.05 5,090.14 8.8% 8.8%<br />
Total CIS 677,465.57 63,922.93 9.4% 9.4%<br />
Total 3,247,971.80 332,851.24 10.2% 8.5%<br />
The fair value yield shows the returns on the valuation of properties as of the balance sheet date,<br />
while the development yield is calculated by dividing NOI (e) by construction costs.<br />
Transition to the property portfolio<br />
The property portfolio of the <strong>IMMOEAST</strong> Group totalled approximately EUR 9 billion as of the balance<br />
sheet date on 30 April 20<strong>07</strong>. This value is comprised of the following:<br />
Property portfolio as of 30 April 20<strong>07</strong><br />
All amounts in EUR million<br />
Investment properties 3,501.91<br />
Construction costs for redevelopment/land 613.78<br />
4,115.69<br />
Properties under construction 242.77<br />
Reserves 326.34<br />
Outstanding construction costs 1,803.02<br />
2,372.13<br />
Inventories 81.68<br />
Reserves 70.06<br />
Outstanding construction costs 259.48<br />
411.22<br />
Construction costs for forward purchases 588.40<br />
Reserves for forward purchases<br />
Properties held through investments in other<br />
41.14<br />
companies and commitments 1,490.57<br />
2,120.12<br />
Total 9,019.16<br />
Results for <strong>2006</strong>/<strong>07</strong><br />
<strong>Report</strong> by the Executive Board 85<br />
Highlights <strong>2006</strong>/<strong>07</strong><br />
Business Model and Strategy<br />
Portfolio Structure<br />
Corporate Governance and Outlook<br />
Property Portfolio<br />
Development of Business<br />
Consolidated Financial Statements<br />
Service and Glossary
86 <strong>IMMOEAST</strong> <strong>Annual</strong> <strong>Report</strong> <strong>2006</strong>/<strong>07</strong><br />
Hungary, Poland,<br />
Czech Republic, Slovakia<br />
6. Segment <strong>Report</strong>s<br />
6.1 Segment CEE<br />
Overview of properties in the CEE segment<br />
<strong>2006</strong>/<strong>07</strong> 2005/06 Change in %<br />
Residential properties<br />
Number of objects 20 11 81.8%<br />
Letable space in sqm<br />
Retail properties<br />
826,860 481,999 71.5%<br />
Number of objects 61 16 281.3%<br />
Letable space in sqm<br />
Office properties<br />
1,0<strong>07</strong>,796 549,954 83.3%<br />
Number of objects 115 49 134.7%<br />
Letable space in sqm<br />
Recreation/hotel properties<br />
3,672,184 979,895 274.8%<br />
Number of objects 1 0 -<br />
Letable space in sqm<br />
Logistics properties<br />
46,900 0 -<br />
Number of objects 33 13 153.8%<br />
Letable space in sqm 552,273 448,531 23.1%<br />
Total number of objects 230 89 158.4%<br />
Letable space in sqm<br />
Proportional share of letable<br />
6,106,013 2,460,379 148.2%<br />
space in sqm 2,552,824 1,187,565 115.0%<br />
6.1.1. The market environment in CEE<br />
The CEE segment comprises the Central and East European states of Hungary, the Czech Republic,<br />
Poland and Slovakia. These four countries, which joined the European Union in 2004, formed the<br />
first investment targets for <strong>IMMOEAST</strong>. Their economic development has approached West European<br />
levels in recent years, even through the pace of growth exceeded the west in <strong>2006</strong>: while the<br />
EU-25 recorded an average increase of 2.9% in GDP for <strong>2006</strong>, the comparable value was 8.3% for<br />
Slovakia and 3.9% for Hungary. A further adjustment in growth rates is forecasted for the coming<br />
years, above all in Hungary.
6.1.2. Development of business in CEE<br />
Key data on the CEE Segment<br />
<strong>2006</strong>/<strong>07</strong> 2005/06 Change in %<br />
Revenues in TEUR 142,201.0 65,891.1 115.8%<br />
EBIT in TEUR 298,432.5 87,674.8 240.4%<br />
Cash EBIT in TEUR 72,299.0 24,184.0 199.0%<br />
Segment assets in TEUR 2,960,800.9 1,642,033.4 80.3%<br />
Segment liabilities in TEUR 1,810,058.0 1,102,442.9 64.2%<br />
Letable space as a % of the total portfolio 52.2% 84.1% -38.0%<br />
Fair value in EUR million 4,311.7 1,662.6 159.3%<br />
Fair value as a % of the total portfolio 47.8% 86.1% -44.5%<br />
The CEE segment generated an increase of nearly 116% in revenues to TEUR 142,201.0 in <strong>2006</strong>/<strong>07</strong>,<br />
which represents 74% of the total revenues recorded by <strong>IMMOEAST</strong>. Investments in this segment<br />
focus primarily on office properties as well as logistics and commercial objects. EBIT rose by more<br />
than 240% to TEUR 298,432.5 during the reporting year, supported by a further increase in revaluation<br />
results. This development was based primarily on Poland and the Czech Republic. The CEE<br />
segment is responsible for 55% of EBIT in the <strong>IMMOEAST</strong> Group. An increase of nearly 200% in cash<br />
EBIT led to an improvement in the cash EBIT margin from 33.1% to 50.8% during <strong>2006</strong>/<strong>07</strong>.<br />
Recreation/hotel properties 1.4%<br />
Residential properties 5.9%<br />
Parking 10.7%<br />
Logistics properties 12.8%<br />
Retail properties 26.9%<br />
42.3% Office properties<br />
Segment <strong>Report</strong>s<br />
<strong>Report</strong> by the Executive Board 87<br />
Highlights <strong>2006</strong>/<strong>07</strong><br />
Business Model and Strategy<br />
Portfolio Structure<br />
Corporate Governance and Outlook<br />
Property Portfolio<br />
Development of Business<br />
Consolidated Financial Statements<br />
Service and Glossary<br />
74% of revenues from CEE<br />
Distribution of letable space<br />
by sector in CEE<br />
As of 30.4.20<strong>07</strong>
88 <strong>IMMOEAST</strong> <strong>Annual</strong> <strong>Report</strong> <strong>2006</strong>/<strong>07</strong><br />
Developed market at<br />
West European level<br />
Second strongest subsegment<br />
with nearly 700%<br />
increase in revenues<br />
6.1.3. Czech Republic<br />
Country information<br />
Population in mill.<br />
<strong>2006</strong><br />
10.3<br />
Real GDP increase in % 6.1<br />
GDP per capita in EUR 11,010.0<br />
Inflation in % 2.5<br />
Source: Eurostat<br />
The property market in the Czech Republic<br />
In recent years, certain sectors of the Czech property market have reached levels that are comparable<br />
with Western Europe. The office market – which is concentrated primarily in the capital city<br />
of Prague and comprises roughly 2 million sqm – was characterised by an excess supply of new<br />
space up to 2005. However, a change in market conditions during <strong>2006</strong> led to a mismatch with<br />
new space of 160,000 sqm facing demand of 190,000 sqm. The result was a decline in vacancies<br />
to nearly 10%.<br />
The residential market in the Czech Republic covers approximately 4.5 million units, with more than<br />
12% located in the capital city. Roughly half the units are owner-occupied and 30% represent rental<br />
apartments, while the remainder are owned through cooperative housing societies. The steady rise<br />
in disposable income has triggered a parallel increase in the share of single households and the<br />
demand for high-quality housing. Consumer spending has also grown, providing added benefits for<br />
the retail sector. In addition to Prague, numerous shopping malls have developed in the secondary<br />
population centres. The general acceleration of economic momentum and increasing global business<br />
connections have also led to an increase in the exchange of goods, which has created additional<br />
demand for logistics space.<br />
The development of business in the Czech Republic<br />
With revenues of TEUR 40,153.4, the Czech Republic represents the second largest subsegment<br />
of <strong>IMMOEAST</strong>. The increase of 76.9% in revenues over the prior year resulted from acquisitions in<br />
Prague and Brno. EBIT rose by more than 700% year-on-year, clearly exceeding the overall development<br />
of <strong>IMMOEAST</strong>, and is related to the above-average development of revaluation results.<br />
Key data on the Czech Republic<br />
<strong>2006</strong>/<strong>07</strong> 2005/06 Change in %<br />
Revenues in TEUR 40,153.4 22,703.6 76.9%<br />
EBIT in TEUR 157,<strong>07</strong>1.0 19,550.8 703.4%<br />
Letable space as a % of the total portfolio 14.1% 27.0% -47.8%<br />
Fair value in EUR million 1,303.4 470.5 177.0%<br />
Fair value as a % of the total portfolio 14.5% 24.4% -40.6%
Recreation/hotel properties 1.5%<br />
Residential properties 1.6%<br />
Logistics properties 14.4%<br />
Parking 18.9%<br />
6.1.4. Hungary<br />
Country information<br />
Population in mill.<br />
<strong>2006</strong><br />
10.1<br />
Real GDP increase in % 3.9<br />
GDP per capita in EUR 8,850.0<br />
I n f l a t i o n i n % 6 . 6<br />
40.3% Office properties<br />
23.3% Retail properties<br />
Source: Eurostat<br />
Segment <strong>Report</strong>s<br />
The property market in Hungary<br />
The office market in Hungary has roughly 1.8 million sqm of space and a vacancy rate of 14%, which<br />
is concentrated in older buildings that have not been renovated. The demand for new high-quality<br />
space has remained consistently high since the country’s accession to the EU in 2004. New rentals<br />
have risen from 140,000 sqm in 2003 to a current level of 230,000 sqm per year. The supply of new<br />
space has lagged behind this development to date, but the production of new space and demand<br />
are expected to equalise in 20<strong>07</strong>.<br />
The Hungarian residential market is concentrated in Budapest, where roughly 850,000 units are<br />
registered as primary residences. A process to privatise state-owned apartments was started during<br />
the early 1990s after the political transformation, and the share of owner-occupied apartments<br />
has reached nearly 90%. As a result, the momentum on the rental market is correspondingly low.<br />
The rising level of incomes has led to the development of new retail space, not only in Budapest but<br />
also in the prospering provincial cities. The logistics market has shown steady development with<br />
roughly 1 million sqm, which are concentrated on the autobahn ring surrounding Budapest and have<br />
a vacancy rate of almost 9%.<br />
The development of business in Hungary<br />
Revenues recorded by the Hungary subsegment rose by roughly 55% to TEUR 32,568.4 as a result<br />
of new acquisitions and the purchase of the remaining shares in IMAK CEE. Revaluation results<br />
were influenced by the increasing strength of the Forint in comparison with the Euro, which held the<br />
improvement in EBIT below the growth in revenues at 8.3%.<br />
<strong>Report</strong> by the Executive Board 89<br />
Highlights <strong>2006</strong>/<strong>07</strong><br />
Business Model and Strategy<br />
Portfolio Structure<br />
Corporate Governance and Outlook<br />
Property Portfolio<br />
Development of Business<br />
Consolidated Financial Statements<br />
Service and Glossary<br />
Distribution of letable space by<br />
sector in the Czech Republic<br />
As of 30.4.20<strong>07</strong><br />
Office and residential<br />
market focus on Budapest,<br />
retail also in in provincial cities<br />
Revenues increase 55%,<br />
EBIT influenced by<br />
foreign exchange factors
90 <strong>IMMOEAST</strong> <strong>Annual</strong> <strong>Report</strong> <strong>2006</strong>/<strong>07</strong><br />
Distribution of letable space<br />
by sector in Hungary<br />
As of 30.4.20<strong>07</strong><br />
Strong office and<br />
retail markets<br />
Key data on Hungary<br />
<strong>2006</strong>/<strong>07</strong> 2005/06 Change in %<br />
Revenues in TEUR 32,568.4 21,029.1 54.9%<br />
EBIT in TEUR 36,310.6 33,521.3 8.3%<br />
Letable space as a % of the total portfolio 14.7% 25.7% 42.8%<br />
Fair value in EUR million 1,214.0 461.6 163.0%<br />
Fair value as a % of the total portfolio 13.5% 23.9% -43.5%<br />
Recreation/hotel properties 3.3%<br />
Residential properties 4.6%<br />
Parking 4.8%<br />
Retail properties 18.6%<br />
Logistics properties 22.8%<br />
6.1.5. Poland<br />
Country information<br />
Population in mill.<br />
<strong>2006</strong><br />
38.2<br />
Real GDP increase in % 6.1<br />
GDP per capita in EUR 7,120.0<br />
I n f l a t i o n i n % 1 . 4<br />
46.0% Office properties<br />
Source: Eurostat<br />
The property market in Poland<br />
In spite of the economic recovery in selected major cities, the office market in Poland is still concentrated<br />
in the capital city of Warsaw. The office market in this city has a volume of roughly 2.6<br />
million sqm and is characterised by a significant demand overhang– in 20<strong>07</strong> the planned 280,000<br />
sqm of new space will be contrasted with forecasted demand of roughly 400,000 sqm. The vacancy<br />
rate has fallen to a recent level of 7%. This situation will lead to an increase in rents, and also bring<br />
about an adjustment of returns to West European levels.<br />
Following the privatisation of former state-owned buildings, approximately two-thirds of the Polish<br />
residential market with its roughly 13 million units is now in private ownership. Forecasts show a<br />
steady increase in demand in this sector due to the rising level of income and relatively large households<br />
with a statistical average of 3 persons. The retail trade has also profited from the development<br />
of incomes and is attracting international sellers – numerous shopping malls in the capital<br />
city and smaller population centres have been constructed to meet the higher demand for space.<br />
The strong growth of the economy has also had a favourable impact on the logistics market, which<br />
remains stable with roughly 3 million sqm of space.
The development of business in Poland<br />
Poland recorded the highest revenues of all subsegments in the <strong>IMMOEAST</strong> Group with an increase<br />
of 212% to TEUR 45,845.3 in <strong>2006</strong>/<strong>07</strong>. This development was supported by major acquisitions such<br />
as the Mokotow Business Park and Brama Zachodnia as well as the purchase of the remaining<br />
shares in IMAK CEE. EBIT rose by 45% to TEUR 81,234.3, whereby TEUR 60,746.9 of this total consists<br />
of revaluation results.<br />
Key data on Poland<br />
<strong>2006</strong>/<strong>07</strong> 2005/06 Change in %<br />
Revenues in TEUR 45,845.3 14,692.3 212.0%<br />
EBIT in TEUR 81,234.3 56,023.5 45.0%<br />
Letable space as a % of the total portfolio 16.3% 18.4% -11.4%<br />
Fair value in EUR million 1,119.7 444.6 151.8%<br />
Fair value as a % of the total portfolio 12.4% 23.0% 46.1%<br />
Recreation/hotel properties 0.2%<br />
Logistics properties 7.7%<br />
Parking 8.7%<br />
Residential properties 10.9%<br />
Retail properties 32.7%<br />
6.1.6. Slovakia<br />
Country information<br />
Population in mill.<br />
<strong>2006</strong><br />
5.4<br />
Real GDP increase in % 8.3<br />
GDP per capita in EUR 8,150.0<br />
Inflation in % 3.7<br />
39.8% Office properties<br />
Source: Eurostat<br />
Segment <strong>Report</strong>s<br />
The property market in Slovakia<br />
The institutional property market in Slovakia is concentrated in the capital city of Bratislava, the<br />
only city in the country with a population of more than 400,000. The office market in Bratislava has<br />
roughly 1 million sqm of space, with production reaching 80,000 sqm and new rentals 70,000 sqm<br />
in <strong>2006</strong>. A comparable situation is expected for 20<strong>07</strong>, which should hold the vacancy rate stable at<br />
a level near the current 11%. In spite of a slight increase, top rents remain below the comparable<br />
values for other capital cities in Eastern Europe at EUR 18/sqm.<br />
<strong>Report</strong> by the Executive Board 91<br />
Highlights <strong>2006</strong>/<strong>07</strong><br />
Business Model and Strategy<br />
Portfolio Structure<br />
Corporate Governance and Outlook<br />
Property Portfolio<br />
Development of Business<br />
Consolidated Financial Statements<br />
Service and Glossary<br />
Strongest subsegment with<br />
plus of 212% in revenues<br />
Distribution of letable space<br />
by sector in Poland<br />
As of 30.4.20<strong>07</strong><br />
Office prices below CEE<br />
average, opportunities in<br />
residential residential and and retail sectors
92 <strong>IMMOEAST</strong> <strong>Annual</strong> <strong>Report</strong> <strong>2006</strong>/<strong>07</strong><br />
Strong improvement in<br />
revenues and earnings<br />
Distribution of letable space<br />
by sector in Slovakia<br />
As of 30.4.20<strong>07</strong><br />
Slovakia has a population of 5.4 million and a supply of slightly more than 2 million housing units,<br />
which translates into an average household size of 2.8 persons. This situation, combined with the<br />
comparatively low average age of the Slovakian population (approx. 36 years), will lead to a significant<br />
increase in the demand for housing over the coming years. In the retail sector, development<br />
steps were initiated several years ago with a focus on Bratislava and the provincial city of Kosice.<br />
The logistics market is located primarily in the capital city as well as the industrial areas of Zilina<br />
and Kosice, and has a volume of roughly 440,000 sqm with a steadily declining vacancy rate that<br />
now equals 8%.<br />
The development of business in Slovakia<br />
The growth rates recorded in Slovakia exceed the average for the other countries in this segment<br />
because of the later market entry. Revenues recorded in Slovakia rose by 216.5% to TEUR 23,633.9<br />
for the reporting year. EBIT reached a level of TEUR 23,816.7 in <strong>2006</strong>/<strong>07</strong> after negative results in the<br />
previous year, whereby approximately one-half of the reporting year figure consists of revaluation<br />
results.<br />
Key data on Slovakia<br />
<strong>2006</strong>/<strong>07</strong> 2005/06 Change in %<br />
Revenues in TEUR 23,633.9 7,466.2 216.5%<br />
EBIT in TEUR 23,816.7 -21,420.8 211.2%<br />
Letable space as a % of the total portfolio 6.3% 9.4% -33.0%<br />
Fair value in EUR million 671.5 285.9 134.9%<br />
Fair value as a % of the total portfolio 7.5% 14.8% -49.3%<br />
Logistics properties 0.3%<br />
Parking 11.8%<br />
Retail properties 38.0% 49.9% Office properties
6.2 Segment SEE<br />
Overview of properties in the SEE segment<br />
<strong>2006</strong>/<strong>07</strong> 2005/06 Change in %<br />
Residential properties<br />
Number of objects 46 7 557.1%<br />
Letable space in sqm<br />
Retail properties<br />
1,383,339 113,427 1,119.6%<br />
Number of objects 48 1 4,700.0%<br />
Letable space in sqm<br />
Office properties<br />
1,787,788 30,100 5,839.5%<br />
Number of objects 27 11 145.5%<br />
Letable space in sqm<br />
Logistics properties<br />
869,581 242,426 258.7%<br />
Number of objects 14 0 -<br />
Letable space in sqm 466,000 0 -<br />
Total number of objects 135 19 610.5%<br />
Letable space in sqm 4,506,708 385,953 1,067.7%<br />
Proportional share of letable space in sqm 2,011,043 213,721 841.0%<br />
6.2.1. The market environment in SEE<br />
In South-eastern Europe, <strong>IMMOEAST</strong> is present in Romania, Bulgaria, Slovenia, Serbia and Croatia.<br />
Slovenia has been a member of the European Union since 2004, and Bulgaria and Romania joined<br />
in 20<strong>07</strong>. Economic development in Serbia and Croatia has been partly overshadowed by administrative<br />
and structural reforms – the growth rate for these five countries equals 5 to 6%, which exceeds<br />
the European average by a significant margin.<br />
6.2.2. The development of business in the SEE segment<br />
Key data on the SEE segment<br />
Segment <strong>Report</strong>s<br />
<strong>2006</strong>/<strong>07</strong> 2005/06 Change in %<br />
Revenues in TEUR 25,992.9 14,115.6 84.1%<br />
EBIT in TEUR 223,150.8 31,804.7 601.6%<br />
Cash EBIT in TEUR 11,617.7 9,862.7 17.8%<br />
Segment assets in TEUR 869,069.9 255,699.6 239.9%<br />
Segment liabilities in TEUR 457,621.8 163,941.9 179.1%<br />
Letable space as a % of the total portfolio 41.1% 15.1% 172.3%<br />
Fair value in EUR million 3,677.5 240.1 1,431.7%<br />
Fair value as a % of the total portfolio 40.8% 12.4% 229.0%<br />
<strong>Report</strong> by the Executive Board 93<br />
Highlights <strong>2006</strong>/<strong>07</strong><br />
Business Model and Strategy<br />
Portfolio Structure<br />
Corporate Governance and Outlook<br />
Property Portfolio<br />
Development of Business<br />
Consolidated Financial Statements<br />
Service and Glossary<br />
Above-average economic<br />
growth of 5 to 6%
94 <strong>IMMOEAST</strong> <strong>Annual</strong> <strong>Report</strong> <strong>2006</strong>/<strong>07</strong><br />
84.1% increase in revenues<br />
by Romania form<br />
strongest submarket<br />
Distribution of letable space<br />
by sector in SEE<br />
As of 30.4.20<strong>07</strong><br />
Strong demand in<br />
all sectors<br />
Revenues recorded in the SEE segment rose by 84.1% to TEUR 25,992.9 in <strong>2006</strong>/<strong>07</strong>. In Romania,<br />
the most important submarket, revenues increased 62% to TEUR 22,806.3, while the remaining<br />
countries generated revenues for the first time. The SEE segment contributed roughly 41% or<br />
TEUR 223,150.8 to Group EBIT, with Romania and Bulgaria providing the major share of operating<br />
profit.<br />
Recreation/hotel properties 0.8%<br />
Parking 1.4%<br />
Logistics properties 16.5%<br />
Residential properties 23.1%<br />
6.2.3. Romania<br />
Country information<br />
Population in mill.<br />
<strong>2006</strong><br />
21.6<br />
Real GDP increase in % 7.7<br />
GDP per capita in EUR 4,500.0<br />
I n f l a t i o n i n % 4 . 9<br />
30.4% Retail properties<br />
27.8% Office properties<br />
Source: Eurostat<br />
The property market in Romania<br />
The demand by international companies for office space has led to the development of a functioning<br />
office market in the Romanian capital of Bucharest during recent years. The current volume<br />
totals roughly 850,000 sqm and, despite extensive construction – the production of new space is<br />
expected to equal 320,000 sqm in 20<strong>07</strong> – there is a demand overhang, which has had a positive<br />
effect on vacancy rates and pre-letting for new projects. However, the growing interest of investors<br />
has led to a decline in realisable returns and this trend is expected to continue in the future.<br />
The residential market with its roughly 8 million units is characterised by a high component of substandard<br />
apartments and an above-average number of persons per household. In combination with<br />
the rising level of income and the growing availability of mortgage financing for private persons, the<br />
demand for modern housing is increasing steadily. This strong economic growth also represents an<br />
important driver for the retail sector, above all in the capital city and the roughly 25 population centres<br />
with more than 100,000 residents. The logistics market can be described as underdeveloped<br />
due to a general lack of transportation infrastructure, but activities in this sector should receive<br />
substantial impulses from projects supported by the EU.
The development of business in Romania<br />
With an increase of 61.6% in revenues to TEUR 22,806.3, Romania is the largest country market by<br />
far in the SEE segment. EBIT rose by nearly 303% year-on-year to equal TEUR 128,009.7 in <strong>2006</strong>/<strong>07</strong>,<br />
supported by a massive increase in revaluation results to TEUR 117,134.2. The most important<br />
investments made during the <strong>2006</strong>/<strong>07</strong> financial year were the acquisition of the Polus City shopping<br />
centre in Cluj, the Polus Center in Constanta and the Victoria Park in Bucharest.<br />
Key data on Romania<br />
<strong>2006</strong>/<strong>07</strong> 2005/06 Change in %<br />
Revenues in TEUR 22,806.3 14,115.6 61.6%<br />
EBIT in TEUR 128,009.7 31,804.7 302.5%<br />
Letable space as a % of the total portfolio 33.4% 14.2% 135.2%<br />
Fair value in EUR million 3,247.2 240.1 1,252.4%<br />
Fair value as a % of the total portfolio 36.0% 12.4% 190.3%<br />
Recreation/hotel properties 0.9%<br />
Parking 1.4%<br />
Logistics properties 20.3%<br />
Residential properties 23.2%<br />
6.2.4. Bulgaria<br />
Country information<br />
Population in mill.<br />
<strong>2006</strong><br />
7.8<br />
Real GDP increase in % 6.1<br />
GDP per capita in EUR 3,270.0<br />
Inflation in % 6.1<br />
29.4% Retail properties<br />
24.8% Office properties<br />
Source: Eurostat<br />
Segment <strong>Report</strong>s<br />
The property market in Bulgaria<br />
The office market in the Bulgarian capital of Sofia comprises approximately 550,000 sqm, of which<br />
only a small part meets the international A-class standards. In the coming years, the market entry of<br />
numerous international corporations is expected to trigger a further increase in the existing demand<br />
overhang. Similar to most of the countries in Eastern and South-eastern Europe, a large share of<br />
the properties in the Bulgarian residential market is unable to meet the rising demand for quality<br />
space. The demand for modern housing is growing with the general increase in incomes. There is<br />
also substantial pent-up demand in the retail sector – not only in Sofia, but also in the ten cities<br />
<strong>Report</strong> by the Executive Board 95<br />
Highlights <strong>2006</strong>/<strong>07</strong><br />
Business Model and Strategy<br />
Portfolio Structure<br />
Corporate Governance and Outlook<br />
Property Portfolio<br />
Development of Business<br />
Consolidated Financial Statements<br />
Service and Glossary<br />
Increased investments lead to<br />
plus of 61.6% 61.6% in revenues and<br />
a a significant rise in in EBIT<br />
Distribution of letable space<br />
by sector in Romania<br />
As of 30.4.20<strong>07</strong><br />
Strong demand for office,<br />
retail and residential space
96 <strong>IMMOEAST</strong> <strong>Annual</strong> <strong>Report</strong> <strong>2006</strong>/<strong>07</strong><br />
First revenues and high<br />
revaluation results<br />
Smaller markets, but selected<br />
opportunities for investments<br />
with populations of more than 100,000. Developments in the logistics sector are different, and are<br />
dependent on the realisation of modern infrastructure projects.<br />
The development of business in Bulgaria<br />
The first revenues were recorded in Bulgaria during the <strong>2006</strong>/<strong>07</strong> financial year, for a total of TEUR<br />
482.5. EBIT, which is comprised entirely of revaluation results, equalled TEUR 78,643. The most<br />
important direct investment was the acquisition of a mixed use property in the capital city of Sofia<br />
with roughly 40,000 sqm of letable space.<br />
Key data on Bulgaria<br />
Revenues in TEUR<br />
<strong>2006</strong>/<strong>07</strong><br />
482.5<br />
EBIT in TEUR 78,643.7<br />
Letable space as a % of the total portfolio 3.7%<br />
Fair value in EUR million 289.3<br />
Fair value as a % of the total portfolio 3.2%<br />
6.2.5. Other SEE markets – Slovenia, Serbia and Croatia<br />
Country information<br />
Slovenia Serbia Croatia<br />
Population in mill. 2.0 7.5 *) Slovenia Serbia Croatia<br />
Population in mill. 2.0 7.5 4.4<br />
Real GDP increase in % 5.2 5.0 4.8<br />
GDP per capita in EUR 14,810.0 3,000.0 7,700.0<br />
Inflation in % 3.0 6.6 3.2<br />
*) 4.4<br />
Real GDP increase in % 5.2 5.0 4.8<br />
GDP per capita in EUR 14,810.0 3,000.0 7,700.0<br />
Inflation in % 3.0 6.6 3.2<br />
*) excl. Kosovo<br />
Source: Eurostat<br />
The property markets in Slovenia, Croatia and Serbia<br />
A number of property submarkets have developed in this region during recent years, parallel to the<br />
general growth of the economy. The office market is concentrated primarily in the capital cities of<br />
Belgrade, Zagreb and Ljubljana, and is characterised by a limited number of major projects that<br />
are being realised by West European investors. The retail sector is well-developed in Croatia and,<br />
above all in Slovenia, and is considered to be quantifiable due to the size of these countries. On the<br />
residential market, interesting projects for investors are found primarily in the major cities and the<br />
attractive costal regions of Croatia and Slovenia.<br />
The development of business<br />
<strong>IMMOEAST</strong> entered the markets in Slovenia, Serbia and Croatia during the <strong>2006</strong>/<strong>07</strong> financial year.<br />
Business operations in Serbia focus on the Francuska residential project with roughly 120 apartments.<br />
Acquisitions made during the reporting year include the Grand Centar in the Croatian capital<br />
of Zagreb and two specialty shopping centres in the Slovenian cities of Kranj and Nove Mesto.
Key Data<br />
Slovenia Croatia Serbia<br />
Revenues in TEUR 1,113.1 1.1 1,589.7<br />
EBIT in TEUR 9,406.0 -259.0 7,350.3<br />
Letable space as a % of the total portfolio 1.3 1.1 1.7<br />
Fair value in EUR million 31.3 14.5 45.8<br />
Fair value as a % of the total portfolio 0.4% 0.2% 0.5%<br />
6.3 Segment CIS<br />
Overview of properties in the CIS segment<br />
<strong>2006</strong>/<strong>07</strong> 2005/06 Change in %<br />
Residential properties<br />
Number of objects 1 0 -<br />
Letable space in sqm<br />
Retail properties<br />
292,931 0 -<br />
Number of objects 9 4 125.0%<br />
Letable space in sqm<br />
Office properties<br />
487,300 140,500 246.8%<br />
Number of objects 4 3 33.3%<br />
Letable space in sqm<br />
Logistics properties<br />
46,627 26,672 74.8%<br />
Number of objects 6 1 500.0%<br />
Letable space in sqm 311,058 144,000 116.0%<br />
Total number of objects 20 8 150.0%<br />
Letable space in sqm 1,137,916 181,572 526.7%<br />
Proportional share of letable space in sqm 327,449 10,990 2,879.5%<br />
6.3.1. The market environment in CIS<br />
Segment <strong>Report</strong>s<br />
In the CIS (Community of Independent States) <strong>IMMOEAST</strong> completed its first direct investments in<br />
Russia and Ukraine – the two largest countries in Europe based on area – during the <strong>2006</strong>/<strong>07</strong> financial<br />
year. These two countries recorded above-average growth of 6 to 7% in spite of rising political<br />
tensions. Numerous reforms in recent years have led to an improvement in the legal framework,<br />
which has created greater security for foreign investors.<br />
6.3.2. Developments in <strong>2006</strong>/<strong>07</strong><br />
<strong>IMMOEAST</strong> recorded its first revenues of TEUR 24,726.6 in the CIS segment during the reporting<br />
year, which were generated entirely in the subsegment Russia. Positive revaluation results from<br />
Russia were contrasted with negative EBIT from Ukraine, for net EBIT of TEUR 49,193.9 million.<br />
<strong>Report</strong> by the Executive Board 97<br />
Highlights <strong>2006</strong>/<strong>07</strong><br />
Business Model and Strategy<br />
Portfolio Structure<br />
Corporate Governance and Outlook<br />
Property Portfolio<br />
Development of Business<br />
Consolidated Financial Statements<br />
Service and Glossary<br />
Economic growth of 6% to 7%<br />
Segment revenues generated<br />
entirely in Russia
98 <strong>IMMOEAST</strong> <strong>Annual</strong> <strong>Report</strong> <strong>2006</strong>/<strong>07</strong><br />
Distribution of letable space<br />
by sector in the CIS segment<br />
As of 30.4.20<strong>07</strong><br />
Enormous market potential<br />
and above-average returns<br />
Key data on the CIS segment<br />
Revenues in TEUR<br />
<strong>2006</strong>/<strong>07</strong><br />
24,726.6<br />
EBIT in TEUR 49,193.9<br />
Letable space as a % of the total portfolio 6.7%<br />
Fair value in EUR million 1,029.9<br />
Fair value as a % of the total portfolio 11.4%<br />
Recreation/hotel properties 6.2%<br />
Parking 6.3%<br />
Office properties 6.7%<br />
Logistics properties 11.3%<br />
Residential properties 17.9%<br />
6.3.3. Russia<br />
Country information<br />
Population in mill.<br />
<strong>2006</strong><br />
142.4<br />
Real GDP increase in % 6.7<br />
GDP per capita in EUR 5,500.0<br />
I n f l a t i o n i n % 9. 7<br />
51.6% Retail properties<br />
Source: Eurostat<br />
The property market in Russia<br />
The Russian property market, above all in Moscow, is a highly interesting market for foreign investors<br />
because of its size and the large range of available opportunities – and despite the higher risk. Initial<br />
returns total 9%, and exceed the average of other West European cities. The office market in Moscow<br />
has approximately 5.3 million sqm of space, whereby roughly one-fifth meets western standards.<br />
The inherent potential of this submarket is also demonstrated by other indicators: the office space<br />
per resident currently equals 0.5 sqm in Moscow, compared with more than 6 sqm in Vienna and<br />
1 sqm in Budapest. Demand totalled roughly 1 million sqm in <strong>2006</strong>, while the vacancy rate remained<br />
at a low 3% in spite of massive construction activity. There is enormous pent-up demand in the retail<br />
sector, which has profited from the growth of the middle class: based on the size of the population,<br />
Moscow has 0.02 sqm of retail space (Austria: 0.24 sqm). Excellent infrastructure connections (airports,<br />
inland ports) also give Moscow a special standing on the logistics market. This submarket has<br />
a volume of nearly 3 million sqm and has virtually no vacancies despite an increase of 40% in space<br />
during the previous year. Another office market that has drawn the increased interest of international<br />
investors is developing in St. Petersburg. This second largest city in Russia is rapidly becoming a<br />
functional regional submarket because of its attractiveness for foreign companies.
Key data on Russia<br />
Revenues in TEUR<br />
<strong>2006</strong>/<strong>07</strong><br />
22,145.0<br />
EBIT in TEUR 61,424.0<br />
Letable space as a % of the total portfolio 4.5<br />
Fair value in EUR million 971.8<br />
Fair value as a % of the total portfolio 10.8%<br />
The acquisition of the Golden Babylon I and II properties and the 5th Avenue shopping mall in<br />
Moscow generated revenues of TEUR 22,145.0 in Russia during <strong>2006</strong>/<strong>07</strong>, representing 15% of total<br />
revenues recorded by <strong>IMMOEAST</strong>. EBIT equalled TEUR 61,424.0, and was supported by positive<br />
revaluation results.<br />
6.3.4. Ukraine<br />
Country information<br />
Population in mill.<br />
<strong>2006</strong><br />
46.7<br />
Real GDP increase in % 7.1<br />
GDP per capita in EUR 1,810.0<br />
Inflation in % 9.1<br />
Source: Eurostat<br />
The property market in Ukraine<br />
Even though Ukraine has five cities with a population of more than one million, the property investment<br />
market is still located primarily in the capital city of Kiev. With total space of approximately<br />
620,000 sqm, the office market in Kiev is in an early stage of development. New production reached<br />
177,000 sqm in <strong>2006</strong>, and was met by rising demand and almost no vacancies. Nearly three-fourths<br />
of all new space was let to international corporations. The property markets in the logistics and<br />
retail sectors have also started to develop, although with a slight delay. The supply of logistics<br />
facilities equalled 200,000 sqm in <strong>2006</strong>, but is expected to double during 20<strong>07</strong>. The volume of retail<br />
space is forecasted to rise from 300,000 sqm to 800,000 sqm by 2009. In Ukraine the space on the<br />
property market meets international standards in only a limited number of cases. For this reason,<br />
foreign investors tend to focus primarily on projects that are realised by well – known property<br />
development companies. Therefore, the investment market has only started its evolution.<br />
Key data on Ukraine<br />
Segment <strong>Report</strong>s<br />
Revenues in TEUR<br />
<strong>2006</strong>/<strong>07</strong><br />
0<br />
EBIT in TEUR -12,230.1<br />
Letable space as a % of the total portfolio 2.2%<br />
Fair value in EUR million 58.2<br />
Fair value as a % of the total portfolio 0.6%<br />
<strong>Report</strong> by the Executive Board 99<br />
Highlights <strong>2006</strong>/<strong>07</strong><br />
Business Model and Strategy<br />
Portfolio Structure<br />
Corporate Governance and Outlook<br />
Property Portfolio<br />
Development of Business<br />
Consolidated Financial Statements<br />
Service and Glossary<br />
Three major acquisitions<br />
acquisitions<br />
generate revenues of<br />
TEUR 22,145.0<br />
Property market in the<br />
early stage of development
100 <strong>IMMOEAST</strong> <strong>Annual</strong> <strong>Report</strong> <strong>2006</strong>/<strong>07</strong><br />
7. Outlook<br />
The successful conclusion of the capital increase gives <strong>IMMOEAST</strong> impressive liquidity reserves of<br />
approximately EUR 3 billion, which will guarantee the implementation of the EUR 6 billion investment<br />
programme that is planned for 20<strong>07</strong>/08. Of this total, EUR 2.3 billion were realised by the end<br />
of June 20<strong>07</strong>. The property portfolio, including contracted investments, will therefore increase to at<br />
least EUR 13 billion by the end of April 2008.<br />
The extensive investments that are planned for the 20<strong>07</strong>/08 financial year will also lead to a significant<br />
change in the structure of the <strong>IMMOEAST</strong> portfolio, both from a geographic and a sector<br />
standpoint. The focal point of investment activity will move to South-eastern Europe, Russia and<br />
Ukraine, while the sector diversification will show a shift toward retail properties. The share of<br />
development projects will also continue to increase, and thereby safeguard the long-term earning<br />
power of <strong>IMMOEAST</strong>.<br />
The high volume of development projects will make an important contribution to the expected<br />
increase in net asset value per share to EUR 11.50. That represents an increase of approx. 13% in<br />
the inherent value of the company compared with the <strong>2006</strong>/<strong>07</strong> financial year.<br />
Only part of the 20<strong>07</strong>/08 investment programme will be reflected in the financial statements for that<br />
year because of the high share of development projects. Roughly two-thirds of these investments<br />
will begin to generate earnings and cash flow in the following two financial years. However, these<br />
investments will form a sound basis for the positive and sustainable development of <strong>IMMOEAST</strong> in<br />
the future.<br />
Gross cash flow should reach nearly EUR 100 million for the first time in 20<strong>07</strong>/08, and revenues will<br />
exceed EUR 300 million. A further goal is to raise the cash EBIT margin to 40% over the mid-term.
Consolidated<br />
Financial Statements of<br />
<strong>IMMOEAST</strong> AG<br />
Consolidated balance sheet 102<br />
Consolidated income statement 103<br />
Statement of changes in equity 104<br />
Consolidated cash flow statement 105<br />
Segment reporting 106<br />
Notes to the financial statements 116<br />
General principles 116<br />
Basis of consolidation 118<br />
Accounting and valuation principles 172<br />
Notes to the balance sheet 185<br />
Notes to the income statement 213<br />
Notes to the cash flow statement 219<br />
Segment reporting 221<br />
Other information 225<br />
Group companies 235<br />
Auditor’s report 242<br />
Analysis of results 244<br />
Valuation certificates 257<br />
<strong>Report</strong> by the Executive Board 101<br />
Highlights <strong>2006</strong>/<strong>07</strong><br />
Business Model and Strategy<br />
Portfolio Structure<br />
Corporate Governance and Outlook<br />
Property Portfolio<br />
Development of Business<br />
Consolidated Financial Statements<br />
Service and Glossary
102 <strong>IMMOEAST</strong> <strong>Annual</strong> <strong>Report</strong> <strong>2006</strong>/<strong>07</strong><br />
<strong>IMMOEAST</strong> AG<br />
Consolidated balance sheet as of 30 April 20<strong>07</strong><br />
with comparison to prior year data<br />
30 April 20<strong>07</strong> 30 April <strong>2006</strong><br />
ASSETS SSETS Notes in TEUR in TEUR<br />
Investment property (4.1.1) 3,501,914.5 1,586,376.6<br />
Property under construction (4.1.2) 242,772.6 85,632.7<br />
Other tangible assets (4.2) 2,157.4 1,693.3<br />
Intangible assets (4.3) 182,775.1 1,967.8<br />
Shares in associated companies (4.4) 372,468.8 21,574.4<br />
Other financial instruments (4.5) 290,274.2 94,089.6<br />
Receivables and other assets (4.6) 94,022.9 16,120.2<br />
Deferred tax assets (4.15) 61,089.0 23,042.5<br />
Non-current assets 4,747,474.5 1,830,497.1<br />
Receivables and other assets (4.6) 1,196,878.6 478,005.0<br />
Property held for sale (4.1.3) 0.0 42,847.6<br />
Inventories (4.8) 81,694.3 18,375.5<br />
Financial instruments (4.7) 300,000.0 101,966.0<br />
Cash and cash equivalents 402,146.3 215,762.7<br />
Current assets 1,980,719.2 856,956.8<br />
ASSETS 6,728,193.7 2,687,453.9<br />
EQ EQUIT UITY T AND LIA IABILITIES ILITIES<br />
Share capital 555,882.8 222,353.1<br />
Reserves 3,568,029.5 1,219,560.1<br />
Revaluation reserve 813.1 75.7<br />
Retained earnings and consolidated profit 738,677.8 204,918.6<br />
Currency translation adjustment 43,894.2 15,064.2<br />
4,9<strong>07</strong>,297.5 1,661,971.7<br />
Minority interests 15,788.4 -17.4<br />
Equity (4.9) 4,923,085.8 1,661,954.3<br />
Long-term financial liabilities (4.10) 957,489.0 614,655.6<br />
Trade accounts payable (4.11) 1,894.8 869.6<br />
Provisions (4.12) 1,894.8 1,597.5<br />
Other liabilities (4.13) 51,928.4 15,951.5<br />
Deferred tax liabilities (4.15) 473,099.1 186,946.7<br />
Non-current liabilities 1,486,306.1 820,020.9<br />
Short-term financial liabilities (4.10) 116,139.4 87,641.6<br />
Trade accounts payable (4.11) 105,086.3 47,823.8<br />
Provisions (4.12) 12,255.7 9,609.1<br />
Other liabilities (4.13) 85,320.5 60,404.2<br />
Current liabilities 318,801.8 205,478.7<br />
EQUIT UITY TY AND LIA LIABILITIES<br />
ILITIES 6,728,193.7 2,687,453.9<br />
The following notes to the consolidated financial statements form an integral part of this consolidated balance sheet.
<strong>IMMOEAST</strong> AG<br />
Consolidated income statement<br />
with comparison to prior year data<br />
<strong>Report</strong> by the Executive Board 103<br />
Highlights <strong>2006</strong>/<strong>07</strong><br />
Business Model and Strategy<br />
Portfolio Structure<br />
Corporate Governance and Outlook<br />
Property Portfolio<br />
Development of Business<br />
Consolidated Financial Statements<br />
Service and Glossary<br />
Notes <strong>2006</strong>/<strong>07</strong> in TEUR 2005/06 in TEUR<br />
Revenues (5.1) 192,920.4 80,014.5<br />
Revaluation of properties (5.2) 493,095.1 116,986.1<br />
Other operating income (5.3) 45,724.6 51,334.4<br />
Depreciation and amortisation (5.4) -43,816.3 -31,868.0<br />
Expenses related to properties (5.5) -54,272.7 -23,027.9<br />
Other operating expenses (5.6) -91,214.4 -36,844.1<br />
Personnel expenses (5.7) -329.8 -24.4<br />
Cost of goods sold (5.8) -818.2 -301.2<br />
Operating perating profit ( (EBI BIT) T 541,288.7 156,269.4<br />
Net financing costs 14,131.8 -1,612.9<br />
Income/(loss) on financial instruments 89,331.2 29,492.3<br />
Share of profit/(loss) from associated companies 700.6 -1,203.1<br />
Financial results (5.9) 104,163.5 26,676.3<br />
Earnings arnings before tax ( (EBT) T 645,452.2 182,945.7<br />
Income taxes (5.10) -109,269.1 -37,654.3<br />
Net profit for the period 536,183.1 145,291.4<br />
Equity quity holders of the parent company 528,172.7 145,308.4<br />
Minority inority interests 8,010.4 -17.0<br />
Earnings arnings per share in EUR UR (8.2) 1.02 0.76<br />
The he following notes to the consolidated financial statements form an integral part of this consolidated income statement.<br />
Balance sheet<br />
Income statement
104 <strong>IMMOEAST</strong> <strong>Annual</strong> <strong>Report</strong> <strong>2006</strong>/<strong>07</strong><br />
<strong>IMMOEAST</strong> AG<br />
Statement tatement of changes in equity<br />
Revalu- Currency<br />
Share Capital ation Retained translation Minority<br />
All amounts in TEUR capital reserves reserve earnings adjustment interests Total T<br />
Balance on 30 April pril 2005 59,294.2 286,559.9 0.0 54,032.9 6,195.5 1,621.6 4<strong>07</strong>,704.1<br />
Fair value reserve 6,952.6 6,952.6<br />
Deferred tax assets/<br />
liabilities recognised directly in equity -1,738.1 -1,738.1<br />
Net income recognised directly in equity 5,214.5 5,214.5<br />
Net profit as of 30 April <strong>2006</strong> 145,308.4 -17.0 145,291.4<br />
Total otal recognised income<br />
and expense for the period 150,523.0 -17.0 150,506.0<br />
Capital increase 163,058.9 962,047.7 1,125,106.6<br />
Cost of capital increase -29,047.5 -29,047.5<br />
Currency translation adjustment 0.2 9,086.3 -41.0 9,045.5<br />
Structural changes -1,581.0 -1,581.0<br />
Change in consolidation method 75.7 75.7<br />
Changes in shareholders‘<br />
equity of associates 362.5 -217.6 145.0<br />
Balance on 30 April pril <strong>2006</strong> 222,353.1 1,219,560.1 75.7 204,918.6 15,064.2 -17.4 1,661,954.3<br />
Fair value reserve 7,402.1 7,402.1<br />
Deferred tax assets/<br />
liabilities recognised directly in equity -1,850.5 -1,850.5<br />
Net income recognised directly in equity 5,551.6 5,551.6<br />
Net profit as of 30 April 20<strong>07</strong> 528,172.7 8,010.4 536,183.1<br />
Total otal recognised income<br />
and expense for the period 533,724.3 8,010.4 541,734.7<br />
Capital increase 333,529.7 2,418,090.0 2,751,619.6<br />
Cost of capital increase -69,620.5 -69,620.5<br />
Currency translation adjustment 28,709.0 385.6 29,094.6<br />
Structural changes -10.3 10.3 0.0<br />
Change in consolidation method/<br />
additions to consolidation range 737.5 7,399.5 8,136.9<br />
Changes in shareholders‘<br />
equity of associates 45.3 121.0 166.2<br />
Balance on 30 April pril 20<strong>07</strong> 555,882.8 3,568,029.5 813.1 738,677.8 43,894.2 15,788.4 4,923,085.8<br />
The he following notes to the consolidated financial statements form an integral part of this statement of changes in equity.
<strong>IMMOEAST</strong> AG<br />
Consolidated cash flow statement<br />
with comparison to prior year data<br />
<strong>Report</strong> by the Executive Board 105<br />
Highlights <strong>2006</strong>/<strong>07</strong><br />
Business Model and Strategy<br />
Portfolio Structure<br />
Corporate Governance and Outlook<br />
Property Portfolio<br />
Development of Business<br />
Consolidated Financial Statements<br />
Service and Glossary<br />
All amounts in TEUR <strong>2006</strong>/<strong>07</strong> 2005/06<br />
Earnings before tax 645,452.2 182,945.7<br />
Amortisation/reversal of negative goodwill 110,808.4 3,919.8<br />
Share of profit/(loss) from associated companies -700.6 1,203.1<br />
Gain/(loss) on the sale of non-current assets -14,009.7 220.4<br />
Gains on the change in investments 0.0 -3,964.9<br />
Temporary changes in the fair value of financial instruments -89,080.3 -29,499.8<br />
Income taxes paid -13,062.8 -1,651.4<br />
Net financing costs -10,585.0 7,278.7<br />
Other non-cash income/(expenses) -565,460.7 -135,597.5<br />
Gross cash flow 63,361.5 24,854.1<br />
Receivables and other assets -103,242.6 -40,204.3<br />
Trade accounts payable 35,854.0 18,829.8<br />
Provisions (excl. tax provisions) -6,790.1 4,581.3<br />
Other liabilities -110,280.4 -1,277.2<br />
Cash flow from operating activities -121,097.5 6,783.7<br />
Acquisition of property -360,266.2 -126,834.8<br />
Acquisition of property companies less cash and cash equivalents (TEUR 51,391.5, 2005/06: TEUR 20,880.8) -732,135.1 -278,836.2<br />
Acquisition of other tangible assets -324.1 1,847.4<br />
Acquisition of intangible assets 0.0 92.0<br />
Acquisition of financial instruments -544,875.0 -8,990.0<br />
Granting of short-term financing -657,044.0 -412,534.1<br />
Proceeds from the sale of current assets 0.0 2,117.6<br />
Proceeds from the sale of non-current assets 63,053.3 4,136.9<br />
Proceeds from the sale of financial instruments 2,664.1 6,099.2<br />
Interest income from financial instruments 54,647.7 13,453.5<br />
Cash flows from investing activities -2,174,279.3 -799,448.5<br />
Cash inflows from long-term financing 176,220.8 116,665.7<br />
Cash inflows from capital increases 2,658,792.3 1,086,376.6<br />
Cash inflows from changes in investments 6.4 -1,321.4<br />
Repayment of short-term debt -67,926.0 -2,461.5<br />
Repayment of long-term debt -67,540.0 -130,673.4<br />
Interest expense -34,800.6 -12,439.3<br />
Cash flows from financing activities 2,664,752.7 1,056,146.7<br />
Differences arising from foreign currency translation 15,041.6 -4,564.9<br />
Change in cash and cash equivalents 384,417.6 258,917.0<br />
Cash and cash equivalents at the beginning of the period 317,728.7 58,811.7<br />
Cash and cash equivalents at the end of the period 702,146.3 317,728.7<br />
Change in cash and cash equivalents 384,417.6 258,917.0<br />
The he following notes to the consolidated financial statements form an integral part of this cash flow statement.<br />
Changes in equity<br />
Cash flow statement
106 <strong>IMMOEAST</strong> <strong>Annual</strong> <strong>Report</strong> <strong>2006</strong>/<strong>07</strong><br />
<strong>IMMOEAST</strong> AG<br />
Segment reporting<br />
Segmentation by region<br />
CEE<br />
Hungary Czech Republic Poland<br />
All amounts in TEUR <strong>2006</strong>/<strong>07</strong> 2005/06 <strong>2006</strong>/<strong>07</strong> 2005/06 <strong>2006</strong>/<strong>07</strong> 2005/06<br />
Offices 11,208.0 8,706.0 19,752.9 7,669.9 15,210.6 4,295.2<br />
Logistics/commercial 11,864.2 6,263.1 9,862.8 8,491.6 16,458.3 5,606.4<br />
Residential 0.0 0.0 55.4 55.2 0.0 0.0<br />
Parking 703.0 430.3 1,424.9 647.0 774.1 2<strong>07</strong>.8<br />
Rental income 23,775.2 15,399.4 31,096.0 16,863.8 32,443.0 10,109.3<br />
Sale of inventories 0.0 276.7 0.0 0.0 818.2 0.0<br />
Operating costs charged to tenants 8,119.7 5,022.2 8,740.0 5,649.2 12,342.9 4,521.1<br />
Other revenues 673.4 330.7 317.3 190.6 241.2 61.8<br />
Revenues 32,568.4 21,029.1 40,153.4 22,703.6 45,845.3 14,692.3<br />
Revaluation of properties 13,596.8 46,637.2 146,145.4 13,015.1 60,746.9 37,890.9<br />
Other operating income 20,677.3 773.1 796.3 1,282.5 6,899.2 20,983.3<br />
Depreciation and amortisation -1,024.6 -1,781.5 -12,457.8 -4,648.4 -7,980.1 -4,906.9<br />
Expenses related to properties -11,701.9 -5,869.7 -11,522.6 -7,572.1 -12,893.7 -4,528.5<br />
Other operating expenses -17,744.8 -5,936.6 -6,043.7 -5,229.7 -10,477.2 -8,089.0<br />
Personnel expenses -60.6 0.0 0.0 -0.1 -87.9 -18.6<br />
Cost of goods sold 0.0 -301.2 0.0 0.0 -818.2 0.0<br />
Operating profit (EBIT) 36,310.6 54,550.3 157,<strong>07</strong>1.0 19,550.8 81,234.3 56,023.5<br />
Interest and similar income 3,409.6 709.6 750.8 -319.5 545.5 1,030.7<br />
Interest and similar expenses -10,365.5 -6,311.2 -14,232.9 -4,951.3 -23,323.9 -7,310.7<br />
Income/(loss) on financial instruments 9,609.9 -10,388.3 1,545.0 10,378.5 11,905.3 7,785.4<br />
Share of profit/(loss) from associated companies 0.0 -601.2 -989.8 -601.9 0.0 0.0<br />
Financial results 2,654.0 -16,591.0 12,926.9 4,505.9 -10,873.1 1,505.4<br />
Earnings before tax (EBT) 38,964.6 37,959.3 144,144.1 24,056.7 70,361.1 57,528.9<br />
Thereof share of profit/(loss) from joint ventures<br />
Thereof share of profit/(loss) from companies<br />
1,805.1 21,141.9 43,450.1 10,259.5 32,126.8 16,333.9<br />
consolidated at equity 0.0 -601.2 -989.8 -601.9 0.0 0.0<br />
Income taxes -4,782.2 -9,199.5 -37,474.4 -9,311.9 -15,392.2 -8,040.6<br />
Net profit for the period 34,182.4 28,759.9 106,669.7 14,744.8 54,968.9 49,488.3<br />
Segment assets 602,418.2 466,178.1 1,093,378.4 467,866.0 910,9<strong>07</strong>.8 424,821.5<br />
Thereof Investment property 495,474.2 361,370.9 933,479.6 390,231.5 821,483.2 375,275.0<br />
Thereof property under construction 35,114.4 12,236.0 26,905.7 20,179.7 547.0 25,798.1<br />
Thereof in investments included at equity 0.0 8,228.1 12,508.1 13,342.4 0.0 0.0<br />
Segment liabilities 308,325.5 292,391.1 594,331.7 296,955.9 656,885.3 289,443.1<br />
Segment investments 1<strong>07</strong>,050.5 237,042.2 394,717.5 219,377.2 345,917.7 244,495.7<br />
Thereof Investments in property 61,182.4 164,183.0 388,197.5 217,762.8 312,586.4 235,162.0<br />
Thereof Investments in property under construction 45,022.1 47,310.3 6,516.3 1,384.0 33,295.9 9,769.0
Segment reporting<br />
<strong>Report</strong> by the Executive Board 1<strong>07</strong><br />
Highlights <strong>2006</strong>/<strong>07</strong><br />
Business Model and Strategy<br />
Portfolio Structure<br />
Corporate Governance and Outlook<br />
Property Portfolio<br />
Development of Business<br />
Consolidated Financial Statements<br />
Service and Glossary<br />
SEE<br />
Slovakia Romania Slovenia Serbia<br />
<strong>2006</strong>/<strong>07</strong> 2005/06 <strong>2006</strong>/<strong>07</strong> 2005/06 <strong>2006</strong>/<strong>07</strong> 2005/06 <strong>2006</strong>/<strong>07</strong> 2005/06<br />
6,792.4 2,753.9 19,128.2 11,697.1 0.0 0.0 1.2 0.0<br />
7,279.5 2,404.2 0.0 0.0 961.8 0.0 0.0 0.0<br />
0.0 0.0 0.0 0.0 0.0 0.0 0.0 0.0<br />
494.8 95.9 0.0 0.0 0.0 0.0 0.0 0.0<br />
14,566.7 5,254.0 19,128.2 11,697.1 961.8 0.0 1.2 0.0<br />
0.0 0.0 0.0 0.3 0.0 0.0 0.0 0.0<br />
8,170.9 985.8 3,677.9 2,418.2 151.2 0.0 0.0 0.0<br />
896.3 1,226.4 222.21 0.0 0.0 0.0 0.0 0.0<br />
23,633.9 7,466.2 22,806.3 14,115.6 1,113.1 0.0 1.2 0.0<br />
12,257.0 -3,623.9 117,134.2 23,066.8 8,818.7 0.0 0.0 0.0<br />
968.8 45.4 8,858.9 2,838.5 22.3 0.0 0.1 0.0<br />
-595.8 -19,261.8 -4,586.5 -1,248.1 0.0 0.0 -138.9 0.0<br />
-8,049.7 -1,856.5 -6,054.7 -3,201.3 -224.2 0.0 -68.0 0.0<br />
-4,378.5 -4,189.3 -10,144.8 -3,764.0 -323.9 0.0 -53.4 0.0<br />
-19.1 -1.0 -3.7 -2.8 0.0 0.0 0.0 0.0<br />
0.0 0.0 0.0 0.0 0.0 0.0 0.0 0.0<br />
23,816.7 -21,420.8 128,009.7 31,804.7 9,406.0 0.0 -259.0 0.0<br />
389.5 31.8 369.0 77.0 1.5 0.0 0.0 0.0<br />
-9,341.2 -2,383.1 -13,933.0 -5,340.9 -1.7 0.0 -64.0 0.0<br />
19,275.4 2,<strong>07</strong>9.9 6,833.0 3,661.0 0.0 0.0 44.5 0.0<br />
135.9 0.0 0.0 0.0 0.0 0.0 0.0 0.0<br />
10,459.7 -271.5 -6,730.9 -1,602.9 -0.2 0.0 -19.5 0.0<br />
34,276.4 -21,692.3 121,278.8 30,201.8 9,405.8 0.0 -278.5 0.0<br />
41.7 0.0 29,718.4 -144.7 0.0 0.0 0.0 0.0<br />
135.9 0.0 0.0 0.0 0.0 0.0 0.0 0.0<br />
-6,594.9 447.0 -13,631.1 -4,580.6 -2,554.0 0.0 14.0 0.0<br />
27,681.5 -21,245.3 1<strong>07</strong>,647.7 25,621.2 6,851.8 0.0 -264.5 0.0<br />
354,096.6 283,167.7 669,160.6 255,699.6 34,881.3 0.0 3,533.5 0.0<br />
293,278.9 241,370.0 425,734.8 218,129.2 31,329.2 0.0 0.0 0.0<br />
14,836.3 12,186.0 120,386.3 15,233.0 0.0 0.0 0.0 0.0<br />
4,287.1 0.0 0.0 0.0 0.0 0.0 0.0 0.0<br />
250,515.4 223,652.9 391,210.9 163,941.9 5,315.5 0.0 3,630.8 0.0<br />
14,040.4 257,478.8 179,549.9 97,301.6 22,510.5 0.0 0.3 0.0<br />
12,783.7 244,904.0 56,888.3 63,623.4 22,510.5 0.0 0.3 0.0<br />
1,256.7 12,360.6 122,657.0 33,128.0 0.0 0.0 0.0 0.0
108 <strong>IMMOEAST</strong> <strong>Annual</strong> <strong>Report</strong> <strong>2006</strong>/<strong>07</strong><br />
<strong>IMMOEAST</strong> AG<br />
Segment reporting (continued)<br />
Segmentation by region<br />
SEE<br />
All amounts in TEUR Bulgaria Croatia Russia<br />
<strong>2006</strong>/<strong>07</strong> 2005/06 <strong>2006</strong>/<strong>07</strong> 2005/06 <strong>2006</strong>/<strong>07</strong> 2005/06<br />
Offices 482.5 0.0 1,478.6 0.0 0.0 0.0<br />
Logistics/commercial 0.0 0.0 0.0 0.0 22,117.5 0.0<br />
Residential 0.0 0.0 0.0 0.0 0.0 0.0<br />
Parking 0.0 0.0 73.0 0.0 27.5 0.0<br />
Rental income 482.5 0.0 1,551.6 0.0 22,145.0 0.0<br />
Sale of inventories 0.0 0.0 0.0 0.0 0.0 0.0<br />
Operating costs charged to tenants 0.0 0.0 10.1 0.0 1,820.8 0.0<br />
Other revenues 0.0 0.0 28.0 0.0 760.8 0.0<br />
Revenues 482.5 0.0 1,589.7 0.0 24,726.6 0.0<br />
Revaluation of properties 78,740.4 0.0 6,208.2 0.0 49,447.4 0.0<br />
Other operating income 0.3 0.0 0.2 0.0 446.7 0.0<br />
Depreciation and amortisation -18.7 0.0 -1.8 0.0 -4,441.3 0.0<br />
Expenses related to properties -84.5 0.0 -432.1 0.0 -3,241.2 0.0<br />
Other operating expenses -476.3 0.0 -13.9 0.0 -5,374.0 0.0<br />
Personnel expenses 0.0 0.0 0.0 0.0 -140.2 0.0<br />
Cost of goods sold 0.0 0.0 0.0 0.0 0.0 0.0<br />
Operating profit (EBIT) 78,643.7 0.0 7,350.3 0.0 61,424.0 0.0<br />
Interest and similar income 0.4 0.0 2.1 0.0 57.0 0.0<br />
Interest and similar expenses -442.3 0.0 -544.8 0.0 -1,993.1 0.0<br />
Income/(loss) on financial instruments 0.0 0.0 -141.6 0.0 -414.1 0.0<br />
Share of profit/(loss) from associated companies 0.0 0.0 0.0 0.0 0.0 0.0<br />
Financial results -441.8 0.0 -684.3 0.0 -2,350.3 0.0<br />
Earnings before tax (EBT) 78,201.9 0.0 6,666.1 0.0 59,<strong>07</strong>3.8 0.0<br />
Thereof share of profit/(loss) from joint ventures<br />
Thereof share of profit/(loss) from companies<br />
0.0 0.0 0.0 0.0 7,490.4 0.0<br />
consolidated at equity 0.0 0.0 0.0 0.0 0.0 0.0<br />
Income taxes -7,822.9 0.0 -1,339.8 0.0 -16,040.5 0.0<br />
Net profit for the period 70,379.1 0.0 5,326.3 0.0 43,033.3 0.0<br />
Segment assets 110,848.6 0.0 50,645.9 0.0 461,793.0 0.0<br />
Thereof property 102,881.3 0.0 45,772.5 0.0 352,480.7 0.0<br />
Thereof property under construction 0.0 0.0 0.0 0.0 42,222.1 0.0<br />
Thereof in investments included at equity 0.0 0.0 0.0 0.0 0.0 0.0<br />
Segment liabilities 25,441.6 0.0 32,023.0 0.0 124,029.1 0.0<br />
Segment investments 24,140.9 0.0 39,573.4 0.0 350,527.8 0.0<br />
Thereof property 24,140.9 0.0 39,573.4 0.0 294,<strong>07</strong>8.5 0.0<br />
Thereof property under construction 0.0 0.0 0.0 0.0 56,191.1 0.0
CIS<br />
Segment reporting<br />
Ukraine Other and Group eliminations <strong>IMMOEAST</strong> Group<br />
<strong>2006</strong>/<strong>07</strong> 2005/06 <strong>2006</strong>/<strong>07</strong> 2005/06 <strong>2006</strong>/<strong>07</strong> 2005/06<br />
0.0 0.0 0.0 0.0 74,054.4 35,122.1<br />
0.0 0.0 0.0 0.0 68,544.1 22,765.3<br />
0.0 0.0 0.0 0.0 55.4 55.2<br />
0.0 0.0 0.0 0.0 3,497.3 1,381.0<br />
0.0 0.0 0.0 0.0 146,151.2 59,323.7<br />
0.0 0.0 0.0 0.0 818.2 277.0<br />
0.0 0.0 0.0 0.0 43,033.7 18,596.5<br />
0.0 0.0 0.0 7.8 2,917.3 1,817.4<br />
0.0 0.0 0.0 7.8 192,920.4 80,014.5<br />
0.0 0.0 0.0 0.0 493,095.1 116,986.1<br />
0.0 0.0 7,054.4 25,411.6 45,724.6 51,334.4<br />
-12,226.8 0.0 -343.9 -21.3 -43,816.3 -31,868.0<br />
0.0 0.0 0.00 0.0 -54,272.7 -23,027.9<br />
-1.7 0.0 -36,084.8 -9,635.5 -91,116.9 -36,844.1<br />
-1.7 0.0 -114.1 -1.9 -427.3 -24.4<br />
0.0 0.0 0.00 0.0 -818.2 -301.2<br />
-12,230.1 0.0 -29,488.6 15.760.8 541,288.7 156,269.4<br />
0.0 0.0 51,047.7 13,936.1 56,573.2 15,465.7<br />
-40.5 0.0 31,841.4 9,218.6 -42,441.5 -17,<strong>07</strong>8.6<br />
0.0 0.0 40,673.8 15,975.7 89,331.2 29,492.3<br />
0.0 0.0 1,554.4 0.0 700.6 -1,203.1<br />
-40.5 0.0 125,117.3 39.130.4 104,163.5 26,676.3<br />
-12,270.7 0.0 95,628.7 54,891.2 645,452.2 182,945.7<br />
1,471.4 0.0 -14,<strong>07</strong>3.5 5,362.9 102,030.3 52,953.4<br />
0.0 0.0 1,554.4 0.0 700.6 -1,203.1<br />
10.9 0.0 -3,662.0 -6,968.7 -109,269.1 -37,654.3<br />
-12,259.8 0.0 91,966.7 47,922.5 536,183.1 145,291.4<br />
2,796.1 0.0 2,433,733.8 789,720.9 6,728,193.7 2,687,453.9<br />
0.0 0.0 0.0 0.0 3,501,914.5 1,586,376.6<br />
2,760.8 0.0 0.0 0.0 242,772.6 85,632.7<br />
0.0 0.0 355,673.5 3.8 372,468.8 21,574.4<br />
1,835.1 0.0 -588,436.0 -240,885.1 1,805,1<strong>07</strong>.9 1,025,499.7<br />
2,814.0 0.0 18.7 2.2 1,480,861.7 1,055,697.5<br />
0.0 0.0 0.0 25.203.2 1,211,942.0 950,838.4<br />
2,814.0 0.0 0.0 0.0 267,753.1 103,951.9<br />
<strong>Report</strong> by the Executive Board 109<br />
Highlights <strong>2006</strong>/<strong>07</strong><br />
Business Model and Strategy<br />
Portfolio Structure<br />
Corporate Governance and Outlook<br />
Property Portfolio<br />
Development of Business<br />
Consolidated Financial Statements<br />
Service and Glossary
110 <strong>IMMOEAST</strong> <strong>Annual</strong> <strong>Report</strong> <strong>2006</strong>/<strong>07</strong><br />
<strong>IMMOEAST</strong> AG<br />
Segment reporting (continued)<br />
Transition from segment to Group data<br />
C E E S E E<br />
All amounts in TEUR <strong>2006</strong>/<strong>07</strong> 2005/06 <strong>2006</strong>/<strong>07</strong> 2005/06<br />
Offices 52,963.9 23,425.0 21,090.5 11,697.1<br />
Logistics/commercial 45,464.8 22,765.3 961.8 0.0<br />
Residential 55.4 55.2 0.0 0.0<br />
Parking 3,396.8 1,381.0 73.0 0.0<br />
Rental income 101,881.0 47,626.6 22,125.4 11,697.1<br />
Sale of inventories 818.2 276.7 0.0 0.3<br />
Operating costs charged to tenants 37,373.6 16,178.3 3,839.3 2,418.2<br />
Other revenues 2,128.2 1,809.5 28.2 0.0<br />
Revenues 142,201.0 65,891.1 25,992.9 14,115.6<br />
Revaluation of properties 232,746.1 93,919.3 210,901.6 23,066.8<br />
Other operating income 29,341.7 23,084.3 8,881.8 2,838.5<br />
Depreciation and amortisation -22,058.4 -30,598.6 -4,746.0 -1,248.1<br />
Expenses related to properties -44,167.9 -19,826.7 -6,863.5 -3,201.3<br />
Other operating expenses -38,644.1 -23,444.7 -11,012.3 -3,764.0<br />
Personnel expenses -167.6 -19.7 -3.7 -2.8<br />
Cost of goods sold -818.2 -301.2 0.0 0.0<br />
Operating profit (EBIT) 298,432.5 188,703.8 223,150.8 31,804.7<br />
Interest and similar income 5,095.4 1,452.6 373.1 77.0<br />
Interest and similar expenses -57,263.5 -20,956.3 -14,985.7 -5,340.9<br />
Income/(loss) on financial instruments 42,335.6 9,855.6 6,735.9 3,661.0<br />
Share of profit/(loss) from associated companies -853.8 -1,203.1 0.0 0.0<br />
Financial results -10,686.3 -10,851.2 -7,876.7 -1,602.9<br />
Earnings before tax (EBT) 287,746.2 97,852.6 215,274.1 30,201.8<br />
Thereof share of profit/(loss) from joint ventures 77,423.7 47,735.2 29,718.4 -144.7<br />
Thereof share of profit/(loss) from companies consolidated at equity -853.8 -1,203.1 0.0 0.0<br />
Income taxes -64,243.8 -26,104.9 -25,333.8 -4,580.6<br />
Net profit for the period 223,502.5 71,747.7 189,940.3 25,621.2<br />
Segment assets 2,960,800.9 1,642,033.4 869,069.9 255,699.6<br />
Thereof property 2,543,715.9 1,368,247.4 605,717.9 218,129.2<br />
Thereof property under construction 77,403.4 70,399.7 120,386.3 15,233.0<br />
Thereof in investments included at equity 16,795.2 21,570.6 0.0 0.0<br />
Segment liabilities 1,810,058.0 1,102,442.9 457,621.8 163,941.9<br />
Segment investments 861,726.1 958,393.7 265,775.0 97,301.6<br />
Thereof property 774,750.1 862,011.8 143,113.4 63,623.4<br />
Thereof property under construction 86,090.9 70,823.9 122,657.0 33,128.0
Segment reporting<br />
C I S Transition <strong>IMMOEAST</strong> Group<br />
<strong>2006</strong>/<strong>07</strong> 2005/06 <strong>2006</strong>/<strong>07</strong> 2005/06 <strong>2006</strong>/<strong>07</strong> 2005/06<br />
0.0 0.0 0.0 0.0 74,054.4 35,122.1<br />
22,117.5 0.0 0.0 0.0 68,544.2 22,765.3<br />
0.0 0.0 0.0 0.0 55.4 55.2<br />
27.5 0.0 0.0 0.0 3,497.3 1,381.0<br />
22,145.0 0.0 0.0 0.0 146,151.2 59,323.7<br />
0.0 0.0 0.0 0.0 818.2 277.0<br />
1,820.8 0.0 0.0 0.0 43,033.7 18,596.5<br />
760.8 0.0 0.0 7.8 2,917.3 1,817.4<br />
24,726.6 0.0 0.0 7.8 192,920.4 80,014.5<br />
49,447.4 0.0 0.0 0.0 493,095.1 116,986.1<br />
446.7 0.0 7,054.4 25,411.6 45,724.6 51,334.4<br />
-16,668.0 0.0 -343.9 -21.3 -43,816.3 -31,868.0<br />
-3,241.2 0.0 0.0 0.0 -54,272.7 -23,027.9<br />
-5,375.7 0.0 -36,084.8 -9,635.5 -91,116.9 -36,844.1<br />
-141.9 0.0 -114.1 -1.9 -427.3 -24.4<br />
0.0 0.0 0.0 0.0 -818.2 -301.2<br />
49,193.9 0.0 -29,488.6 15,760.8 541,288.7 156,269.4<br />
57.0 0.0 51,047.7 13,936.1 56,573.2 15,465.7<br />
-2,033.7 0.0 31,841.4 9,218.6 -42,441.5 -17,<strong>07</strong>8.6<br />
-414.1 0.0 40,673.8 15,975.7 89,331.2 29,492.3<br />
0.0 0.0 1,554.4 0.0 700.6 -1,203.1<br />
-2,390.8 0.0 125,117.3 39,130.4 104,163.5 26,676.3<br />
46,803.1 0.0 95,628.7 54,891.2 645,452.2 182,945.7<br />
8,961.7 0.0 -14,<strong>07</strong>3.5 5,362.9 102,030.3 52,953.4<br />
0.0 0.0 1,554.4 0.0 700.6 -1,203.1<br />
-16,029.6 0.0 -3,662.0 -6,968.7 -109,269.1 -37,654.3<br />
30,773.5 0.0 91,966.7 47,922.5 536,183.1 145,291.4<br />
464,589.0 0.0 2,433,733.8 789,720.9 6,728,193.7 2,687,453.9<br />
352,480.7 0.0 0.0 0.0 3,501,914.5 1,586,376.6<br />
44,982.8 0.0 0.0 0.0 242,772.6 85,632.7<br />
0.0 0.0 355,673.6 3.8 372,468.8 21,574.4<br />
125,864.2 0.0 -588,436.0 -240,885.1 1,805,1<strong>07</strong>.9 1,025,499.7<br />
353,341.8 0.0 18.7 2.2 1,480,861.7 1,055,697.5<br />
294,<strong>07</strong>8.5 0.0 0.0 25,203.2 1,211,942.0 950,838.4<br />
59,005.2 0.0 0.0 0.0 267,753.1 103,951.9<br />
<strong>Report</strong> by the Executive Board 111<br />
Highlights <strong>2006</strong>/<strong>07</strong><br />
Business Model and Strategy<br />
Portfolio Structure<br />
Corporate Governance and Outlook<br />
Property Portfolio<br />
Development of Business<br />
Consolidated Financial Statements<br />
Service and Glossary
112 <strong>IMMOEAST</strong> <strong>Annual</strong> <strong>Report</strong> <strong>2006</strong>/<strong>07</strong><br />
<strong>IMMOEAST</strong> AG<br />
Segment reporting (continued)<br />
Segmentation by sector<br />
<strong>2006</strong>/<strong>07</strong> 2005/06<br />
All amounts in TEUR Revenues Investments Assets Revenues Investments Assets<br />
Offices 74,054.4 951,490.3 1,437,435.3 44,318.2 469,165.9 959,998.6<br />
Logistics/commercial 68,544.1 527,685.9 1,330,476.6 30,453.6 586,315.0 709,785.1<br />
Residential 55.4 0.3 1,<strong>07</strong>6.0 69.0 0.0 1,494.3<br />
Parking 3,497.3 0.0 67,884.8 1,844.9 216.5 39,963.4<br />
Other 46,769.2 1,685.2 9<strong>07</strong>,814.3 3,328.7 0.0 72,105.4<br />
Total 192,920.4 1,480,861.7 3,744,687.1 80,014.5 1,055,697.5 1,733,232.4<br />
Shares in associated companies 372,468.6 21,574.4<br />
Investments in other companies 284,227.3 93,089.3<br />
Other assets 2,326,810.7 839,557.8<br />
Total Group assets 6,728,193.7 2,687,453.9
<strong>IMMOEAST</strong> AG<br />
Consolidated cash flow statement<br />
Segment reporting<br />
The following table shows the adjustment of operating profit (EBIT) to exclude non-cash components.<br />
CEE SEE CIS<br />
All amounts in TEUR <strong>2006</strong>/<strong>07</strong> <strong>2006</strong>/<strong>07</strong> <strong>2006</strong>/<strong>07</strong><br />
Operating profit (EBIT) 298,432.4 223,150.8 49,193.9<br />
Revaluation of properties -232,746.1 -210,901.6 -49,447.4<br />
Depreciation and amortisation<br />
Gain/loss on the sale of<br />
22,058.4 4,746.0 16,668.0<br />
non-current assets -14,026.2 0.0 16.6<br />
Other non-cash income/(expenses) 163.7 -4,189.9 495.7<br />
Income taxes paid -1,583.1 -1,187.7 -4,149.0<br />
Cash EBIT 72,299.0 11,617.7 12,777.9<br />
Revenues 142,200.9 25,992.9 24,726.6<br />
Cash EBIT margin 50.8% 44.7% 51.7%<br />
Other and Group eliminations <strong>IMMOEAST</strong> Group<br />
All amounts in TEUR <strong>2006</strong>/<strong>07</strong> <strong>2006</strong>/<strong>07</strong><br />
Operating profit (EBIT) -29,488.5 541,288.7<br />
Revaluation of properties 0.0 -493,095.1<br />
Depreciation and amortisation 343.9 43,816.3<br />
Gain/loss on the sale of non-current assets -0.1 -14,009.7<br />
Other non-cash income/(expenses) -2,132.6 -5,663.1<br />
Income taxes paid -33.7 -6,953.5<br />
Cash EBIT -31,310.9 65,383.6<br />
Revenues 0.0 192,920.4<br />
Cash EBIT margin 0.0% 33.9%<br />
<strong>Report</strong> by the Executive Board 113<br />
Highlights <strong>2006</strong>/<strong>07</strong><br />
Business Model and Strategy<br />
Portfolio Structure<br />
Corporate Governance and Outlook<br />
Property Portfolio<br />
Development of Business<br />
Consolidated Financial Statements<br />
Service and Glossary
114 <strong>IMMOEAST</strong> <strong>Annual</strong> <strong>Report</strong> <strong>2006</strong>/<strong>07</strong><br />
<strong>IMMOEAST</strong> AG<br />
Consolidated cash flow statement<br />
The following table shows the adjustment of operating profit (EBIT) to exclude non-cash components.<br />
All amounts in TEUR Hungary Czech Republic<br />
CEE<br />
Poland<br />
<strong>2006</strong>/<strong>07</strong> <strong>2006</strong>/<strong>07</strong> <strong>2006</strong>/<strong>07</strong><br />
Operating profit (EBIT) 36,310.6 157,<strong>07</strong>0.9 81,234.3<br />
Revaluation of properties -13,596.8 -146,145.4 -60,746.9<br />
Depreciation and amortisation 1,024.6 12,457.8 7,980.1<br />
Gain/loss on the sale of non-current assets -14,089.4 8.9 54.3<br />
Other non-cash income/(expenses) 1,141.0 273.7 -1,312.1<br />
Income taxes paid -945.2 -279.8 -356.2<br />
Cash EBIT 9,844.8 23,386.1 26,853.6<br />
Revenues 32,568.4 40,153.3 45,845.3<br />
Cash EBIT margin 30.2% 58.2% 58.6%<br />
SEE<br />
Bulgaria Croatia Russia<br />
<strong>2006</strong>/<strong>07</strong> <strong>2006</strong>/<strong>07</strong> <strong>2006</strong>/<strong>07</strong><br />
Operating profit (EBIT) 78,643.7 7,350.3 61,424.0<br />
Revaluation of properties -78,740.4 -6,208.2 -49,447.4<br />
Depreciation and amortisation 18.7 1.8 4,441.3<br />
Gain/loss on the sale of non-current assets 0.0 0.0 16.6<br />
Other non-cash income/(expenses) -0.3 0.0 389.7<br />
Income taxes paid -1.9 -0.8 -4,148.1<br />
Cash EBIT -80.2 1,143.1 12,676.1<br />
Revenues 482.5 1,589.7 24,726.6<br />
Cash EBIT margin -16.6% 71.9% 51.3%
CIS<br />
Segment reporting<br />
<strong>Report</strong> by the Executive Board 115<br />
Highlights <strong>2006</strong>/<strong>07</strong><br />
Business Model and Strategy<br />
Portfolio Structure<br />
Corporate Governance and Outlook<br />
Property Portfolio<br />
Development of Business<br />
Consolidated Financial Statements<br />
Service and Glossary<br />
Slovakia Romania<br />
SEE<br />
Slovenia Serbia<br />
<strong>2006</strong>/<strong>07</strong> <strong>2006</strong>/<strong>07</strong> <strong>2006</strong>/<strong>07</strong> <strong>2006</strong>/<strong>07</strong><br />
23,816.6 128,009.7 9,406.0 -259.0<br />
-12,257.0 -117,134.2 -8,818.7 0.0<br />
595.8 4,586.5 0.0 138.9<br />
0.0 0.0 0.0 0.0<br />
61.0 -4,189.6 0.0 0.0<br />
-1.9 -1,183.6 -0.5 -0.8<br />
12,214.5 10,088.9 586.7 -120.9<br />
23,633.9 22,806.3 1,113.1 1.2<br />
51.7% 44.2% 52.7% -9,801.3%<br />
Ukraine Other and Group eliminations <strong>IMMOEAST</strong> Group<br />
<strong>2006</strong>/<strong>07</strong> <strong>2006</strong>/<strong>07</strong> <strong>2006</strong>/<strong>07</strong><br />
-12,230.1 -29,488.5 541,288.7<br />
0.0 0.0 -493,095.1<br />
12,226.8 343.9 43,816.3<br />
0.0 -0.1 -14,009.7<br />
106.0 -2,132.6 -5,663.1<br />
-0.8 -33.7 -6,953.5<br />
101.8 -31,310.9 65,383.6<br />
0.0 0.0 192,920.4<br />
0.0% 0.0% 33.9%
116 <strong>IMMOEAST</strong> <strong>Annual</strong> <strong>Report</strong> <strong>2006</strong>/<strong>07</strong><br />
IAS 1.126(a)<br />
IAS 1.46<br />
IAS-reg.<br />
1606/2002<br />
IAS 1.14<br />
in connection<br />
with IFRS 3<br />
IAS 27.26<br />
1. General principles<br />
1.1 Introduction<br />
<strong>IMMOEAST</strong> AG (hereafter <strong>IMMOEAST</strong>) maintains its registered headquarters at A-1010 Vienna, Bankgasse 2. The<br />
business activities of the <strong>IMMOEAST</strong> Group include the development and acquisition of properties, above all in Central<br />
and Eastern Europe, as well as the sale, management and commercial utilisation of properties to optimise asset<br />
management.<br />
The company’s share has traded in the standard market segment of the Vienna Stock Exchange since 12 December<br />
2003 and in the Prime Market Segment since 21 March 2005.<br />
The consolidated financial statements were prepared in accordance with the International Financial <strong>Report</strong>ing Standards<br />
(IFRS) that were valid as of the balance sheet date. IFRS include the new IFRS issued by the International<br />
Accounting Standards Board (IASB) and International Accounting Standards (IAS) as well as the Interpretations of the<br />
International Financial <strong>Report</strong>ing Interpretations Committee (IFRIC) and Standing Interpretations Committee (SIC).<br />
These consolidated financial statements are based on Regulation (EU) Nr. 1606/2002 of the European Parliament<br />
and the European Union for the application of international accounting standards (IAS-regulation 1606/2002), which<br />
require capital market-oriented companies in the European Union to prepare and publish their consolidated financial<br />
statements for business years that begin on or after 1 January 2005 in accordance with International Financial <strong>Report</strong>ing<br />
Standards. Art. 3 Par. 1 of IAS regulation 1606/2002 requires the application of those standards, which were<br />
adopted into the body of law of the European Union through the procedure set forth in Art 6 Par. 2 of IAS regulation<br />
1606/2002. The International Financial <strong>Report</strong>ing Standards adopted by the European Union take effect immediately<br />
in the member states of the European Union and do not require separate implementation into national law. Valid<br />
standards in the sense of European Union law cover all International Financial <strong>Report</strong>ing Standards published in the<br />
relevant country language. § 245a Par. 1 of the Austrian Commercial Code in the version published in Austrian federal<br />
gazette BGBl. I 161/2004 requires companies to prepare consolidated financial statements in accordance with<br />
International Financial <strong>Report</strong>ing Standards as defined in Art. 4 Par. 1 of IAS regulation 1606/2002. The consolidated<br />
financial statements prepared in previous years by <strong>IMMOEAST</strong> in accordance with International Financial <strong>Report</strong>ing<br />
Standards were based on the option provided by § 245a Par. 1 of the Austrian Commercial Code, in the version published<br />
in Austrian federal gazette BGBl. I 1999/49. This option releases a company from the obligation to prepare<br />
consolidated financial statements pursuant to Austrian commercial law if the company prepares consolidated financial<br />
statements in accordance with international accounting standards.<br />
The IASB framework does not represent an integral part of IFRS and, for this reason, was not adopted into the body of<br />
law of the European Union. However, IAS 8.11 (b) calls for the application of the definitions and recognition criteria for<br />
assets, liabilities, expenses and income that are anchored in the framework to provide interpretations and fill gaps.<br />
In keeping with Point 2.1.5 of the (legally nonbinding) commentary on certain sections of IAS regulation 1606/2002<br />
of the EU, the framework forms a “basis for the formation of judgments on the solution of accounting problems”. For<br />
this reason and because of the express reference in IAS 8.11 (b), the framework was applied without limitation when<br />
the consolidated financial statements of <strong>IMMOEAST</strong> were prepared.<br />
The annual financial statements of all Austrian and foreign companies included in the consolidated financial statements,<br />
either through full or proportionate consolidation, were converted to IFRS. In the case of business combinations<br />
as defined in IFRS 3, the financial statements were revalued, and audited or subjected to a review by independent<br />
certified public accountants in agreement with International Standards on Auditing (ISA) and the International<br />
Standards on Review Engagements (ISRE). The accounting and valuation principles used by all companies included<br />
in the consolidated financial statements were standardised and adjusted to conform to the options elected by<br />
<strong>IMMOEAST</strong>. In accordance with IAS 27.26, the balance sheet date for the consolidated financial statements is the<br />
same as the balance sheet date of the parent company. The annual financial statements of all companies included in<br />
the consolidation were prepared on the same balance sheet date as the consolidated financial statements.
The principle of fair presentation was observed in preparing the consolidated financial statements. The financial<br />
position and financial performance as well as cash inflows and cash outflows of the company provide a true and fair<br />
view of the actual situation and events in all material respects.<br />
The consolidated financial statements are presented in thousand Euro (“TEUR”, rounded). The use of automatic data<br />
processing equipment can lead to rounding differences in the addition of rounded amounts or percentage rates.<br />
1.2 Statement of compliance with IFRS<br />
The consolidated financial statements prepared by <strong>IMMOEAST</strong> reflect the full scope of International Financial <strong>Report</strong>ing<br />
Standards in their current version, to the extent that these IFRS were adopted by the European Union into the<br />
European Union body of law in accordance with Art. 6 Par. 2 of IAS regulation 1606/2002 through the special unification<br />
procedure. In the opinion of <strong>IMMOEAST</strong>, this does not represent any limitation of the compliance with IFRS that<br />
is required by IAS 1.14.<br />
1.3 Overview of applied standards and interpretations<br />
Given the large number of new standards and the generally permitted early application of these standards, the following<br />
table provides an overview of the regulations applied by <strong>IMMOEAST</strong> in preparing the consolidated financial<br />
statements as of 30 April 20<strong>07</strong>.<br />
Standard Application Standard Application Standard/Interpretation Application<br />
IFRS 1 n.a. IAS 21 (revised 2003) as of 2004/05 IAS 41 n.a.<br />
IAS 1 up to 2003/04 IAS 21 (revised 2005) as of <strong>2006</strong>/<strong>07</strong> SIC-7 to IAS 21 n.a.<br />
IAS 1 (revised 2003) as of 2004/05 IAS 22 **) up to 2003/04 SIC-10 to IAS 20 n.a.<br />
IAS 1, version IFRS 7 as of <strong>2006</strong>/<strong>07</strong> IAS 23 as of 2000/01 SIC-12 to IAS 27 n.a.<br />
IFRS 2 n.a. IAS 24 up to 2003/04 IFRIC adjustment to SIC-12 n.a.<br />
IAS 2 n.a. IAS 24 (revised 2003) as of 2004/05 SIC-13 to IAS 31 n.a.<br />
IAS 2 (revised 2003) as of 2004/05 IAS 26 n.a. SIC-15 to IAS 17 as of 2000/01<br />
IFRS 3 as of 2004/05 IAS 27 up to 2003/04 SIC-21 to IAS 12 n.a.<br />
IFRS 4 n.a. IAS 27 (revised 2003) as of 2004/05 SIC-25 to IAS 12 n.a.<br />
IFRS 5 as of 2005/06 IAS 28 up to 2003/04 SIC-27 to IAS 1/17/18 as of 2000/01<br />
IFRS 6 n.a. IAS 28 (revised 2003) as of 2004/05 SIC-29 to IAS 1 n.a.<br />
IFRS 7 as of <strong>2006</strong>/<strong>07</strong> IAS 29 n.a. SIC-31 to IAS 18 n.a.<br />
IFRS 8 as of <strong>2006</strong>/<strong>07</strong> IAS 30 n.a. SIC-32 to IAS 38 n.a.<br />
IAS 7 as of 2000/01 IAS 31 up to 2003/04 IFRIC 1 n.a.<br />
IAS 8 up to 2003/04 IAS 31 (revised 2003) as of 2004/05 IFRIC 2 n.a.<br />
IAS 8 (revised 2003) as of 2004/05 IAS 32 up to 2003/04 IFRIC 4 n.a.<br />
IAS 10 up to 2003/04 IAS 32 (revised 2003) as of 2004/05 IFRIC 5 n.a.<br />
IAS 10 (revised 2003) as of 2004/05 IAS 33 up to 2003/04 IFRIC 6 n.a.<br />
IAS 11 n.a. IAS 33 (revised 2003) as of 2004/05 IFRIC 7 n.a.<br />
IAS 12 as of 2000/01 IAS 34 n.a. IFRIC 8 n.a.<br />
IAS 14 as of 2000/01 IAS 35 n.a. IFRIC 9 n.a.<br />
IAS 15 *) n.a. IAS 36 up to 2003/04 IFRIC 10 n.a.<br />
IAS 16 up to 2004/05 IAS 36 (revised 2004) as of 2004/05 IFRIC 11 n.a.<br />
IAS 16 (revised 2003) as of 2005/06 IAS 37 as of 2000/01<br />
IAS 17 up to 2003/04 IAS 38 up to 2003/04<br />
IAS 17 (revised 2003) as of 2004/05 IAS 38 (revised 2004) as of 2004/05<br />
IAS 18 as of 2000/01 IAS 39 up to 2003/04<br />
IAS 19 as of 2000/01 IAS 39 (revised 2003) ***) as of 2004/05 *) IAS 15 was cancelled without replacement.<br />
IAS 20 as of 2000/01 IAS 40 as of 2000/01 **) IAS 22 was replaced by IFRS 3.<br />
IAS 21 up to 2003/04 IAS 40 (revised 2003) as of 2004/05<br />
***) in the <strong>2006</strong> version.<br />
n.a. = not applicable<br />
Notes<br />
<strong>Report</strong> by the Executive Board 117<br />
Highlights <strong>2006</strong>/<strong>07</strong><br />
Business Model and Strategy<br />
Portfolio Structure<br />
Corporate Governance and Outlook<br />
Property Portfolio<br />
Development of Business<br />
Consolidated Financial Statements<br />
Service and Glossary<br />
IAS 1.46(d). (e)<br />
IAS 1.14
118 <strong>IMMOEAST</strong> <strong>Annual</strong> <strong>Report</strong> <strong>2006</strong>/<strong>07</strong><br />
IFRS 7.43<br />
IFRS 7.1<br />
IFRS 8.1<br />
IFRS 3.4<br />
IFRS 3.3<br />
IFRS 3.1 in<br />
connection<br />
with IFRS<br />
3.14 & 3.16<br />
1.4 Early application of accounting standards<br />
IFRS 7 Financial Instruments: Disclosures<br />
IFRS 7 Financial Instruments: Disclosures was announced by the IASB on 18 August 2005 and adopted without<br />
change into European law by the EU Commission on 11 January <strong>2006</strong> through regulation (EG) Nr. 108/<strong>2006</strong> of the<br />
Commission of the European Union. The Basis for Conclusions and Guidance on Implementing do not form an integral<br />
component of IFRS 7 and were not adopted into European law at the EU level in connection with the endorsement<br />
process.<br />
IFRS 7 applies to annual periods beginning on or after 1 January 20<strong>07</strong>. However, earlier application is encouraged.<br />
This new standard is designed to provide disclosures in financial statements that enable users to evaluate the significance<br />
of financial instruments for the company’s financial position and performance as well as the nature and<br />
extent of risks arising from financial instruments to which the entity is exposed during the period and at the reporting<br />
date, and how management manages these risks. The provisions of IFRS 7 complement the principles for recognising,<br />
measuring and presenting financial assets and liabilities in IAS 32 Financial Instruments: Presentation and IAS 39<br />
Financial Instruments: Recognition and Measurement. IFRS 7 must be applied to all recognised and non-recognised<br />
financial instruments, with the exception of those items listed under IFRS 7.3.<br />
IFRS 8 Operating Segments<br />
The IASB issued IFRS 8 Operating Segments, which is part of a joint project with the US Financial Accounting Standards<br />
Board (FASB) to reduce the differences between IFRS and US-GAAP. IFRS 8 will replace IAS 14 and achieve<br />
convergence with the requirements of SFAS 131. IFRS 8 requires companies to provide financial and descriptive<br />
information on their reportable segments. This standard calls for the identification of operating segments based on<br />
the internal management focus of the company (management approach). In keeping with this approach, the presentation<br />
of the segments must reflect the same basis used for internal reporting. IFRS 8 applies to annual periods beginning<br />
on or after 1 January 2009. The early application of IFRS 8 to these consolidated financial statements would lead,<br />
above all, to additional disclosures in the notes and provide more detailed insight into the financial position and<br />
performance of the individual segments.<br />
IFRS 8 had not yet been adopted into the body of European Union law at the time these consolidated financial statements<br />
were prepared. Reservations were expressed by the European Financial <strong>Report</strong>ing Advisory Group (EFRAG) in<br />
connection with the reporting of internal financial information that is not based on IFRS data. Since all data published<br />
as part of segment reporting are based solely on IFRS and the definition of the segments meets the requirements of<br />
IAS 14, <strong>IMMOEAST</strong> assumes these notes converge with the requirements of both IFRS 8 and IAS 14.<br />
2. Basis of Consolidation<br />
2.1 Consolidation methods<br />
A business combination is the bringing together of separate entities or businesses into one reporting entity. IFRS 3<br />
applies to all business combinations, with the exception of companies under common control and business combinations<br />
involving mutual entities as well as business combinations based on contracts that do not include the exchange<br />
of ownership interests or which results in the formation of joint ventures.<br />
All business combinations that fall under the scope of application defined by IFRS 3 must be recorded using the<br />
purchase method of accounting. The application of the purchase method includes the identification of the acquirer,
the measurement of the cost of the business combination and the allocation of the cost of the business combination<br />
to the assets acquired and liabilities and contingent liabilities assumed on the acquisition date. The acquirer is the<br />
combining entity that obtains control of the other combining entities or businesses. This method calls for the elimination<br />
of the investment and equity at the acquisition date through the offset of the purchase price with the revalued<br />
proportional share of net assets in the acquired company. All identifiable assets, liabilities and contingent liabilities<br />
of the subsidiary are stated at their full fair value, independent of any minority interest. Major exceptions to the<br />
mandatory recognition of assets and liabilities at fair value include deferred tax assets for deferred tax liabilities as<br />
well as assets or groups of assets that fall under IFRS 5 Non-current assets held for sale and discontinued operations.<br />
Intangible assets must be shown separately from goodwill, if their fair value can be reliably determined and<br />
if they are identifiable. According to IFRS 3.46, this latter criterion is met when the assets are separable from the<br />
company or result from a contractual or other right. When the purchase method is applied, the acquirer is not permitted<br />
to create provisions for future losses or expected restructuring expenses that may result from the business<br />
combination.<br />
Goodwill is recognised by the acquirer as an asset on the acquisition date and initially measured as the excess of the<br />
cost of the business combination over the acquirer’s interest in the net fair value of the of the identifiable assets,<br />
liabilities and contingent liabilities of the acquired entity. If the acquirer’s interest in the fair value of acquired identifiable<br />
net assets exceeds the cost of the business combination, this difference – negative goodwill – is recognised<br />
immediately to profit or loss under other operating income after the reassessment of the remeasurement as required<br />
by IFRS 3.56 (a).<br />
In accordance with IFRS 3 in connection with IAS 36, capitalised goodwill is no longer amortised on a regular basis,<br />
but is tested for impairment each year or on an interim basis if there are signs of a loss in value. If the carrying value<br />
of a cash-generating unit (CGU) to which goodwill has been allocated should fall below its recoverable amount,<br />
goodwill is reduced by the amount of the difference through an impairment charge. Any remaining difference will be<br />
reflected in a proportional reduction of the carrying value of the other non-current assets.<br />
A business combination may involve more than one purchase transaction, e.g. when it occurs in stages by successive<br />
share purchases. In this case each transaction must be treated separately by the acquirer, whereby the cost of the<br />
transaction and fair value information at the date of each exchange transaction are used to determine the amount<br />
of any goodwill associated with that transaction. The shift between the previous minority interest and the offset of<br />
capital from a step acquisition is shown as a structural change on the statement of changes in equity. For business<br />
combinations that result in a proportional share of equity below 100%, the increase in minority interest is reported<br />
as an addition to the consolidation range on the statement of changes in equity. In accordance with the economic<br />
unity principle that is anchored in IAS 27.4 and IAS 1.68 (o), minority interests are presented as a separate position<br />
under equity.<br />
IFRS 3 and IAS 27 do not directly regulate the determination of indirect minority interests. In accordance with the<br />
economic unity principle, the consolidated financial statements of <strong>IMMOEAST</strong> include only indirect minority interests<br />
in the earned equity of consolidated subsidiaries. In keeping with the prevalent opinion expressed in accounting<br />
literature, indirect minority interests are treated in line with the economic unity principle and not taken into account<br />
in the consolidation, which is therefore based on the direct stake owned in the subsidiary. This leads to the determination<br />
of goodwill that is secured through cash outflows and meets the conceptual criteria for complete revaluation<br />
that are expressed in IFRS 3.<br />
The financial statements of all companies included in the consolidation are based on the same balance sheet date<br />
as the parent company. If the balance sheet dates are different, the relevant subsidiaries prepare interim financial<br />
Notes<br />
<strong>Report</strong> by the Executive Board 119<br />
Highlights <strong>2006</strong>/<strong>07</strong><br />
Business Model and Strategy<br />
Portfolio Structure<br />
Corporate Governance and Outlook<br />
Property Portfolio<br />
Development of Business<br />
Consolidated Financial Statements<br />
Service and Glossary<br />
IFRS 3.17<br />
IFRS 3.36 in<br />
connection<br />
with IFRS 3.37<br />
IFRS 3.37(c)<br />
IFRS 3.46<br />
IFRS 3.41<br />
(a), (b)<br />
IFRS 3.51 in<br />
connection<br />
with IFRS 3.56<br />
IFRS 3.54<br />
IFRS 3.58<br />
IAS 27.4 in<br />
connection<br />
with IAS 1.68<br />
(o) (o)<br />
IAS 27.26<br />
IAS 27.27
120 <strong>IMMOEAST</strong> <strong>Annual</strong> <strong>Report</strong> <strong>2006</strong>/<strong>07</strong><br />
IAS 27.28<br />
IAS 27.33<br />
IFRS 3.62 (a)<br />
IAS 27.24<br />
IAS 28.20 in<br />
connection<br />
with 28.25<br />
IAS 31.1<br />
IAS 31.3<br />
IAS 31.9<br />
IAS 31.10<br />
IAS 31.30 /<br />
IAS 31.38<br />
statements – whenever possible – as of the balance sheet date used by the parent company. In no case may the<br />
balance sheet dates of the parent company and subsidiary differ by more than three months, and adjustments must<br />
be made for any significant business transactions concluded during this period. In order to develop the consolidated<br />
financial statements, all necessary financial information from the subsidiaries must be prepared in accordance with<br />
IFRS. Therefore, uniform Group accounting and valuation methods must be applied to similar business events and<br />
transactions.<br />
Minority interests must be reported under equity on the consolidated balance sheet, but shown separately from<br />
the equity of the parent company. The share of consolidated profit due to minority interests must also be shown<br />
separately.<br />
Newly acquired companies are included in the consolidation as of their acquisition date. The conversion of the opening<br />
balance sheets of major newly acquired companies to IFRS is subject to an audit or review.<br />
Joint ventures are included at their proportionate share according to the same general principles described above.<br />
All receivables and liabilities, revenues, other income and expenses from the provision of goods and services between<br />
fully or proportionately consolidated companies are eliminated. Interim profits, which arise primarily from the transfer<br />
of stakes in other companies and properties between member companies of the group, are eliminated.<br />
For associated companies consolidated at equity, the difference resulting from the elimination of the investment and<br />
equity is determined according to the same general principles used for fully consolidated companies. The carrying<br />
values of assets and liabilities as well as the amount of revenues and expenses were determined in accordance with<br />
IAS 28.20 on a uniform basis as required by IFRS. For associated companies with a different balance sheet date,<br />
interim financial statements were prepared at a balance sheet date within three months from the balance sheet date<br />
used by <strong>IMMOEAST</strong> in accordance with IAS 28.25. Major transactions were reflected in a proportional adjustment of<br />
results included in the consolidated financial statements (also see point 4.4).<br />
2.2 Consolidation range<br />
IFRS follow a multi-level approach in the classification of the consolidation range. The assignment to a specific level<br />
is based on the Group’s influence on the company: the stronger the influence of the Group, the more extensive the<br />
inclusion in the consolidated financial statements.<br />
An overview of the <strong>IMMOEAST</strong> Group companies is presented at the end of the notes.<br />
2.2.1 Proportionate consolidation<br />
IAS 31 is applied to the recognition and measurement of all stakes in joint ventures and reporting on the assets,<br />
liabilities, income and expenses of joint ventures. A joint venture is a contractual agreement whereby two or more<br />
parties undertake an economic activity that is subject to contractually agreed joint control. The partner companies<br />
are the shareholders of a joint venture and participate in the joint management of the entity. The form of the contractual<br />
agreement is determined by the relevant legal regulations.<br />
IAS 31 allows for the use of the equity method or proportionate consolidation in preparing the consolidated financial<br />
statements. The selected method must then be applied throughout the Group. <strong>IMMOEAST</strong> considers the depiction of<br />
joint ventures through proportionate consolidation to be the more appropriate form of presentation because it makes<br />
the asset, financial and earnings position more easily understandable for the users of the financial statements.
Proportionate consolidation is a method of accounting whereby the Group’s share of the assets that are jointly controlled<br />
and the liabilities that are covered by joint responsibility is combined with similar items in the consolidated<br />
financial statements. The income statement of the joint venture is also included on a proportionate basis in the consolidated<br />
financial statements.<br />
In accordance with IAS 31, 89 companies are included in the consolidation using proportionate consolidation. Due to<br />
the conclusion of syndication agreements with other companies for the joint management of business in accordance<br />
with IAS 31.3 in connection with IAS 31.9, <strong>IMMOEAST</strong> does not exercise control over the following companies despite<br />
its majority holdings or manages these businesses jointly with other partners in spite of its minority interests:<br />
Segment Country Headquarters Company Stake<br />
CEE CZ Prague Centrum Olympia Olomuc a.s. 45.00%<br />
CEE CZ Prague MY BOX Uherske Hradiste s.r.o. 50.50%<br />
CEE CZ Prague Holtera Property a.s. 45.00%<br />
CEE CZ Prague MY BOX Strakonice s.r.o. 50.50%<br />
CEE CZ Znaim Nakupni Centrum Trebic s.r.o. 50.50%<br />
CEE CZ Znaim Nakupni Centrum AVENTIN Tabor s.r.o. 50.50%<br />
CEE CZ Prague Veronia Shelf s.r.o. 51.00%<br />
CEE CZ Prague MY BOX Kolin s.r.o. 50.50%<br />
CEE CZ Prague Diamant Real s.r.o. 51.00%<br />
CEE EST Tallinn OÜ Robbins 45.00%<br />
CEE H Budapest STOP.SHOP. TB Kft. 51.00%<br />
CEE H Budapest STOP.SHOP. Gyöngy Kft. 51.00%<br />
CEE H Budapest STOP.SHOP. BCS Kft. 51.00%<br />
CEE PL Warsaw ImmoPoland Residential I Sp. z o.o. 47.50%<br />
CEE PL Warsaw Equator Real Sp. z o.o. 51.00%<br />
CEE PL Warsaw Zenith Real Sp. z o.o. 51.00%<br />
CEE PL Warsaw Nimbus Real Sp. z o.o. 51.00%<br />
CEE PL Warsaw Cirrus Real Sp. z o.o. 51.00%<br />
CEE PL Katowice Silesia Residential Project Sp. z o.o. 70.00%<br />
CEE PL Warsaw Debowe Tarasy Sp. z o.o. 70.00%<br />
CEE PL Katowice Debowe Tarasy Sp. z o.o. II sp.k. 70.00%<br />
CEE PL Katowice Debowe Tarasy Sp. z o.o. III sp.k. 70.00%<br />
CEE PL Katowice Debowe Tarasy Sp. z o.o. IV sp.k. 70.00%<br />
CIS UA Kiev Alacor Construction LLC 41.00%<br />
CIS UA Kiev Alacor Scorta LLC 41.00%<br />
CIS UA Kiev Alacor City LLC 41.00%<br />
SEE RO Bucharest S.C. Meteo Business Park s.r.l. 89.00%<br />
SEE RO Bucharest S.C. Stupul de Albine s.r.l. 89.00%<br />
SEE RO Bucharest S.C. Union Investitii s.r.l. 25.00%<br />
Holding CY Nicosia Silesia Residential Holding Limited 70.00%<br />
Holding CY Nicosia Loberta Holdings Ltd. 51.00%<br />
Holding CY Nicosia Roches Ventures Ltd. 41.00%<br />
Holding D Munich Multi-ImmoEast Asset Management GmbH 45.00%<br />
Holding LU Luxembourg Multi-ImmoEast Central European Property Fund C.V. 45.00%<br />
Holding LU Luxembourg Multi-<strong>IMMOEAST</strong> Master Luxembourg Otarfi s.r.l. 45.00%<br />
Notes<br />
<strong>Report</strong> by the Executive Board 121<br />
Highlights <strong>2006</strong>/<strong>07</strong><br />
Business Model and Strategy<br />
Portfolio Structure<br />
Corporate Governance and Outlook<br />
Property Portfolio<br />
Development of Business<br />
Consolidated Financial Statements<br />
Service and Glossary<br />
IAS 31.33<br />
IAS31.3in<br />
connection<br />
connection<br />
with IAS 31.9
122 <strong>IMMOEAST</strong> <strong>Annual</strong> <strong>Report</strong> <strong>2006</strong>/<strong>07</strong><br />
IAS 28.11<br />
IAS 28.31<br />
IAS 28.33<br />
IAS 28.7<br />
The following tables show the pro rata values for companies that were included in the consolidated financial statements<br />
at their proportionate share:<br />
All amounts in TEUR 30 April 20<strong>07</strong> 30 April <strong>2006</strong><br />
Property 438,995.4 288,986.4<br />
Other non-current assets 9,935.0 5,976.3<br />
Current assets 48,467.7 24,785.6<br />
Non-current liabilities -253,653.4 -133,840.6<br />
Current liabilities -101,688.8 -81,155.9<br />
Proportional share of net assets 142,055.9 104,751.9<br />
All amounts in TEUR <strong>2006</strong>/<strong>07</strong> 2005/06<br />
Revenues 10,249.4 13,101.9<br />
Revaluation 104,214.0 40,114.3<br />
Operating profit (EBIT) 106,038.3 44,748.9<br />
Financial results -4,008.0 8,204.5<br />
Income taxes -22,781.4 -9,042.4<br />
Net profit for the period 79,248.9 43,911.0<br />
The above presentation includes effects from the consolidation of liabilities and the elimination of income and<br />
expenses only when they arose in the proportionately consolidated companies. Funds borrowed from or loaned to<br />
other Group companies were not eliminated.<br />
2.2.2 Equity method<br />
The equity method is used to record shares in associated companies. Under this method the proportionate share of<br />
changes in equity and the proportionate share of profit or loss recognised by the associated company are transferred to<br />
the consolidated financial statements, and thereby increase or decrease the carrying amount of the investment.<br />
The investment in an associated company is recognised at cost on the date of acquisition. The equity method is a<br />
procedure for the subsequent measurement of the investment. It is based on the same principles as full consolidation,<br />
however, the assets and liabilities of the associated company are not transferred to the consolidated financial statements,<br />
but only serve to determine the amount of goodwill. The difference between the revalued assets of the associated<br />
company and the cost of the investment represent goodwill. This goodwill forms a part of the carrying value of the<br />
investment.<br />
Investments in associated companies are tested for impairment in accordance with the requirements of IAS 39 concerning<br />
indications of impairment and the requirements of IAS 36 concerning the actual impairment test. Goodwill included<br />
in the carrying amount of an investment in an associated company is not tested separately for impairment.<br />
Two sub-groups and one company were included in the <strong>2006</strong>/<strong>07</strong> consolidated financial statements at equity.<br />
The requirement for application of the equity method is the existence of significant influence. This is usually evidenced<br />
by one or more of the following factors:<br />
• Representation of the investor on the board of directors and/or supervisory body or a similar governing body of the<br />
investee<br />
• Participation in policy-making processes<br />
• Material transactions between the investor and the investee<br />
• Interchange of managerial personnel or<br />
• Provision of essential technical information.
Potential voting rights are to be considered in determining whether the requirements for significant influence are met.<br />
The actual exercise of significant influence is not necessary. Significant influence as defined in IAS 28.6 is considered<br />
to exist when the stake owned in a company equals 20% or more of the voting power, but this presumption can be<br />
refuted. <strong>IMMOEAST</strong> holds stakes of more than 20% in the net assets of the following companies, which were not classified<br />
as associated companies:<br />
• Prime Property BG REIT, Bulgaria (42.23%)<br />
• FF&P Russia Real Estate Limited, Guernsey (25.8%)<br />
• Global Emerging Property Fund L.P., Jersey (25%)<br />
• FF&P Development Fund (32.895%)<br />
• Adama Holding Public Ltd. (25%)<br />
• Bluehouse Accession Property Ltd. (25%)<br />
• M.O.F. Immobilien AG (20%)<br />
M.O.F. Immobilien AG was reclassified from associated companies to financial instruments as defined in IAS 39 during<br />
<strong>2006</strong>/<strong>07</strong> because <strong>IMMOEAST</strong> no longer has significant influence over this company (also see point 4.5).<br />
The presumption of association is refuted by the absence of employees or corporate bodies of <strong>IMMOEAST</strong> on the managing<br />
bodies of the above companies as well as the quorum of shareholders that is required to pass resolutions. The<br />
financial statements of companies included at equity are generally prepared as of the same balance sheet date as the<br />
parent company. The preparation of these statements on a different balance sheet date and the inclusion of any adjustments<br />
for significant transactions is permitted when the balance sheet date used by the associated company varies by<br />
three months or less .<br />
The consolidated financial statements of the EPG Group and TriGránit Holding Ltd. have a balance sheet date of<br />
31 December <strong>2006</strong>. That means the three-month rule is not followed in these cases. However, non-compliance with this<br />
rule has no material effect on these consolidated financial statements.<br />
2.2.3 Full consolidation<br />
A subsidiary is an entity that is controlled by another entity (parent company). Subsidiaries are included in the consolidated<br />
financial statements through full consolidation. The control concept forms the basis for deciding when a<br />
company must be classified as a subsidiary. Control is understood to mean the power to govern the financial and<br />
operating policies of an entity so as to obtain benefits from its activities. The possibility of control is sufficient for<br />
this classification, while the actual exercise of control is less important. Direct or indirect control over more than 50%<br />
of the voting rights in an entity is considered to be a refutable presumption for the existence of control. Moreover,<br />
control is assumed to be irrefutable when the parent company:<br />
• directly or indirectly controls the majority of voting rights, including potential voting rights that can be exercised or<br />
converted as of the balance sheet date,<br />
• holds the power over more than one-half of voting rights by virtue of an agreement (e.g. syndication agreement)<br />
with other shareholders,<br />
• has the power to govern the financial and operating policies of the entity under a statute or an agreement,<br />
• has the power to appoint or dismiss the majority of the members to a governing body (board or directors, supervisory<br />
board) or to cast the majority of votes on a governing body.<br />
The inclusion of domestic and foreign subsidiaries in the consolidated financial statements is based on the economic<br />
unity concept. This concept requires the inclusion of all assets, liabilities, income and expenses attributable<br />
to subsidiaries in the consolidated financial statements – independent of the stake owned by the controlling parent<br />
company – in cases where control exists. Equity in the consolidated financial statements is separated into the por-<br />
Notes<br />
<strong>Report</strong> by the Executive Board 123<br />
Highlights <strong>2006</strong>/<strong>07</strong><br />
Business Model and Strategy<br />
Portfolio Structure<br />
Corporate Governance and Outlook<br />
Property Portfolio<br />
Development of Business<br />
Consolidated Financial Statements<br />
Service and Glossary<br />
IAS 28.9<br />
IAS 28.6<br />
IAS 28.24-25<br />
IAS 27.12<br />
IAS 27.4<br />
IFRS 3.19<br />
IAS 27.13
124 <strong>IMMOEAST</strong> <strong>Annual</strong> <strong>Report</strong> <strong>2006</strong>/<strong>07</strong><br />
IAS 27.33<br />
IAS 27.30<br />
tion attributable to shareholders of the parent company and the portion attributable to the minority shareholders of<br />
the subsidiaries. The same applies to the consolidated income statement: the income and expenses of the subsidiaries<br />
are consolidated in full, and profit is then separated into a portion attributable to the parent company and a portion<br />
attributable to the minority shareholders. All intragroup balances, transactions, income and expenses must be<br />
eliminated. Minority interests are presented separately in the consolidated balance sheet within equity, but shown<br />
separately from the equity of the parent company’s shareholders. Minority interests in the profit or loss of the group<br />
are also reported separately. In addition to <strong>IMMOEAST</strong>, these consolidated financial statements include 89 domestic<br />
and 119 foreign subsidiaries in which <strong>IMMOEAST</strong> directly or indirectly holds the majority of shareholder voting rights<br />
or can exercise legal or actual control.<br />
2.2.4 Deconsolidation<br />
When a subsidiary is sold, the assets and liabilities of this company are no longer included in the consolidated financial<br />
statements. The income and expenses of the deconsolidated subsidiary are included in the consolidated financial<br />
statements until the date on which control is lost, and the sold share of profit is treated as a reduction of the<br />
proceeds from the deconsolidation in order to avoid double-counting.<br />
The profits accumulated by the deconsolidated subsidiary during its membership in the group influence the proceeds<br />
from the deconsolidation because these profits were recognised in the consolidated financial statements during<br />
prior periods.<br />
In the deconsolidation of foreign subsidiaries, the proceeds from the deconsolidation are increased or decreased<br />
to reflect the cumulative amount of any exchange differences that were recognised in equity during the subsidiary’s<br />
membership in the group.<br />
2.2.5 Transition consolidation (step acquisitions)<br />
A business combination achieved in stages (transition consolidation or step acquisition) represents the successive<br />
purchase of shares in subsidiaries through various transactions until control over the company is reached. In accordance<br />
with IFRS 3.58, goodwill must be determined separately for each exchange transaction based on the relevant<br />
cost and revalued net assets on the respective transaction dates. The share of undisclosed reserves attributable to the<br />
previous investment is included under the revaluation reserve, which is to be treated as a revaluation reserve in accordance<br />
with IAS 16 independent of any other application of the revaluation model defined in IAS 16 by the group.<br />
When there is a changeover from proportionate to full consolidation, the income statement is included on a proportionate<br />
basis until control is obtained over the net assets of the company; after this point, the income statement is<br />
included in full. The share of profit attributable to the joint venture partner up to this point is eliminated as acquired<br />
capital during the consolidation.<br />
2.3. Development of the consolidation range<br />
The consolidation range changed during the reporting year as follows:<br />
Full Proportionate Equity<br />
Consolidation range consolidation consolidation method Total<br />
Balance on 30 April <strong>2006</strong> 97 53 4 154<br />
Newly consolidated 86 61 2 149<br />
Disposal -2 0 -1 -3<br />
Change in consolidation method 27 -25 -2 0<br />
Balance on 30 April 20<strong>07</strong> 208 89 3 300<br />
Thereof foreign companies 121 88 3 212
Notes<br />
<strong>IMMOEAST</strong> made the following acquisitions and founded the following companies during the reporting year:<br />
Type of<br />
Date of initial consolidation<br />
Segment Country Headquarters Company consolidation Stake method<br />
CEE CZ Prague MY BOX Strakonice s.r.o. 30.5.<strong>2006</strong> 50.50% Q<br />
CEE CZ Prague Aragonit s.r.o. 1.7.<strong>2006</strong> 100.00% V<br />
CEE CZ Znaim Nakupni Centrum Trebic s.r.o. 30.8.<strong>2006</strong> 50.50% Q<br />
CEE CZ Znaim Nakupni Centrum AVENTIN Tabor s.r.o. 18.9.<strong>2006</strong> 50.50% Q<br />
CEE CZ Prague Centrum Opatov a.s. 22.9.<strong>2006</strong> 100.00% V<br />
CEE CZ Prague Veronia Shelf s.r.o. 18.10.<strong>2006</strong> 51.00% Q<br />
CEE CZ Prague MY BOX Kolin s.r.o. 27.10.<strong>2006</strong> 50.50% Q<br />
CEE CZ Prague Diamant Real s.r.o. 31.10.<strong>2006</strong> 51.00% Q<br />
CEE CZ Prague WINNIPEGIA SHELF s.r.o. 13.11.<strong>2006</strong> 100.00% V<br />
CEE CZ Prague MY BOX Rakovnik s.r.o. 20.11.<strong>2006</strong> 50.00% Q<br />
CEE CZ Prague MY BOX Sokolov s.r.o. 20.11.<strong>2006</strong> 50.00% Q<br />
CEE CZ Prague MY BOX Hranice s.r.o. 20.11.<strong>2006</strong> 50.00% Q<br />
CEE CZ Prague BB C – Building A, k.s. 13.12.<strong>2006</strong> 100.00% V<br />
CEE CZ Prague BB C – Building B, k.s. 13.12.<strong>2006</strong> 100.00% V<br />
CEE CZ Prague BB C – Building C, k.s. 13.12.<strong>2006</strong> 100,00% V<br />
CEE CZ Prague MY BOX Pribram s.r.o. 15.12.<strong>2006</strong> 50.00% Q<br />
CEE CZ Prague MY BOX Breclav s.r.o. 12.2.20<strong>07</strong> 50.00% Q<br />
CEE CZ Prague MY BOX Jablonec nad Nisou s.r.o. 12.2.20<strong>07</strong> 50.00% Q<br />
CEE CZ Brno Centre Investments s.r.o. 28.2.20<strong>07</strong> 100.00% V<br />
CEE CZ Brno Brno Estates a.s. 28.2.20<strong>07</strong> 100.00% V<br />
CEE CZ Prague Delta Park a.s. 1.3.20<strong>07</strong> 100.00% V<br />
CEE H Budapest STOP.SHOP. TB Kft. 8.6.<strong>2006</strong> 51.00% Q<br />
CEE H Budapest STOP.SHOP. Gyöngy Kft. 8.6.<strong>2006</strong> 51.00% Q<br />
CEE H Budapest STOP.SHOP. BCS Kft. 8.6.<strong>2006</strong> 51.00% Q<br />
CEE H Budapest BEWO International Kft. 14.11.<strong>2006</strong> 50.00% Q<br />
CEE H Budapest Central Business Center Rt. 15.1.20<strong>07</strong> 100.00% V<br />
CEE PL Warsaw Salzburg Center Development S.A 31.7.<strong>2006</strong> 100.00% V<br />
CEE PL Warsaw Xantium Sp. z o.o. 4.8.<strong>2006</strong> 100.00% V<br />
CEE PL Warsaw Equator Real Sp. z o.o. 28.8.<strong>2006</strong> 51.00% Q<br />
CEE PL Warsaw Zenith Real Sp. z o.o. 28.8.<strong>2006</strong> 51.00% Q<br />
CEE PL Warsaw Nimbus Real Sp. z o.o. 28.8.<strong>2006</strong> 51.00% Q<br />
CEE PL Warsaw Cirrus Real Sp. z o.o. 28.8.<strong>2006</strong> 51.00% Q<br />
CEE PL Warsaw <strong>IMMOEAST</strong> Polonia Sp. z o.o. 6.9.<strong>2006</strong> 100.00% V<br />
CEE PL Katowice Silesia Residential Project Sp. z o.o. 9.10.<strong>2006</strong> 70.00% Q<br />
CEE PL Warsaw MBP I Sp. z o.o. 1.11.<strong>2006</strong> 50.00% Q<br />
CEE PL Warsaw MBP II Sp. z o.o. 1.11.<strong>2006</strong> 50.00% Q<br />
CEE PL Warsaw Debowe Tarasy Sp. z o.o. 21.11.<strong>2006</strong> 70.00% Q<br />
CEE PL Warsaw Fobos Investment Sp. z o.o. 14.12.<strong>2006</strong> 50.00% Q<br />
CEE PL Katowice Debowe Tarasy Sp. z o.o. II sp.k. 5.1.20<strong>07</strong> 70.00% Q<br />
CEE PL Katowice Debowe Tarasy Sp. z o.o. III sp.k. 5.1.20<strong>07</strong> 70.00% Q<br />
CEE PL Katowice Debowe Tarasy Sp. z o.o. IV sp.k. 5.1.20<strong>07</strong> 70.00% Q<br />
CEE PL Warsaw Passat Real Sp. z o.o. 27.3.20<strong>07</strong> 100.00% V<br />
CEE SK Bratislava Immoeast Dunaj s.r.o. 14.6.<strong>2006</strong> 100.00% V<br />
CEE SK Bratislava TriGránit Centrum a.s. 19.6.<strong>2006</strong> 25.00% E<br />
CEE SK Bratislava SCT s.r.o. 21.12.<strong>2006</strong> 100.00% V<br />
CEE SK Bratislava STOP.SHOP. Lucenec s.r.o. 19.2.20<strong>07</strong> 50.00% Q<br />
CEE SK Bratislava STOP.SHOP. Ruzomberok s.r.o. 19.2.20<strong>07</strong> 50.00% Q<br />
<strong>Report</strong> by the Executive Board 125<br />
Highlights <strong>2006</strong>/<strong>07</strong><br />
Business Model and Strategy<br />
Portfolio Structure<br />
Corporate Governance and Outlook<br />
Property Portfolio<br />
Development of Business<br />
Consolidated Financial Statements<br />
Service and Glossary
126 <strong>IMMOEAST</strong> <strong>Annual</strong> <strong>Report</strong> <strong>2006</strong>/<strong>07</strong><br />
Type of<br />
Date of initial consolidation<br />
Segment Country Headquarters Company consolidation Stake method<br />
CEE SK Bratislava STOP.SHOP. Zvolen s.r.o. 19.2.20<strong>07</strong> 50.00% Q<br />
CEE SK Bratislava SCP s.r.o. 19.3.20<strong>07</strong> 50.00% Q<br />
CIS CY Nicosia Wakelin Promotions Limited 21.6.<strong>2006</strong> 100.00% V<br />
CIS RU Moscow Krona Design LLC 21.6.<strong>2006</strong> 100.00% V<br />
CIS RU Moscow OAO Kashirskij Dvor-Severyanin 30.10.<strong>2006</strong> 50.00% Q<br />
CIS RU Moscow OOO Torgoviy Dom Na Khodinke 30.11.<strong>2006</strong> 100.00% V<br />
CIS UA Kiev Alacor Construction LLC 10.1.20<strong>07</strong> 41.00% Q<br />
CIS UA Kiev Alacor Scorta LLC 10.1.20<strong>07</strong> 41.00% Q<br />
CIS UA Kiev Alacor City LLC 10.1.20<strong>07</strong> 41.00% Q<br />
SEE BG Sofia Koral Residence EAD 23.6.<strong>2006</strong> 100.00% V<br />
SEE BG Sofia Business Park West-Sofia EAD 12.12.<strong>2006</strong> 100.00% V<br />
SEE BIH Banjaluka BEWO d.o.o. Banja Luka 5.3.20<strong>07</strong> 50.00% Q<br />
SEE CRO Zagreb Grand Zagreb d.o.o. 30.11.<strong>2006</strong> 80.00% V<br />
SEE CRO Zagreb Grand Centar d.o.o. 30.11.<strong>2006</strong> 80.00% V<br />
SEE RO Bucharest S.C. Almera New Capital s.r.l. 13.7.<strong>2006</strong> 50.00% Q<br />
SEE RO Bucharest S.C. Meteo Business Park s.r.l. 27.7.<strong>2006</strong> 89.00% Q<br />
SEE RO Bucharest S.C. Stupul de Albine s.r.l. 27.7.<strong>2006</strong> 89.00% Q<br />
SEE RO Bucharest Klyos Media s.r.l. 4.8.<strong>2006</strong> 90.00% V<br />
SEE RO Bucharest SC EFG Urban Achizitii s.r.l. 14.12.<strong>2006</strong> 89.00% V<br />
SEE RO Cluj SBACARO s.r.l. 15.12.<strong>2006</strong> 50.00% Q<br />
SEE RO Ilfov Logistic Contractor s.r.l. 18.12.<strong>2006</strong> 100.00% V<br />
SEE RO Cluj FMZ TM s.r.l. 22.12.<strong>2006</strong> 50.00% Q<br />
SEE RO Bucharest S.C. Arbor Corporation s.r.l. 29.1.20<strong>07</strong> 90.00% V<br />
SEE RO Bucharest S.C. IE Baneasa Project s.r.l. 1.2.20<strong>07</strong> 100.00% V<br />
SEE RO Bucharest Eye Shop Targu Jiu s.r.l. 19.2.20<strong>07</strong> 50.00% Q<br />
SEE RO Bucharest Log Center Ploiesti s.r.l. 19.2.20<strong>07</strong> 50.00% Q<br />
SEE RO Bucharest Log Center Brasov s.r.l. 19.2.20<strong>07</strong> 50.00% Q<br />
SEE RO Bucharest <strong>IMMOEAST</strong> Iride IV Project s.r.l. 1.3.20<strong>07</strong> 100.00% V<br />
SEE RO Bucharest S.C. Union Investitii S.r.l. 7.3.20<strong>07</strong> 25.00% Q<br />
SEE RO Bucharest S.C. Valero Invest s.r.l. 20.3.20<strong>07</strong> 100.00% V<br />
SEE RO Bucharest Log Center Iasi s.r.l. 29.3.20<strong>07</strong> 50.00% Q<br />
SEE RO Bucharest Eye Shop Hunedoara s.r.l. 29.3.20<strong>07</strong> 50.00% Q<br />
SEE RO Bucharest S.C. Baneasa 6981 s.r.l. 5.4.20<strong>07</strong> 100.00% V<br />
SEE SLO Ljubljana Alpha real d.o.o. 30.9.<strong>2006</strong> 100.00% V<br />
SEE SLO Ljubljana Beta real d.o.o. 30.9.<strong>2006</strong> 100.00% V<br />
SEE SRB Belgrade OCEAN ATLANTIC DORCOL DOO 24.8.<strong>2006</strong> 80.00% V<br />
SEE SRB Belgrade Bewo International d.o.o. Beograd 13.4.20<strong>07</strong> 50.00% Q<br />
Holding A Vienna <strong>IMMOEAST</strong> Projekt Tredecimus Holding GmbH 21.6.<strong>2006</strong> 100.00% V<br />
Holding A Vienna <strong>IMMOEAST</strong> Projekt Quindecimus Holding GmbH 21.6.<strong>2006</strong> 100.00% V<br />
Holding A Vienna <strong>IMMOEAST</strong> Projekt Septendecimus Holding GmbH 21.6.<strong>2006</strong> 100.00% V<br />
Holding A Vienna <strong>IMMOEAST</strong> Projekt Quadragesimus Holding GmbH 21.6.<strong>2006</strong> 100.00% V<br />
Holding A Vienna <strong>IMMOEAST</strong> Projekt Vicesimus Holding GmbH 21.6.<strong>2006</strong> 100.00% V<br />
Holding A Vienna <strong>IMMOEAST</strong> Projekt Sexagesimus Holding GmbH 21.6.<strong>2006</strong> 100.00% V<br />
Holding A Vienna <strong>IMMOEAST</strong> Projekt Octogesimus Holding GmbH 21.6.<strong>2006</strong> 100.00% V<br />
Holding A Vienna <strong>IMMOEAST</strong> Projekt Nonagesimus Holding GmbH 21.6.<strong>2006</strong> 100.00% V<br />
Holding A Vienna <strong>IMMOEAST</strong> Projekt Centesimus Holding GmbH 21.6.<strong>2006</strong> 100.00% V<br />
Holding A Vienna <strong>IMMOEAST</strong> Projekt Babekan Holding GmbH 1.8.<strong>2006</strong> 100.00% V<br />
Holding A Vienna <strong>IMMOEAST</strong> Projekt Despina Holding GmbH 1.8.<strong>2006</strong> 100.00% V<br />
Holding A Vienna <strong>IMMOEAST</strong> Projekt Curzio Holding GmbH 1.8.<strong>2006</strong> 100.00% V<br />
Holding A Vienna <strong>IMMOEAST</strong> Projekt Almaria Holding GmbH 1.8.<strong>2006</strong> 100.00% V<br />
Holding A Vienna <strong>IMMOEAST</strong> Projekt Sarastro Holding GmbH 1.8.<strong>2006</strong> 100.00% V
Holding A Vienna <strong>IMMOEAST</strong> Projekt Barbarina Holding GmbH 1.8.<strong>2006</strong> 100.00% V<br />
Holding A Vienna <strong>IMMOEAST</strong> Projekt Cherubino Holding GmbH 1.8.<strong>2006</strong> 100.00% V<br />
Holding A Vienna <strong>IMMOEAST</strong> Projekt Marcellina Holding GmbH 1.8.<strong>2006</strong> 100.00% V<br />
Holding A Vienna <strong>IMMOEAST</strong> Projekt Cimarosa Holding GmbH 1.8.<strong>2006</strong> 100.00% V<br />
Holding A Vienna <strong>IMMOEAST</strong> Projekt Fenena Holding GmbH 1.8.<strong>2006</strong> 100.00% V<br />
Holding A Vienna <strong>IMMOEAST</strong> Projekt Almansor Holding GmbH 1.8.<strong>2006</strong> 100.00% V<br />
Holding A Vienna <strong>IMMOEAST</strong> Projekt Roschana Holding GmbH 1.8.<strong>2006</strong> 100.00% V<br />
Holding A Vienna <strong>IMMOEAST</strong> Projekt Cinna Holding GmbH 1.8.<strong>2006</strong> 100.00% V<br />
Holding A Vienna <strong>IMMOEAST</strong> Projekt Annius Holding GmbH 1.8.<strong>2006</strong> 100.00% V<br />
Holding A Vienna <strong>IMMOEAST</strong> Projekt Semos Holding GmbH 1.8.<strong>2006</strong> 100.00% V<br />
Holding A Vienna <strong>IMMOEAST</strong> Projekt Titurel Holding GmbH 1.8.<strong>2006</strong> 100.00% V<br />
Holding A Vienna <strong>IMMOEAST</strong> Projekt Radames Holding GmbH 1.8.<strong>2006</strong> 100.00% V<br />
Holding A Vienna <strong>IMMOEAST</strong> Projekt Montano Holding GmbH 1.8.<strong>2006</strong> 100.00% V<br />
Holding A Vienna <strong>IMMOEAST</strong> Projekt Amfortas Holding GmbH 1.8.<strong>2006</strong> 100.00% V<br />
Holding A Vienna <strong>IMMOEAST</strong> Projekt Abdallo Holding GmbH 1.8.<strong>2006</strong> 100.00% V<br />
Holding A Vienna <strong>IMMOEAST</strong> Projekt Rezia Holding GmbH 1.8.<strong>2006</strong> 100.00% V<br />
Holding A Vienna <strong>IMMOEAST</strong> Projekt Hüon Holding GmbH 1.8.<strong>2006</strong> 100.00% V<br />
Holding A Vienna <strong>IMMOEAST</strong> Projekt Titania Holding GmbH 1.8.<strong>2006</strong> 100.00% V<br />
Holding A Vienna <strong>IMMOEAST</strong> Projekt Andromache Holding GmbH 1.8.<strong>2006</strong> 100.00% V<br />
Holding A Vienna <strong>IMMOEAST</strong> Projekt Polyxene Holding GmbH 1.8.<strong>2006</strong> 100.00% V<br />
Holding A Vienna <strong>IMMOEAST</strong> Projekt Hylas Holding GmbH 1.8.<strong>2006</strong> 100.00% V<br />
Holding A Vienna <strong>IMMOEAST</strong> Projekt Hekuba Holding GmbH 1.8.<strong>2006</strong> 100.00% V<br />
Holding A Vienna <strong>IMMOEAST</strong> Projekt Pantheus Holding GmbH 1.8.<strong>2006</strong> 100.00% V<br />
Holding A Vienna <strong>IMMOEAST</strong> Projekt Chorebe Holding GmbH 1.8.<strong>2006</strong> 100.00% V<br />
Holding A Vienna <strong>IMMOEAST</strong> Projekt Narbal Holding GmbH 1.8.<strong>2006</strong> 100.00% V<br />
Holding A Vienna <strong>IMMOEAST</strong> Projekt Moskau Holding GmbH 7.9.<strong>2006</strong> 100.00% V<br />
Holding CY Nicosia TriGránit Holding 31.7.<strong>2006</strong> 25.00% E<br />
Holding CY Nicosia Silesia Residential Holding Limited 9.10.<strong>2006</strong> 70.00% Q<br />
Holding CY Nicosia Gangaw Investments Limited 30.10.<strong>2006</strong> 50.00% Q<br />
Holding CY Limassol Trevima Ltd. 30.11.<strong>2006</strong> 100.00% V<br />
Holding CY Nicosia S+B CEE BETA CYPRUS LIMITED 29.12.<strong>2006</strong> 50.00% Q<br />
Holding CY Nicosia S+B CEE GAMMA CYPRUS LIMITED 29.12.<strong>2006</strong> 50.00% Q<br />
Holding CY Nicosia S+B CEE DELTA CYPRUS LIMITED 29.12.<strong>2006</strong> 50.00% Q<br />
Holding CY Nicosia Loberta Holdings Ltd. 10.1.20<strong>07</strong> 51.00% Q<br />
Holding CY Nicosia Roches Ventures Ltd. 10.1.20<strong>07</strong> 41.00% Q<br />
Holding CY Nicosia Lasuvu Consultants Ltd. 6.3.20<strong>07</strong> 100.00% V<br />
Holding CY Nicosia S+B CEE ZETA CYPRUS LIMITED 18.4.20<strong>07</strong> 50.00% Q<br />
Holding CY Nicosia S+B CEE EPSILON CYPRUS LIMITED 20.4.20<strong>07</strong> 50.00% Q<br />
Holding CY Nicosia S+B CEE ETA CYPRUS LIMITED 20.4.20<strong>07</strong> 50.00% Q<br />
Holding LU Luxembourg HEPP III Luxembourg MBP SARL 1.11.<strong>2006</strong> 50.00% Q<br />
Holding LU Luxembourg Immoeast Luxembourg 1 SARL 22.3.20<strong>07</strong> 100.00% V<br />
Holding LU Luxembourg Immoeast Luxembourg 2 SARL 22.3.20<strong>07</strong> 100.00% V<br />
Holding LU Luxembourg Hekuba SARL 28.3.20<strong>07</strong> 100.00% V<br />
Holding M Floriana Blue Danube Holding Ltd. 12.12.<strong>2006</strong> 100.00% V<br />
Holding NL Amsterdam <strong>IMMOEAST</strong> Despina III B.V. 9.10.<strong>2006</strong> 100.00% V<br />
Holding NL Amsterdam <strong>IMMOEAST</strong> Despina II B.V. 9.10.<strong>2006</strong> 100.00% V<br />
Holding NL Amsterdam <strong>IMMOEAST</strong> Despina V B.V. 9.10.<strong>2006</strong> 100.00% V<br />
Holding NL Amsterdam <strong>IMMOEAST</strong> Despina IV B.V. 9.10.<strong>2006</strong> 100.00% V<br />
Holding NL Amsterdam <strong>IMMOEAST</strong> Despina I B.V. 9.10.<strong>2006</strong> 100.00% V<br />
Holding NL Amsterdam Gordon Invest Netherlands B.V. 22.2.20<strong>07</strong> 100.00% V<br />
Holding SWE Stockholm HEPP III Sweden Finance AB 1.11.<strong>2006</strong> 50.00% Q<br />
V = Full consolidation. Q = Proprtionate consolidation. E = Equity method<br />
Notes<br />
Type of<br />
Date of initial consolidation<br />
Segment Country Headquarters Company consolidation Stake method<br />
<strong>Report</strong> by the Executive Board 127<br />
Highlights <strong>2006</strong>/<strong>07</strong><br />
Business Model and Strategy<br />
Portfolio Structure<br />
Corporate Governance and Outlook<br />
Property Portfolio<br />
Development of Business<br />
Consolidated Financial Statements<br />
Service and Glossary
128 <strong>IMMOEAST</strong> <strong>Annual</strong> <strong>Report</strong> <strong>2006</strong>/<strong>07</strong><br />
2.3.1. Segment Central and Eastern Europe (CEE)<br />
During the first quarter of <strong>2006</strong>/<strong>07</strong> <strong>IMMOEAST</strong> acquired a 25% stake in the TriGránit Group, the leading property<br />
developer in Central and Eastern Europe, through TriGránit Holding Limited. This investment gives <strong>IMMOEAST</strong> a holding<br />
in the TriGránit portfolio as well as pre-emptive rights to all TriGránit projects at market prices.<br />
2.3.1.1. Regional subsegment Poland<br />
2.3.1.1.1. Salzburg Center Development S.A.<br />
<strong>IMMOEAST</strong> acquired 100% of the shares in the Polish Salzburg Center Development S.A. as of 31 July <strong>2006</strong>. This<br />
company owns a noffice building on the southwest border of the so-called “Central Business District” in Warsaw.<br />
The following table shows the acquired assets and liabilities at fair value as well as the consolidated proportional<br />
share of net assets at the individual company level as of the balance sheet date and the income statement of the<br />
company for the period from the acquisition date to the balance sheet date, which is included in the consolidated<br />
financial statements:<br />
Segment CEE All amounts in TEUR 30 April 20<strong>07</strong><br />
Location of property Poland Property 34,606.0<br />
Company Salzburg Center Development S.A. Other non-current assets 190.5<br />
Date of initial consolidation 31 July <strong>2006</strong><br />
Current assets 2,659.1<br />
All amounts in TEUR<br />
Cash and cash equivalents<br />
Receivables and other assets<br />
1<strong>07</strong>.1<br />
2,585.7<br />
Non-current liabilities<br />
Current liabilities<br />
Proportional share of net assets<br />
-3,821.8<br />
-106.9<br />
33,526.9<br />
Deferred tax assets 64.1<br />
All amounts in TEUR <strong>2006</strong>/<strong>07</strong><br />
Property 20,824.8<br />
Revenues 6.8<br />
Trade accounts payable -912.7<br />
Revaluation 13,312.5<br />
Other liabilities -16,786.4<br />
Operating profit (EBIT) 17,720.3<br />
Deferred tax liabilities -1,174.0<br />
Financial results 108.9<br />
Currency translation adjustment 7.5<br />
Income taxes -2,477.5<br />
Acquired net assets 4,716.1<br />
Net profit for the period 15,351.7<br />
(Negative) goodwill -4,979.1<br />
Purchase price paid in cash -263.0<br />
Less cash and cash equivalents acquired -1<strong>07</strong>.1<br />
Net purchase price for property company -370.2<br />
2.3.1.1.2 Xantium Sp.z o.o.<br />
During the second quarter of <strong>2006</strong>/<strong>07</strong> <strong>IMMOEAST</strong> acquired 100% of the shares in the Polish Xantium Sp.z o.o., which<br />
purchased the Brama Zachodnia office building through an asset deal. The project building is situated near the construction<br />
site of the Equator Office in the Jerozolimskie Business Corridor, the most dynamic office district in Warsaw.<br />
A number of shopping centres (Reduta, Blue City) are also located nearby. Brama Zachodnia is a modern 14-storey<br />
office complex that includes offices and a conference room as well as a restaurant and building services rooms. The<br />
object is fully let, primarily to well-known international corporations such as Ericsson.
The following table shows the consolidated proportional share of net assets at the individual company level as of the<br />
balance sheet date and the income statement of the company for the period from the acquisition date to the balance<br />
sheet date, which is included in the consolidated financial statements:<br />
Segment CEE<br />
Location of property Poland<br />
Company Xantium Sp. z o.o.<br />
Date of initial consolidation 4.8.<strong>2006</strong><br />
All amounts in TEUR 30 April 20<strong>07</strong><br />
Property 81,555.9<br />
Other non-current assets 586.6<br />
Current assets 20,437.7<br />
Non-current liabilities -957.2<br />
Current liabilities -380.6<br />
Proportional share of net assets 101,242.4<br />
All amounts in TEUR <strong>2006</strong>/<strong>07</strong><br />
Revenues 2,993.8<br />
Revaluation 719.8<br />
Operating profit (EBIT) 2,751.1<br />
Financial results -1,374.0<br />
Income taxes -327.8<br />
Net profit for the period 1,049.4<br />
2.3.1.1.3 Equator Real Sp. z o.o., Zenith Real Sp. z o.o., Nimbus Real Sp. z o.o. and Cirrus Real Sp. z o.o.<br />
A 51% stake was acquired in each of four Polish companies as of 28 August <strong>2006</strong>: Equator Real Sp.z o.o., Zenith Real<br />
Sp. z o.o., Nimbus Real Sp. z o.o. and Cirrus Real Sp.z o.o. This project involves the construction of four office buildings<br />
in the most dynamic commercial district of the Polish capital. It will be managed by a joint venture that includes<br />
a well-known international property developer with significant experience in Warsaw.<br />
The following table shows the acquired assets and liabilities at fair value as well as the consolidated proportional<br />
share of net assets at the individual company level as of the balance sheet date and the income statements of the<br />
companies for the period from the acquisition date to the balance sheet date, which are included in the consolidated<br />
financial statements:<br />
Segment CEE<br />
Location of property Poland<br />
Equator Real Zenith Real. Nimbus Real Cirrus Real<br />
Company Sp. z o.o. Sp. z o.o Sp. z o.o Sp. z o.o<br />
Date of initial consolidation 28.8.<strong>2006</strong> 28.8.<strong>2006</strong> 28.8.<strong>2006</strong> 28.8.<strong>2006</strong><br />
All amounts in TEUR<br />
Cash and cash equivalents 7.7 2.5 6.3 6.3<br />
Receivables and other assets 28.5 16.3 13.8 13.8<br />
Deferred tax assets 1.6 0.0 0.0 0.0<br />
Property 1,048.5 1,048.5 1,048.5 1,048.5<br />
Financial liabilities -931.0 -639.9 -6<strong>07</strong>.2 -610.6<br />
Trade accounts payable -18.1 -19.9 -17.5 -17.8<br />
Other liabilities -133.4 -134.7 -104.8 -105.2<br />
Deferred tax liabilities -43.8 -99.4 -106.0 -105.2<br />
Currency translation adjustment -59.7 -56.3 -56.2 -56.2<br />
Acquired net assets -99.6 117.1 177.0 173.6<br />
(Negative) goodwill 2,234.8 1,899.2 1,833.0 1,836.3<br />
Purchase price paid in cash 2,135.2 2,016.3 2,009.9 2,009.9<br />
Less cash and cash equivalents acquired -7.7 -2.5 -6.3 -6.3<br />
Net purchase price for property company 2,127.4 2,013.9 2,003.6 2,003.6<br />
Notes<br />
<strong>Report</strong> by the Executive Board 129<br />
Highlights <strong>2006</strong>/<strong>07</strong><br />
Business Model and Strategy<br />
Portfolio Structure<br />
Corporate Governance and Outlook<br />
Property Portfolio<br />
Development of Business<br />
Consolidated Financial Statements<br />
Service and Glossary
130 <strong>IMMOEAST</strong> <strong>Annual</strong> <strong>Report</strong> <strong>2006</strong>/<strong>07</strong><br />
Segment CEE<br />
Location of property Poland<br />
Equator Real Zenith Real. Nimbus Real Cirrus Real<br />
Company Sp. z o.o. Sp. z o.o Sp. z o.o Sp. z o.o<br />
Date of initial consolidation 28.8.<strong>2006</strong> 28.8.<strong>2006</strong> 28.8.<strong>2006</strong> 28.8.<strong>2006</strong><br />
All amounts in TEUR 30 April 20<strong>07</strong><br />
Property 4,311.8 3,451.4 6,251.5 3,321.1<br />
Other non-current assets 357.5 573.0 1,112.3 552.9<br />
Current assets 399.9 33.6 36.1 35.8<br />
Non-current liabilities -3,286.2 -1,273.6 -1,774.6 -1,220.3<br />
Current liabilities -22.8 -2.8 -3.0 -2.7<br />
Proportional share of net assets 1,760.3 2,781.6 5,622.3 2,686.8<br />
All amounts in TEUR <strong>2006</strong>/<strong>07</strong><br />
Revenues 0.0 0.0 0.0 0.0<br />
Revaluation 1,574.0 2,360.6 5,126.5 2,232.0<br />
Operating profit (EBIT) -370.0 1,003.9 4,369.7 921.3<br />
Financial results 83.2 -23.1 -21.7 -21.5<br />
Income taxes -301.3 -439.6 -964.2 -416.2<br />
Net profit for the period -588.2 541.2 3,383.8 483.7<br />
2.3.1.1.4 Silesia Residential Holding Limited<br />
As of 9 October <strong>2006</strong> <strong>IMMOEAST</strong> purchased a 70% stake in the Cypriote Silesia Residential Holding Limited and,<br />
through the transaction, also acquired a 70% stake in this company’s Polish subsidiary Silesia Residential Sp.z o.o.<br />
The Debowe Tarasy – Silesia City Center Residential development project involves the construction of 980 apartments<br />
in four phases. The site has optimal transport connections and a good infrastructure, which also includes a<br />
recreation area with sports facilities north of the project location. Construction will take 13 months.<br />
The following table shows the acquired assets and liabilities at fair value as well as the consolidated proportional<br />
share of net assets at the individual company level as of the balance sheet date and the income statements of the<br />
companies for the period from the acquisition date to the balance sheet date, which are included in the consolidated<br />
financial statements:
Segment CEE<br />
Location of property Poland<br />
Silesia Residential Silesia Residential Debowe Tarasy Debowe Tarasy Debowe Tarasy Debowe Tarasy<br />
Company Holding Limited Project Sp. z o.o. Sp. z o.o. Sp. z o.o. II sp.k. Sp. z o.o. III sp.k. Sp. z o.o. IV sp.k.<br />
Date of initial consolidation 9.10.<strong>2006</strong> 9.10.<strong>2006</strong> 21.11.<strong>2006</strong> 5.1.20<strong>07</strong> 5.1.20<strong>07</strong> 5.1.20<strong>07</strong><br />
All amounts in TEUR<br />
Cash and cash equivalents 0.0 236.5 0.0 0.0 0.0 0.0<br />
Financial instruments 1,668.1 0.0 0.0 0.0 0.0 0.0<br />
Receivables and other assets 1.2 5,990.3 0.0 0.0 0.0 0.0<br />
Deferred tax assets 0.0 35.7 0.0 0.0 0.0 0.0<br />
Financial liabilities 0.0 -934.0 0.0 0.0 0.0 0.0<br />
Trade accounts payable 0.0 -666.8 0.0 0.0 0.0 0.0<br />
Other liabilities -53.2 -223.4 0.0 0.0 0.0 0.0<br />
Provisions 0.0 -3.3 0.0 0.0 0.0 0.0<br />
Deferred tax liabilities 0.0 -547.7 0.0 0.0 0.0 0.0<br />
Currency translation adjustment 25.4 -109.2 0.3 0.0 0.0 0.0<br />
Acquired net assets 1,641.5 3,778.2 0.3 0.0 0.0 0.0<br />
(Negative) goodwill 1,905.3 1.8 0.0 0.0 0.0 0.0<br />
Purchase price paid in cash 3,546.8 3,780.0 0.3 0.0 0.0 0.0<br />
Less cash and cash equivalents acquired 0.0 -236.5 0.0 0.0 0.0 0.0<br />
Net purchase price for project company 3,546.8 4,561.2 0.3 0.0 0.0 0.0<br />
All amounts in TEUR<br />
Property 0.0 0.0 0.0 0.0 0.0 0.0<br />
Other non-current assets 1,894.5 86.6 0.5 5.4 0.3 0.3<br />
Current assets 26.1 11,932.0 13.6 1,409.0 388.0 384.0<br />
Non-current liabilities -24.9 -3,062.2 -7.8 -677.7 0.0 0.0<br />
Current liabilities 0.0 -6,573.5 -3.5 -183.9 -1.8 -1.8<br />
Proportional share of net assets 1,895.8 2,382.9 2.9 552.8 386.6 382.6<br />
All amounts in TEUR<br />
Revenues 0.0 818.2 0.0 0.0 0.0 0.0<br />
Revaluation 0.0 0.0 0.0 0.0 0.0 0.0<br />
Operating profit (EBIT) -4.0 -291.9 -3.4 -28.2 -1.7 -2.6<br />
Financial results -1.6 43.4 0.0 -0.2 0.0 0.0<br />
Income taxes 0.0 45.2 0.5 5.3 0.3 0.3<br />
Net profit for the period -5.6 -203.3 -2.9 -23.1 -1.4 -2.3<br />
2.3.1.1.5 MBP I Sp. z o.o. and MBP II Sp. z o.o.<br />
During the third quarter of <strong>2006</strong>/<strong>07</strong> <strong>IMMOEAST</strong> completed its largest investment in Poland to date in the form of a<br />
joint investment with Heitman European Property Partners. The acquisition of 50% stakes in the Polish MBP I Sp. z<br />
o.o. and MBP II Sp. z o.o. transferred the Mokotow Business Park to the Company’s portfolio. The Mokotow Business<br />
Park comprises nine office towers and is one of the most successful office projects in Warsaw.<br />
Notes<br />
<strong>Report</strong> by the Executive Board 131<br />
Highlights <strong>2006</strong>/<strong>07</strong><br />
Business Model and Strategy<br />
Portfolio Structure<br />
Corporate Governance and Outlook<br />
Property Portfolio<br />
Development of Business<br />
Consolidated Financial Statements<br />
Service and Glossary
132 <strong>IMMOEAST</strong> <strong>Annual</strong> <strong>Report</strong> <strong>2006</strong>/<strong>07</strong><br />
The following table shows the consolidated proportional share of net assets at the individual company level as of the<br />
balance sheet date and the income statement of the company for the period from the acquisition date to the balance<br />
sheet date, which is included in the consolidated financial statements:<br />
Segment CEE All amounts in TEUR <strong>2006</strong>/<strong>07</strong><br />
Location of property Poland Revenues 4,173.2 1.5<br />
Company MBP I Sp. z o.o. MBP II Sp. z o.o. Revaluation 16,837.8 -981.8<br />
Date of initial consolidation 1.11.<strong>2006</strong> 1.11.<strong>2006</strong><br />
Operating profit (EBIT) 19,054.6 -1,0<strong>07</strong>.8<br />
All amounts in TEUR<br />
Property<br />
Other non-current assets<br />
127,942.0<br />
1,425.6<br />
30 April 20<strong>07</strong><br />
0.0<br />
198.8<br />
Financial results<br />
Income taxes<br />
Net profit for the period<br />
-958.4<br />
-3,557.9<br />
14,538.2<br />
-63.1<br />
196.4<br />
-874.5<br />
Current assets 3,992.6 976.7<br />
Non-current liabilities -74,892.0 0.0<br />
Current liabilities -1,292.9 -1.3<br />
Proportional share of net assets 57,175.3 1,174.2<br />
2.3.1.1.6 Fobos Investment Sp. z o.o.<br />
The Rondo Jazdy Polskiej, a further joint venture project in Warsaw, was acquired by the Polish Fobos Investment<br />
Sp. z o.o as of 29 December <strong>2006</strong>. The company owns an office development project that is located in the centre of<br />
Warsaw.<br />
The following table shows the consolidated proportional share of net assets at the individual company level as of the<br />
balance sheet date and the income statement of the company for the period from the acquisition date to the balance<br />
sheet date, which is included in the consolidated financial statements:<br />
Segment CEE<br />
Location of property Poland<br />
Company Fobos Investment Sp. z o.o.<br />
Date of initial consolidation 14.12.<strong>2006</strong><br />
All amounts in TEUR 30 April 20<strong>07</strong><br />
Property 547.0<br />
Other non-current assets 11.2<br />
Current assets 116.8<br />
Non-current liabilities -8.2<br />
Current liabilities -45.2<br />
Proportional share of net assets 621.5<br />
All amounts in TEUR <strong>2006</strong>/<strong>07</strong><br />
Revenues 0.0<br />
Revaluation 0.0<br />
Operating profit (EBIT) -5.8<br />
Financial results -25.6<br />
Income taxes 3.0<br />
Net profit for the period -28.4
2.3.1.1.7 Passat Real Sp. z o.o.<br />
The Passat Office Building in Warsaw, a standing investment was acquired as of 29 March 20<strong>07</strong> through the purchase<br />
of 100% of the shares in the Polish Passat Real Sp. z o.o. The Passat Office Building is a modern office property that<br />
is located adjacent to the Mistral Office Building owned by <strong>IMMOEAST</strong>. The object has an excellent location, with<br />
easy access via public transportation. Both the city centre of Warsaw and the international airport can be reached<br />
in 10 minutes.<br />
The following table shows the acquired assets and liabilities at fair value as well as the consolidated proportional<br />
share of net assets at the individual company level as of the balance sheet date and the income statement of the<br />
company for the period from the acquisition date to the balance sheet date, which is included in the consolidated<br />
financial statements:<br />
Segment CEE<br />
Location of property Poland<br />
Company Passat Real Sp. z o.o.<br />
Date of initial consolidation 27.3.20<strong>07</strong><br />
All amounts in TEUR<br />
Cash and cash equivalents 69.5<br />
Receivables and other assets 205.3<br />
Deferred tax assets 49.2<br />
Property 28,344.4<br />
Financial liabilities -12,616.1<br />
Trade accounts payable -23.9<br />
Other liabilities -1,776.4<br />
Provisions -14.6<br />
Deferred tax liabilities -2,821.2<br />
Currency translation adjustment -158.3<br />
Acquired net assets 11,257.9<br />
(Negative) goodwill 2,945.9<br />
Purchase price paid in cash 14,203.8<br />
Less cash and cash equivalents acquired -69.5<br />
Net purchase price for property company 14,134.4<br />
2.3.1.2RegionalsubsegmentSlovakia<br />
All amounts in TEUR 30 April 20<strong>07</strong><br />
Property 28,741.2<br />
Other non-current assets 2,992.0<br />
Current assets 245.9<br />
Non-current liabilities -15,431.2<br />
Current liabilities -135.4<br />
Proportional share of net assets 16,412.4<br />
All amounts in TEUR <strong>2006</strong>/<strong>07</strong><br />
Revenues 17.4<br />
Revaluation 45.1<br />
Operating profit (EBIT) -132.3<br />
Financial results 295.7<br />
Income taxes -58.7<br />
Net profit for the period 104.6<br />
2.3.1.2.1 TriGránit Centrum a.s.<br />
As of 9 June <strong>2006</strong> <strong>IMMOEAST</strong> acquired a 25% stake in the Slovakian TriGránit Centrum a.s., which is developing the<br />
Lakeside project in Bratislava. This investment is classified as an associated company.<br />
2.3.1.2.2 SCT s.r.o.<br />
The Slovakian SCT s.r.o. was fully consolidated by <strong>IMMOEAST</strong> as of 21 December <strong>2006</strong>. This company owns the<br />
Arkadia shopping centre, which is located on the eastern border of Trnava near a densely populated residential area.<br />
The following table shows the acquired assets and liabilities at fair value as well as the consolidated proportional<br />
share of net assets at the individual company level as of the balance sheet date and the income statement of the<br />
company for the period from the acquisition date to the balance sheet date, which is included in the consolidated<br />
financial statements:<br />
Notes<br />
<strong>Report</strong> by the Executive Board 133<br />
Highlights <strong>2006</strong>/<strong>07</strong><br />
Business Model and Strategy<br />
Portfolio Structure<br />
Corporate Governance and Outlook<br />
Property Portfolio<br />
Development of Business<br />
Consolidated Financial Statements<br />
Service and Glossary
134 <strong>IMMOEAST</strong> <strong>Annual</strong> <strong>Report</strong> <strong>2006</strong>/<strong>07</strong><br />
Segment CEE All amounts in TEUR 30 April 20<strong>07</strong><br />
Location of property Slovakia Property 15,204.0<br />
Company SCT s.r.o.<br />
Other non-current assets 1,501.3<br />
Date of initial consolidation 21.12.<strong>2006</strong><br />
Current assets 537.3<br />
All amounts in TEUR<br />
Cash and cash equivalents<br />
Receivables and other assets<br />
309.6<br />
444.9<br />
Non-current liabilities<br />
Current liabilities<br />
Proportional share of net assets<br />
-6,060.9<br />
-477.7<br />
10,704.0<br />
Deferred tax assets<br />
Property<br />
Financial liabilities<br />
Trade accounts payable<br />
Other liabilities<br />
Provisions<br />
Deferred tax liabilities<br />
Currency translation adjustment<br />
17.4<br />
11,724.1<br />
-4,335.8<br />
-224.3<br />
-95.1<br />
-0.8<br />
-1,169.1<br />
218.1<br />
All amounts in TEUR<br />
Revenues<br />
Revaluation<br />
Operating profit (EBIT)<br />
Financial results<br />
Income taxes<br />
Net profit for the period<br />
<strong>2006</strong>/<strong>07</strong><br />
428.8<br />
2,695.7<br />
2,902.6<br />
33.1<br />
-557.9<br />
2,377.8<br />
Acquired net assets 6,889.2<br />
(Negative) goodwill 1,406.5<br />
Purchase price paid in cash 8,295.7<br />
Less cash and cash equivalents acquired -309.6<br />
Net purchase price for property company 7,986.1<br />
2.3.1.3 Regional subsegment Czech Republic<br />
2.3.1.3.1 Aragonit s.r.o.<br />
The Czech Aragonit s.r.o. was acquired in full as of 1 July <strong>2006</strong>, which added the Skofin Office Building in Prague<br />
to the <strong>IMMOEAST</strong> portfolio. As of 30 May <strong>2006</strong> a 50.50% stake was acquired in My Box Straconice s.r.o., a project<br />
company in the Czech Republic.<br />
The following table shows the acquired assets and liabilities at fair value as well as the consolidated proportional<br />
share of net assets at the individual company level as of the balance sheet date and the income statement of the<br />
company for the period from the acquisition date to the balance sheet date, which is included in the consolidated<br />
financial statements:<br />
Segment CEE<br />
Location of property Czech Republic<br />
Company Aragonit s.r.o.<br />
Date of initial consolidation 1.7.<strong>2006</strong><br />
All amounts in TEUR<br />
Cash and cash equivalents 247.5<br />
Receivables and other assets 121.3<br />
Property 11,690.9<br />
Financial liabilities -5,404.3<br />
Trade accounts payable -38.9<br />
Other liabilities -29.4<br />
Provisions -99.3<br />
Deferred tax liabilities -1,516.7<br />
Currency translation adjustment -51.9<br />
Acquired net assets 4,919.2<br />
(Negative) goodwill 1,699.4<br />
Purchase price paid in cash 6,618.6<br />
Less cash and cash equivalents acquired -247.5<br />
Net purchase price for property company 6,371.1<br />
All amounts in TEUR 30 April 20<strong>07</strong><br />
Property 15,936.7<br />
Other non-current assets 1,727.1<br />
Current assets 595.9<br />
Non-current liabilities -7,686.5<br />
Current liabilities -382.1<br />
Proportional share of net assets 10,191.1<br />
All amounts in TEUR <strong>2006</strong>/<strong>07</strong><br />
Revenues 901.5<br />
Revaluation 4,159.7<br />
Operating profit (EBIT) 4,406.2<br />
Financial results -147.4<br />
Income taxes -1,038.2<br />
Net profit for the period 3,220.6
2.3.1.3.2 Diamant Real s.r.o.<br />
The Czech Diamant Real s.r.o. was fully consolidated by <strong>IMMOEAST</strong> as of 31 October <strong>2006</strong>. This transaction led to the<br />
purchase of one of the larger modern office properties (“Diamond Point”) in the capital city of Prague. In addition,<br />
49% of the shares in Veronia Shelf s.r.o., the parent company of Diamant Real s.r.o., were sold to the joint venture<br />
partner Allianz projštovna, a.s. as of 30 November <strong>2006</strong>.<br />
The following table shows the acquired assets and liabilities at fair value as well as the consolidated proportional<br />
share of net assets at the individual company level as of the balance sheet date and the income statement of the<br />
company for the period from the acquisition date to the balance sheet date, which is included in the consolidated<br />
financial statements:<br />
Segment CEE<br />
Location of property Czech Republic<br />
Company Diamant Real s.r.o.<br />
Date of initial consolidation 31.10.<strong>2006</strong><br />
All amounts in TEUR<br />
Cash and cash equivalents 212.0<br />
Receivables and other assets 512.9<br />
Deferred tax assets 590.9<br />
Property 36,543.5<br />
Financial liabilities -19,523.8<br />
Trade accounts payable -411.5<br />
Other liabilities -173.5<br />
Provisions -2.5<br />
Deferred tax liabilities -4,715.6<br />
Acquired net assets 13,032.5<br />
(Negative) goodwill 4,149.7<br />
Purchase price paid in cash 17,182.1<br />
Less cash and cash equivalents acquired -212.0<br />
Net purchase price for property company 16,970.1<br />
All amounts in TEUR 30 April 20<strong>07</strong><br />
Property 47,930.3<br />
Other non-current assets 5,024.2<br />
Current assets 513.6<br />
Non-current liabilities -25,435.0<br />
Current liabilities -1,389.6<br />
Proportional share of net assets 26,643.6<br />
All amounts in TEUR <strong>2006</strong>/<strong>07</strong><br />
Revenues 1,021.1<br />
Revaluation 10,973.2<br />
Operating profit (EBIT) 11,639.0<br />
Financial results -432.3<br />
Income taxes -2,692.0<br />
Net profit for the period 8,514.7<br />
2.3.1.3.3 WINNIPEGIA SHELF s.r.o.<br />
As of 13 November <strong>2006</strong> <strong>IMMOEAST</strong> acquired 100% of the shares in the Czech WINNIPEGIA SHELF s.r.o. and, from<br />
this company, the Grand Pardubice shopping centre. This property is located only several minutes from the historical<br />
old city and castle in Pardubice, and is comprised of two connected building complexes.<br />
The following table shows the acquired assets and liabilities at fair value as well as the consolidated proportional<br />
share of net assets at the individual company level as of the balance sheet date and the income statement of the<br />
company for the period from the acquisition date to the balance sheet date, which is included in the consolidated<br />
financial statements:<br />
Segment CEE<br />
Location of property Czech Republic<br />
Company WINNIPEGIA SHELF s.r.o.<br />
Date of initial consolidation 13.11.<strong>2006</strong><br />
All amounts in TEUR<br />
Property 35,149.0<br />
Other non-current assets 201.4<br />
Current assets 773.3<br />
Non-current liabilities -2,<strong>07</strong>0.5<br />
Current liabilities -422.0<br />
Proportional share of net assets 33,631.2<br />
Notes<br />
All amounts in TEUR <strong>2006</strong>/<strong>07</strong><br />
Revenues 829.9<br />
Revaluation 6,437.6<br />
Operating profit (EBIT) 6,834.8<br />
Financial results -824.1<br />
Income taxes -1,546.4<br />
Net profit for the period 4,464.4<br />
<strong>Report</strong> by the Executive Board 135<br />
Highlights <strong>2006</strong>/<strong>07</strong><br />
Business Model and Strategy<br />
Portfolio Structure<br />
Corporate Governance and Outlook<br />
Property Portfolio<br />
Development of Business<br />
Consolidated Financial Statements<br />
Service and Glossary
136 <strong>IMMOEAST</strong> <strong>Annual</strong> <strong>Report</strong> <strong>2006</strong>/<strong>07</strong><br />
2.3.1.3.4 Building A k.s., Building B k.s. and Building C k.s.<br />
During the third quarter of <strong>2006</strong>/<strong>07</strong> <strong>IMMOEAST</strong> concluded its largest investment to date on the Czech office market.<br />
As of 13 December <strong>2006</strong> the Company acquired 100% of the shares in Building A k.s., Building B k.s. and Building<br />
C k.s., which led to the takeover of three objects in the BB Centrum office park. All three properties are fully let to<br />
well-known companies, in particular subsidiaries of foreign corporations.<br />
The following table shows the acquired assets and liabilities at fair value as well as the consolidated proportional<br />
share of net assets at the individual company level as of the balance sheet date and the income statements of the<br />
companies for the period from the acquisition date to the balance sheet date, which are included in the consolidated<br />
financial statements:<br />
Segment CEE<br />
Location of property Czech Republic<br />
Company BB C – Building A, k.s. BB C – Building B, k.s. BB C – Building C, k.s.<br />
Date of initial consolidation 13.12.<strong>2006</strong> 13.12.<strong>2006</strong> 13.12.<strong>2006</strong><br />
All amounts in TEUR<br />
Cash and cash equivalents 5,512.3 2,213.3 513.7<br />
Receivables and other assets 1,217.0 1,403.1 1,680.8<br />
Deferred tax assets 136.4 243.9 0.0<br />
Property 64,335.5 53,610.8 40,132.8<br />
Financial liabilities -31,570.0 -20,147.1 0.0<br />
Trade accounts payable -53.2 -1,153.4 -203.7<br />
Other liabilities -2,619.0 -871.1 -19,273.7<br />
Provisions -65.5 -85.4 -116.6<br />
Deferred tax liabilities -9,316.9 -8,715.1 -5,912.4<br />
Currency translation adjustment 515.8 491.1 319.6<br />
Acquired net assets 28,092.4 26,990.1 17,140.5<br />
(Negative) goodwill 9,155.5 8,470.4 5,938.8<br />
Purchase price paid in cash 37,247.9 35,460.5 23,<strong>07</strong>9.3<br />
Less cash and cash equivalents acquired -5,512.3 -2,213.3 -513.7<br />
Net purchase price for property company 31,735.5 33,247.2 22,565.6<br />
All amounts in TEUR 30 April 20<strong>07</strong><br />
Property 71,243.3 43,637.4 60,905.9<br />
Other non-current assets 9,424.4 6,642.2 5,976.5<br />
Current assets 2,244.8 1,954.4 1,971.7<br />
Non-current liabilities -43,434.0 -26,687.2 -26,768.1<br />
Current liabilities -1,489.6 -2,128.8 -1,373.4<br />
Proportional share of net assets 37,989.0 23,418.0 40,712.7<br />
All amounts in TEUR <strong>2006</strong>/<strong>07</strong><br />
Revenues 1,595.9 1,753.2 1,353.9<br />
Revaluation 6,533.6 -10,202.6 20,410.2<br />
Operating profit (EBIT) 7,906.9 -11,483.6 21,170.8<br />
Financial results -833.6 -383.5 -493.5<br />
Income taxes -1,528.3 2,490.4 -4,875.0<br />
Net profit for the period 5,545.0 -9,376.7 15,802.4<br />
2.3.1.3.5 Centre Investments s.r.o., Delta Park a.s. and Brno Estates a.s.<br />
<strong>IMMOEAST</strong> acquired 100% of the shares in the Czech Centre Investments s.r.o., Delta Park a.s. and Brno Estates a.s.<br />
as part of a uniform transaction during the fourth quarter of <strong>2006</strong>/<strong>07</strong>. This portfolio comprises four standing investments<br />
and two forward purchases: Jungmannova Plaza, a class A office property that is located in the historical city
centre of Prague, is almost fully let and has international tenants; Sylva Taroucca, a historical building on the Graben<br />
in Prague that is fully occupied; OC Petrov: an object located in the centre of Brno that is also almost fully let; Brno<br />
Business Park – Phase 1: an office complex in Brno that is comprised of two buildings; Brno Business Park – Phase 2:<br />
this class A office development project in Brno also comprises two buildings and represents an extension to the<br />
existing Brno Business Park – Phase 1 project; Letna Galeria: this shopping and business centre in Prague 7 is a<br />
development project that has received district approval.<br />
The following table shows the acquired assets and liabilities at fair value as well as the consolidated proportional<br />
share of net assets at the individual company level as of the balance sheet date and the income statements of the<br />
companies for the period from the acquisition date to the balance sheet date, which are included in the consolidated<br />
financial statements:<br />
Segment CEE<br />
Location of property Czech Republic<br />
Company Centre Investments s.r.o. Brno Estates a.s. Delta Park a.s.<br />
Date of initial consolidation 28.2.20<strong>07</strong> 28.2.20<strong>07</strong> 1.3.20<strong>07</strong><br />
All amounts in TEUR<br />
Cash and cash equivalents 557.0 1,211.8 84.9<br />
Receivables and other assets 456.3 686.6 584.6<br />
Deferred tax assets 686.9 315.3 213.7<br />
Property 16,191.0 56,955.4 47,680.4<br />
Financial liabilities -3,699.1 -18,895.0 -13,759.9<br />
Trade accounts payable -33.4 -1,889.2 -177.4<br />
Other liabilities -360.1 -272.7 -7,405.8<br />
Provisions -100.1 0.0 0.0<br />
Deferred tax liabilities -3,148.0 -9,334.3 -6,858.0<br />
Currency translation adjustment -12.1 -41.9 44.9<br />
Acquired net assets 10,538.3 28,735.9 20,4<strong>07</strong>.5<br />
(Negative) goodwill 4,042.3 21,683.5 6,899.9<br />
Purchase price paid in cash 14,580.6 50,419.4 27,3<strong>07</strong>.4<br />
Less cash and cash equivalents acquired -557.0 -1,211.8 -84.9<br />
Net purchase price for property company 14,023.7 49,2<strong>07</strong>.6 27,222.4<br />
All amounts in TEUR 30 April 20<strong>07</strong><br />
Property 17,114.6 79,028.2 44,949.8<br />
Other non-current assets 3,387.7 14,7<strong>07</strong>.0 6,523.0<br />
Current assets 1,663.9 2,271.2 1,042.1<br />
Non-current liabilities -6,938.3 -30,619.8 -19,273.9<br />
Current liabilities -541.0 -927.1 -2,108.8<br />
Proportional share of net assets 14,686.9 64,459.5 31,132.3<br />
All amounts in TEUR <strong>2006</strong>/<strong>07</strong><br />
Revenues 138.8 200.8 443.4<br />
Revaluation 833.7 20,241.3 -2,983.2<br />
Operating profit (EBIT) 161.1 12,715.8 -3,448.3<br />
Financial results -12.4 -77.1 -167.5<br />
Income taxes -192.1 -4,838.4 700.6<br />
Net profit for the period -43.3 7,800.3 -2,915.2<br />
Notes<br />
<strong>Report</strong> by the Executive Board 137<br />
Highlights <strong>2006</strong>/<strong>07</strong><br />
Business Model and Strategy<br />
Portfolio Structure<br />
Corporate Governance and Outlook<br />
Property Portfolio<br />
Development of Business<br />
Consolidated Financial Statements<br />
Service and Glossary
138 <strong>IMMOEAST</strong> <strong>Annual</strong> <strong>Report</strong> <strong>2006</strong>/<strong>07</strong><br />
2.3.1.4 Regional subsegment Hungary<br />
2.3.1.4.1 Central Business Center Rt.<br />
Central Business Center Rt., a Hungarian project<br />
company, was fully consolidated by <strong>IMMOEAST</strong> as<br />
of 10 January 20<strong>07</strong>. The company owns the Central<br />
Business Center in Budapest, which is located on<br />
the Buda-side of the city near the Margit Bridge.<br />
The following table shows the acquired assets and<br />
liabilities at fair value as well as the consolidated<br />
proportional share of net assets at the individual<br />
company level as of the balance sheet date and<br />
the income statement of the company for the period<br />
from the acquisition date to the balance sheet<br />
date, which is included in the consolidated financial<br />
statements:<br />
2.3.2 Segment Community of Independent States (CIS)<br />
2.3.2.1 Regional subsegment Russia<br />
Segment CEE<br />
Location of property Hungary<br />
Company Central Business Center Rt.<br />
Date of initial consolidation 15.1.20<strong>07</strong><br />
All amounts in TEUR<br />
Cash and cash equivalents 1,<strong>07</strong>7.2<br />
Receivables and other assets 684.1<br />
Deferred tax assets 4.7<br />
Property 20,710.0<br />
Trade accounts payable -40.9<br />
Other liabilities -5,280.6<br />
Deferred tax liabilities -1,809.5<br />
Currency translation adjustment 243.3<br />
Acquired net assets 15,588.3<br />
(Negative) goodwill 2,033.6<br />
Purchase price paid in cash 17,621.9<br />
Less cash and cash equivalents acquired -1,<strong>07</strong>7.2<br />
Net purchase price for property company 16,544.7<br />
All amounts in TEUR 30 April 20<strong>07</strong><br />
Property 20,481.7<br />
Other non-current assets 1,855.2<br />
Current assets 1,721.2<br />
Non-current liabilities -1,883.2<br />
Current liabilities -135.1<br />
Proportional share of net assets 22,039.7<br />
All amounts in TEUR <strong>2006</strong>/<strong>07</strong><br />
Revenues 186.8<br />
Revaluation -905.4<br />
Operating profit (EBIT) -1,298.0<br />
Financial results 62.0<br />
Income taxes 144.1<br />
Net profit for the period -1,092.0<br />
2.3.2.1.1WakelinPromotionsLimitedandKronaDesignLLC<br />
As of 21 June <strong>2006</strong> <strong>IMMOEAST</strong> acquired 100% of the shares in the Cypriote Wakelin Promotions Limited, which has<br />
an office in Russia, and the Russian Krona Design LLC. These companies own two shopping centres in Moscow:<br />
Golden Babylon I and Golden Babylon II. Golden Babylon I, the larger of the two objects, is fully rented to attractive<br />
tenants from the foodstuffs and electronics branches. Golden Babylon II was completed in August <strong>2006</strong> and is also<br />
fully let.
The following table shows the acquired assets and liabilities at fair value as well as the consolidated proportional<br />
share of net assets at the individual company level as of the balance sheet date and the income statements of the<br />
companies for the period from the acquisition date to the balance sheet date, which are included in the consolidated<br />
financial statements:<br />
Segment CIS<br />
Location of property Russia<br />
Company Wakelin Promotions Limited Krona Design LLC<br />
Date of initial consolidation 21.6.<strong>2006</strong> 21.6.<strong>2006</strong><br />
All amounts in TEUR<br />
Cash and cash equivalents 535.1 627.6<br />
Financial assets 31,642.3 0.0<br />
Receivables and other assets 13,303.0 2,767.1<br />
Deferred tax assets 0.0 10.0<br />
Property 140,808.1 56,794.2<br />
Financial liabilities -1,120.5 -4,224.2<br />
Trade accounts payable 0.0 -153.9<br />
Other liabilities -2,580.6 -14,190.2<br />
Provisions -47.4 -20.5<br />
Deferred tax liabilities -31,488.0 -9,967.9<br />
Currency translation adjustment 2,706.3 0.0<br />
Acquired net assets 153,758.3 31,642.3<br />
(Negative) goodwill 50,958.1 0.0<br />
Purchase price paid in cash 204,716.4 31,642.3<br />
Less cash and cash equivalents acquired -535.1 -627.6<br />
Net purchase price for property company 204,181.3 31,014.7<br />
All amounts in TEUR 30 April 20<strong>07</strong><br />
Property 159,500.2 73,134.9<br />
Other non-current assets 50,509.9 1,681.5<br />
Current assets 5,153.4 2,455.2<br />
Non-current liabilities -36,916.5 -14,617.8<br />
Current liabilities -792.5 -525.1<br />
Proportional share of net assets 177,454.4 62,128.7<br />
All amounts in TEUR <strong>2006</strong>/<strong>07</strong><br />
Revenues 14,440.7 5,121.3<br />
Revenues 20,709.4 17,155.3<br />
Operating profit (EBIT) 30,583.8 19,635.5<br />
Financial results -75.1 20.6<br />
Income taxes -7,631.1 -5,043.3<br />
Net profit for the period 22,877.7 14,612.8<br />
2.3.2.1.2 Gangaw Investments Limited and OAO Kashirskij Dvor-Severyanin<br />
As of 13 November <strong>2006</strong> <strong>IMMOEAST</strong> acquired 50% of the shares in the Cypriote Gangaw Investments Limited and<br />
the Russian OAO Kashirskij Dvor-Severyanin. This transaction will lead to the construction of the Rostokinǒ Retail<br />
Park in Moscow through a joint project together with an established Russian property developer. The Rostokinǒ is<br />
scheduled for completion at the end of 2009, and has an excellent location at the intersection of the Mira Prospect<br />
and the future fourth ring road.<br />
Notes<br />
<strong>Report</strong> by the Executive Board 139<br />
Highlights <strong>2006</strong>/<strong>07</strong><br />
Business Model and Strategy<br />
Portfolio Structure<br />
Corporate Governance and Outlook<br />
Property Portfolio<br />
Development of Business<br />
Consolidated Financial Statements<br />
Service and Glossary
140 <strong>IMMOEAST</strong> <strong>Annual</strong> <strong>Report</strong> <strong>2006</strong>/<strong>07</strong><br />
The following table shows the acquired assets and liabilities at fair value as well as the consolidated proportional<br />
share of net assets at the individual company level as of the balance sheet date and the income statements of the<br />
companies for the period from the acquisition date to the balance sheet date, which are included in the consolidated<br />
financial statements:<br />
Segment CIS<br />
Location of property Russia<br />
Gangaw OAO Kashirskij<br />
Company Investments Limited Dvor-Severyanin<br />
Date of initial consolidation 30.10.<strong>2006</strong> 30.10.<strong>2006</strong><br />
All amounts in TEUR<br />
Cash and cash equivalents 0.0 0.4<br />
Financial assets 27,906.8 0.0<br />
Receivables and other assets 0.0 319.3<br />
Deferred tax assets 3.5 428.8<br />
Property 0.0 38,701.0<br />
Financial liabilities -502.5 -2,879.1<br />
Other liabilities 0.0 -31.0<br />
Provisions 0.0 0.0<br />
Deferred tax liabilities 0.0 -8,960.6<br />
Currency translation adjustment 81.6 328.0<br />
Acquired net assets 27,489.5 27,906.8<br />
(Negative) goodwill 13,161.1 0.0<br />
Purchase price paid in cash 40,650.5 27,906.8<br />
Less cash and cash equivalents acquired 0.0 -0.4<br />
Net purchase price for property company 40,650.5 27,906.4<br />
All amounts in TEUR 30 April 20<strong>07</strong><br />
Property 0.0 42,222.1<br />
Other non-current assets 8,872.4 940.3<br />
Current assets 0.0 2,202.4<br />
Non-current liabilities 0.0 -8,868.2<br />
Current liabilities -5<strong>07</strong>.1 -1,886.7<br />
Proportional share of net assets 8,365.3 34,609.9<br />
All amounts in TEUR <strong>2006</strong>/<strong>07</strong><br />
Revenues 0.0 12.5<br />
Revaluation 0.0 0.0<br />
Operating profit (EBIT) -4,242.4 -65.2<br />
Financial results -7.5 -565.8<br />
Income taxes 0.8 119.1<br />
Net profit for the period -4,249.2 -511.9<br />
2.3.2.1.3 Trevima Ltd. and OOO Torgoviy Dom Na Khodinke<br />
<strong>IMMOEAST</strong> acquired 100% of the shares in the Cypriote Trevima Ltd. during the third quarter of <strong>2006</strong>/<strong>07</strong>, which also<br />
resulted in the takeover of 100% of the shares in this company’s Russian subsidiary OOO Torgoviy Dom Na Khodinke.<br />
This transaction resulted in the acquisition of the 5th Avenue Shopping Center project, which is a three-storey shopping<br />
centre with two underground garage levels.
The following table shows the acquired assets and liabilities at fair value as well as the consolidated proportional<br />
share of net assets at the individual company level as of the balance sheet date and the income statements of the<br />
companies for the period from the acquisition date to the balance sheet date, which are included in the consolidated<br />
financial statements:<br />
Segment CIS<br />
Location of property Russia<br />
OOO Torgoviy Dom<br />
Company Trevima Ltd. Na Khodinke<br />
Date of initial consolidation 30.11.<strong>2006</strong> 30.11.<strong>2006</strong><br />
All amounts in TEUR<br />
Cash and cash equivalents 72.7 129.9<br />
Financial assets 64,782.2 0.0<br />
Receivables and other assets 0.0 2,788.3<br />
Deferred tax assets 2.1 253.7<br />
Property 0.0 109,717.0<br />
Financial liabilities 0.0 -191.4<br />
Other liabilities -147.2 -26,396.0<br />
Provisions -1.4 0.0<br />
Deferred tax liabilities 0.0 -21,104.2<br />
Currency translation adjustment 97.4 -416.2<br />
Acquired net assets 64,805.8 64,781.1<br />
(Negative) goodwill 21,108.1 1.1<br />
Purchase price paid in cash 85,913.9 64,782.2<br />
Less cash and cash equivalents acquired -72.7 -129.9<br />
Net purchase price for property company 85,841.2 64,652.3<br />
All amounts in TEUR 30 April 20<strong>07</strong><br />
Property 0.0 119,845.6<br />
Other non-current assets 20,990.5 592.2<br />
Current assets 0.1 3,555.4<br />
Non-current liabilities 0.0 -24,477.9<br />
Current liabilities -3.3 -648.0<br />
Proportional share of net assets 20,987.3 98,867.3<br />
All amounts in TEUR <strong>2006</strong>/<strong>07</strong><br />
Revenues 0.0 5,152.1<br />
Revaluation 0.0 11,582.7<br />
Operating profit (EBIT) 0.0 15,512.3<br />
Financial results 0.4 -1,730.0<br />
Income taxes 0.0 -3,485.2<br />
Net profit for the period 0.4 10,297.1<br />
2.3.2.2 Regional subsegment Ukraine<br />
2.3.2.2.1 Loberta Holding Limited and Roches Ventures Limited<br />
During the third quarter of <strong>2006</strong>/<strong>07</strong> <strong>IMMOEAST</strong> concluded a broad-based cooperation agreement in Ukraine, which<br />
Notes<br />
<strong>Report</strong> by the Executive Board 141<br />
Highlights <strong>2006</strong>/<strong>07</strong><br />
Business Model and Strategy<br />
Portfolio Structure<br />
Corporate Governance and Outlook<br />
Property Portfolio<br />
Development of Business<br />
Consolidated Financial Statements<br />
Service and Glossary
142 <strong>IMMOEAST</strong> <strong>Annual</strong> <strong>Report</strong> <strong>2006</strong>/<strong>07</strong><br />
took the form of a joint investment with the well-known Ukrainian developer Alacor. Through a successive purchase<br />
of shares (from 24.9% to 51% and 41%, respectively) in the Cypriote Loberta Holding Limited and Roches Ventures<br />
Limited, the Alacor Business Park City logistics and office project and the Alacor Logistic Park Obukhov were acquired.<br />
Both the Business Park City and the Park Obukhov are located in the south of Kiev and have excellent traffic connections.<br />
The completion of both projects is scheduled for 2009.<br />
The following table shows the acquired assets and liabilities at fair value as well as the consolidated proportional<br />
share of net assets at the individual company level as of the balance sheet date and the income statements of the<br />
companies for the period from the acquisition date to the balance sheet date, which are included in the consolidated<br />
financial statements:<br />
Segment CIS<br />
Location of property Ukraine<br />
Loberta. Roches Alacor Alacor<br />
Company Holdings Ltd Ventures Ltd. Construction LLC Alacor Scorta LLC Alacor City LLC<br />
Initial consolidation 10.1.20<strong>07</strong> 10.1.20<strong>07</strong> 10.1.20<strong>07</strong> 10.1.20<strong>07</strong> 10.1.20<strong>07</strong><br />
All amounts in TEUR<br />
Cash and cash equivalents 0.5 0.3 1.8 2.4 1.7<br />
Financial instruments 0.0 885.9 20.1 998.3 0.0<br />
Receivables and other assets 1,108.8 0.2 0.2 0.1 8.3<br />
Deferred tax assets 0.5 0.7 0.0 0.2 10.1<br />
Property 0.0 0.0 0.0 0.0 2,727.5<br />
Other liabilities -1,110.1 -67.8 -0.1 -0.1 -1,391.1<br />
Provisions -0.3 -0.2 0.0 0.0 0.0<br />
Deferred tax liabilities -0.6 0.0 0.0 -0.1 -348.1<br />
Currency translation adjustment 0.0 20.8 0.4 17.9 0.0<br />
Acquired net assets -1.2 839.7 22.4 1,018.7 1,008.4<br />
(Negative) goodwill 24.7 12,570.2 0.0 0.0 0.0<br />
Purchase price paid in cash 23.5 13,409.9 22.4 1,018.7 1,008.4<br />
Less cash and cash equivalents acquired -0.5 -0.3 -1.8 -2.4 -1.7<br />
Net purchase price for project company 23.0 13,409.6 20.6 1,016.3 1,006.7<br />
All amounts in TEUR 30 April 20<strong>07</strong><br />
Property 0.0 0.0 0.0 0.0 2,760.8<br />
Other non-current assets 393.1 342.2 0.1 0.3 28.6<br />
Current assets 0.5 0.4 1.5 2.0 2.9<br />
Non-current liabilities -972.0 -3.1 0.0 0.0 -341.5<br />
Current liabilities -11.1 -78.7 -0.1 -0.1 -0.5<br />
Proportional share of net assets -589.5 260.8 1.5 2.2 2,450.3<br />
All amounts in TEUR <strong>2006</strong>/<strong>07</strong><br />
Revenues 0.0 0.0 0.0 0.0 0.0<br />
Revaluation 0.0 0.0 0.0 0.0 0.0<br />
Operating profit (EBIT) -31.4 -12,227.6 -0.4 -0.3 -2.7<br />
Financial results 12.2 0.0 0.0 0.0 -40.5<br />
Income taxes -0.6 0.1 0.1 0.1 10.7<br />
Net profit for the period -19.8 -12,227.5 -0.3 -0.2 -32.5
2.3.3 Segment South-Eastern Europe (SEE)<br />
2.3.3.1 Regional subsegment Bulgaria<br />
2.3.3.1.1 Koral Residence EAD<br />
<strong>IMMOEAST</strong> acquired 100% of the shares in the Bulgarian Koral Residence EAD as of 23 June <strong>2006</strong>. A closed complex<br />
with a 4-star hotel and residential area will be built in Zarevo, 50 km south of the Black Sea resort of Burgas in Bulgaria,<br />
as a joint investment by <strong>IMMOEAST</strong> and Prime Property BG. This project was recognised under inventories in<br />
accordance with IAS 2 (see point 4.8).<br />
The following table shows the acquired assets and liabilities at fair value as well as the consolidated proportional<br />
share of net assets at the individual company level as of the balance sheet date and the income statement of the<br />
companies for the period from the acquisition date to the balance sheet date, which is included in the consolidated<br />
financial statements:<br />
Segment SEE<br />
Location of property Bulgaria<br />
Company Koral Residence EAD<br />
Date of initial consolidation 23.6.<strong>2006</strong><br />
All amounts in TEUR<br />
Receivables and other assets 2,832.2<br />
Deferred tax liabilities -262.8<br />
Acquired net assets 2,569.4<br />
(Negative) goodwill 281.5<br />
Purchase price paid in cash 2,850.9<br />
Net purchase price for property company 2,850.9<br />
All amounts in TEUR 30 April 20<strong>07</strong><br />
Property 0.0<br />
Other non-current assets 273.1<br />
Current assets 2,857.3<br />
Non-current liabilities -262.8<br />
Current liabilities -6.5<br />
Proportional share of net assets 2,861.1<br />
All amounts in TEUR <strong>2006</strong>/<strong>07</strong><br />
Revenues 0.0<br />
Revaluation 0.0<br />
Operating profit (EBIT) -120.9<br />
Financial results -0.6<br />
Income taxes 10.3<br />
Net profit for the period -111.2<br />
Notes<br />
<strong>Report</strong> by the Executive Board 143<br />
Highlights <strong>2006</strong>/<strong>07</strong><br />
Business Model and Strategy<br />
Portfolio Structure<br />
Corporate Governance and Outlook<br />
Property Portfolio<br />
Development of Business<br />
Consolidated Financial Statements<br />
Service and Glossary
144 <strong>IMMOEAST</strong> <strong>Annual</strong> <strong>Report</strong> <strong>2006</strong>/<strong>07</strong><br />
2.3.3.1.2 Blue Danube Holding Ltd. and Business Park West-Sofia EAD<br />
As of 12 December <strong>2006</strong> <strong>IMMOEAST</strong> acquired all of the shares in the Maltese Blue Danube Holding Ltd. and its<br />
Bulgarian subsidiary Business Park West-Sofia EAD. This project involves the revitalisation of a former light industrial<br />
and administrative complex in four phases to create a business park.<br />
The following table shows the acquired assets and liabilities at fair value as well as the consolidated proportional<br />
share of net assets at the individual company level as of the balance sheet date and the income statement of the<br />
company for the period from the acquisition date to the balance sheet date, which is included in the consolidated<br />
financial statements:<br />
Segment SEE All amounts in TEUR 30 April 20<strong>07</strong><br />
Location of property Bulgaria Property 102,881.3<br />
Company Business Park West-Sofia EAD<br />
Other non-current assets 486.8<br />
Date of initial consolidation 12.12.<strong>2006</strong><br />
Current assets 2,155.5<br />
All amounts in TEUR<br />
Non-current liabilities -9,189.3<br />
Cash and cash equivalents 2,508.2<br />
Current liabilities -56.7<br />
Receivables and other assets 1,994.6<br />
Proportional share of net assets 96,277.7<br />
Property 22,694.7<br />
All amounts in TEUR <strong>2006</strong>/<strong>07</strong><br />
Other liabilities -14,709.8<br />
Revenues 482.5<br />
Deferred tax liabilities -1,223.2<br />
Revaluation 78,740.4<br />
Acquired net assets 11,264.5<br />
Operating profit (EBIT) 78,932.0<br />
Purchase price paid in cash 11,264.5<br />
Financial results -429.6<br />
Less cash and cash equivalents acquired -2,508.2<br />
Income taxes -7,851.1<br />
Net purchase price for property company 8,756.3<br />
Net profit for the period 70,651.4<br />
2.3.3.2 Regional subsegment Croatia<br />
2.3.3.2.1 Grand Centar d.o.o. and Grand Zagreb d.o.o.<br />
<strong>IMMOEAST</strong> purchased 80% of the shares in each of the Croatian companies Grand Centar d.o.o. and Grand Zagreb<br />
d.o.o. as of 30 November <strong>2006</strong>, which resulted in the acquisition of the Grand Center office and retail property in the<br />
capital city of Zagreb. This represents the first direct investment by <strong>IMMOEAST</strong> in Croatia, and was realised together<br />
with Generali Immobilien AG. The majority of the space in the Grand Center is used as offices, but retail space, warehouses<br />
and an underground garage are also available. This property has a central location, roughly 800 m from the<br />
historical old city.
The following table shows the acquired assets and liabilities at fair value as well as the consolidated proportional<br />
share of net assets at the individual company level as of the balance sheet date and the income statements of the<br />
companies for the period from the acquisition date to the balance sheet date, which are included in the consolidated<br />
financial statements:<br />
Segment SEE<br />
Location of property Croatia<br />
Company Grand Centar d.o.o. Grand Zagreb d.o.o.<br />
Date of initial consolidation 30.11.<strong>2006</strong> 30.11.<strong>2006</strong><br />
All amounts in TEUR<br />
Cash and cash equivalents 0.1 41.7<br />
Financial assets 0.0 10,249.9<br />
Receivables and other assets 721.5 579.5<br />
Deferred tax assets 49.1 63.3<br />
Property 39,400.0 164.2<br />
Financial liabilities 0.0 -361.0<br />
Trade accounts payable -49.7 -43.5<br />
Other liabilities -26,279.8 -618.4<br />
Provisions 0.0 -14.0<br />
Deferred tax liabilities -2,844.5 -746.8<br />
Acquired net assets 10,996.7 9,315.1<br />
(Negative) goodwill 0.0 2,487.8<br />
Purchase price paid in cash 10,996.7 11,802.9<br />
Less cash and cash equivalents acquired -0.1 -41.7<br />
Net purchase price for property company 10,996.6 11,761.2<br />
All amounts in TEUR 30 April 20<strong>07</strong><br />
Property 45,608.2 164.2<br />
Other non-current assets 0.0 2,609.8<br />
Current assets 731.4 1,532.3<br />
Non-current liabilities -4,132.6 -0.3<br />
Current liabilities -145.1 -780.0<br />
Proportional share of net assets 42,062.0 3,525.8<br />
All amounts in TEUR <strong>2006</strong>/<strong>07</strong><br />
Revenues 618.3 971.4<br />
Revaluation 6,208.2 0.0<br />
Operating profit (EBIT) 7,606.7 -256.3<br />
Financial results -685.9 1.6<br />
Income taxes -1,390.7 50.9<br />
Net profit for the period 5,530.1 -203.8<br />
2.3.3.3 Regional subsegment Romania<br />
2.3.3.3.1 S.C. Almera New Capital s.r.l., S.C. Meteo Business Park s.r.l., S.C. Stupul de Albine s.r.l.<br />
As of 13 July <strong>2006</strong> <strong>IMMOEAST</strong> acquired 100% of the shares in S.C. Almera New Capital s.r.l., which owns a property<br />
in Timis¸oara. This transaction will lead to the creation of a logistics centre portfolio of five to seven objects together<br />
with the development partner Eyemaxx. A 50% stake in this company was sold as of 1 February 20<strong>07</strong> and resulted<br />
in a changeover to proportionate consolidation as of 30 April 20<strong>07</strong>. In addition, 89% of the shares in S.C. Meteo<br />
Business Park s.r.l. and S.C. Stupul de Albine s.r.l. were acquired as of 27 July <strong>2006</strong>, resulting in the acquisition of<br />
Notes<br />
<strong>Report</strong> by the Executive Board 145<br />
Highlights <strong>2006</strong>/<strong>07</strong><br />
Business Model and Strategy<br />
Portfolio Structure<br />
Corporate Governance and Outlook<br />
Property Portfolio<br />
Development of Business<br />
Consolidated Financial Statements<br />
Service and Glossary
146 <strong>IMMOEAST</strong> <strong>Annual</strong> <strong>Report</strong> <strong>2006</strong>/<strong>07</strong><br />
the Jandarmeriei property. This project comprises the development of an office complex and residential complex in<br />
the north of Bucharest.<br />
The following table shows the acquired assets and liabilities at fair value as well as the consolidated proportional<br />
share of net assets at the individual company level as of the balance sheet date and the income statements of the<br />
companies for the period from the acquisition date to the balance sheet date, which are included in the consolidated<br />
financial statements:<br />
Segment SEE<br />
Location of property Romania<br />
S.C. Almera. S.C. Meteo. S.C. Stupul<br />
Company New Capital s.r.l Business Park s.r.l de Albine s.r.l.<br />
Date of initial consolidation 13.7.<strong>2006</strong> 27.7.<strong>2006</strong> 27.7.<strong>2006</strong><br />
All amounts in TEUR<br />
Cash and cash equivalents 0.0 2,377.1 1,525.7<br />
Receivables and other assets 0.0 172.4 9,017.2<br />
Deferred tax assets 0.4 11.6 14.9<br />
Property 204.5 9,849.6 0.0<br />
Financial liabilities -88.0 -4,797.9 -4,102.0<br />
Trade accounts payable 0.0 -46.1 -42.5<br />
Other liabilities -120.8 -3,669.9 -3,560.9<br />
Deferred tax liabilities 0.0 -663.5 -499.0<br />
Currency translation adjustment -0.2 -198.5 -149.5<br />
Acquired net assets -4.2 3,034.7 2,203.9<br />
(Negative) goodwill 4.2 1,472.0 1,195.0<br />
Purchase price paid in cash 0.0 4,506.7 3,398.8<br />
Less cash and cash equivalents acquired 0.0 -2,377.1 -1,525.7<br />
Net purchase price for property company 0.0 2,129.6 1,873.1<br />
All amounts in TEUR 30 April 20<strong>07</strong><br />
Property 4,467.6 29,951.5 0.0<br />
Other non-current assets 19.4 1,548.3 1,236.7<br />
Current assets 969.1 1,745.5 10,389.0<br />
Non-current liabilities -1,261.1 -3,798.4 -509.5<br />
Current liabilities -1,<strong>07</strong>6.2 -4,978.4 -4,315.8<br />
Proportional share of net assets 3,118.8 24,468.4 6,800.5<br />
All amounts in TEUR <strong>2006</strong>/<strong>07</strong><br />
Revenues 0.0 0.0 0.0<br />
Revaluation 0.0 19,084.7 0.0<br />
Operating profit (EBIT) -384.3 19,105.5 35.1<br />
Financial results 32.7 -45.1 -34.1<br />
Income taxes 18.6 -3,021.0 0.9<br />
Net profit for the period -333.0 16,039.3 1.8
2.3.3.3.2 Klyos Media s.r.l.<br />
On 9 October <strong>2006</strong> <strong>IMMOEAST</strong> started the Craiova shopping centre project in Romania based on a joint venture<br />
agreement with an experienced general planner and developer in the CEE region with the purchase of a 90% stake<br />
in the Romanian Klyos Media s.r.l. This shopping centre is located in the north-western section of Craiova, the fifth<br />
largest city in Romania, and has excellent traffic connections.<br />
The following table shows the acquired assets and liabilities at fair value as well as the consolidated proportional<br />
share of net assets at the individual company level as of the balance sheet date and the income statement of the<br />
company for the period from the acquisition date to the balance sheet date, which is included in the consolidated<br />
financial statements:<br />
Segment SEE<br />
Location of property Romania<br />
Company Klyos Media s.r.l.<br />
Date of initial consolidation 4.8.<strong>2006</strong><br />
All amounts in TEUR<br />
Cash and cash equivalents 0.7<br />
Receivables and other assets 46.2<br />
Property 12,035.4<br />
Trade accounts payable -8,929.1<br />
Other liabilities -3,123.6<br />
Currency translation adjustment 8.1<br />
Minority interests -3.0<br />
Acquired net assets 34.7<br />
(Negative) goodwill 46.2<br />
Purchase price paid in cash 80.9<br />
Less cash and cash equivalents acquired -0.7<br />
Net purchase price for property company 80.2<br />
All amounts in TEUR 30 April 20<strong>07</strong><br />
Property 48,257.5<br />
Other non-current assets 0.0<br />
Current assets 609.0<br />
Non-current liabilities -6,515.0<br />
Current liabilities -4,292.2<br />
Proportional share of net assets 38,059.3<br />
All amounts in TEUR <strong>2006</strong>/<strong>07</strong><br />
Revenues 0.0<br />
Revaluation 32,543.7<br />
Operating profit (EBIT) 32,466.2<br />
Financial results -0.1<br />
Income taxes -5,285.1<br />
Net profit for the period 27,181.0<br />
2.3.3.3.3 Polus Transilvania Companie de Investitii S.A.<br />
<strong>IMMOEAST</strong> purchased a 15% stake in the Romanian Polus Transilvania Companie de Investitii S.A. as of 2 November<br />
<strong>2006</strong>, and thereby acquired the Polus Center development project. This project involves the construction of a<br />
shopping centre in Cluj, the capital of the booming Romanian province of Transylvania. Completion is scheduled for<br />
November 20<strong>07</strong>.<br />
Notes<br />
<strong>Report</strong> by the Executive Board 147<br />
Highlights <strong>2006</strong>/<strong>07</strong><br />
Business Model and Strategy<br />
Portfolio Structure<br />
Corporate Governance and Outlook<br />
Property Portfolio<br />
Development of Business<br />
Consolidated Financial Statements<br />
Service and Glossary
148 <strong>IMMOEAST</strong> <strong>Annual</strong> <strong>Report</strong> <strong>2006</strong>/<strong>07</strong><br />
2.3.3.3.4 S.C. EFG Urban Achizitii s.r.l.<br />
As of 14 December <strong>2006</strong> <strong>IMMOEAST</strong> purchased an 89% stake in the multi-functional project IUS Brasov with office,<br />
retail and residential space as well as a hotel. The property is located several minutes north of the commercial centre<br />
and old city, and offers an attractive infrastructure and good connections to public and private transportation.<br />
<strong>IMMOEAST</strong> has recognised this project under inventories in accordance with IAS 2 (see point 4.8).<br />
The following table shows the acquired assets and liabilities at fair value as well as the consolidated proportional<br />
share of net assets at the individual company level as of the balance sheet date and the income statement of the<br />
company for the period from the acquisition date to the balance sheet date, which is included in the consolidated<br />
financial statements:<br />
Segment SEE All amounts in TEUR 30 April 20<strong>07</strong><br />
Location of property Romania Property 0.0<br />
Company SC EFG Urban Achizitii s.r.l. Other non-current assets 1,406.9<br />
Date of initial consolidation 14.12.<strong>2006</strong><br />
Current assets 37,997.4<br />
All amounts in TEUR<br />
Cash and cash equivalents<br />
Receivables and other assets<br />
2,256.4<br />
34,145.4<br />
Non-current liabilities<br />
Current liabilities<br />
Proportional share of net assets<br />
-22,528.0<br />
-75.1<br />
16,801.2<br />
Deferred tax assets 47.2<br />
All amounts in TEUR <strong>2006</strong>/<strong>07</strong><br />
Financial liabilities -21,<strong>07</strong>9.5<br />
Revenues 0.0<br />
Trade accounts payable -402.2<br />
Revaluation 0.0<br />
Other liabilities -2,564.3<br />
Operating profit (EBIT) 1<strong>07</strong>.4<br />
Deferred tax liabilities -1,267.9<br />
Financial results -243.9<br />
Currency translation adjustment -88.8<br />
Income taxes 21.8<br />
Minority interests -1,224.9<br />
Net profit for the period -114.6<br />
Acquired net assets 9,821.4<br />
(Negative) goodwill 1,3<strong>07</strong>.8<br />
Purchase price paid in cash 11,129.2<br />
Less cash and cash equivalents acquired -2,256.4<br />
Net purchase price for property company 8,872.8
2.3.3.3.5 SBACARO s.r.l.<br />
The SIBIU joint venture shopping centre project was<br />
acquired as of 15 December <strong>2006</strong> from the Cypriote<br />
S+B CEE Alpha Cyprus Limited (100% subsidiary of<br />
S+B CEE) through SBACARO s.r.l., a wholly owned<br />
Romanian investment company. This object is also<br />
located in the north-east of the city, directly on the<br />
outer ring road and close to the historical city centre.<br />
The opening is planned for 2009.<br />
The following table shows the acquired assets and<br />
liabilities at fair value as well as the consolidated<br />
proportional share of net assets at the individual<br />
company level as of the balance sheet date and<br />
the income statement of the company for the period<br />
from the acquisition date to the balance sheet<br />
date, which is included in the consolidated financial<br />
statements:<br />
2.3.3.3.6 Logistic Contractor s.r.l.<br />
In December <strong>2006</strong> the 100% acquisition of the<br />
Romanian Logistic Contractor s.r.l. led to the conclusion<br />
of a framework agreement for the Bucharest<br />
Distribution Park project in Romania. This property<br />
is located in the north of Bucharest, close to the<br />
beltway that surrounds this city and the autobahn<br />
that extends to Ploiesti and Brasov in the north. The<br />
project involves the construction of a modern logistics<br />
and distribution park in stages. The realisation<br />
of the entire project is expected to take three years,<br />
and numerous forwarding agents have already<br />
expressed an interest.<br />
The following table shows the acquired assets and<br />
liabilities at fair value as well as the consolidated<br />
proportional share of net assets at the individual<br />
company level as of the balance sheet date and the<br />
income statement of the company for the period<br />
from the acquisition date to the balance sheet date,<br />
which is included in the consolidated financial<br />
statements:<br />
Notes<br />
Segment SEE<br />
Location of property Romania<br />
Company SBACARO s.r.l.<br />
Date of initial consolidation 15.12.<strong>2006</strong><br />
All amounts in TEUR 30 April 20<strong>07</strong><br />
Property 2,167.4<br />
Other non-current assets 6.0<br />
Current assets 39.0<br />
Non-current liabilities 0.0<br />
Current liabilities -3.1<br />
Proportional share of net assets 2,209.3<br />
All amounts in TEUR <strong>2006</strong>/<strong>07</strong><br />
Revenues 0.0<br />
Revaluation 0.0<br />
Operating profit (EBIT) -8.7<br />
Financial results -30.4<br />
Income taxes 5.9<br />
Net profit for the period -33.3<br />
Segment SEE<br />
Location of property Romania<br />
Company Logistic Contractor s.r.l.<br />
Date of initial consolidation 18.12.<strong>2006</strong><br />
All amounts in TEUR 30 April 20<strong>07</strong><br />
Property 10,320.1<br />
Other non-current assets 3.9<br />
Current assets 139.5<br />
Non-current liabilities 0.0<br />
Current liabilities -9.9<br />
Proportional share of net assets 10,453.7<br />
All amounts in TEUR <strong>2006</strong>/<strong>07</strong><br />
Revenues 0.0<br />
Revaluation 0.0<br />
Operating profit (EBIT) -4,258.4<br />
Financial results 35.8<br />
Income taxes 3.8<br />
Net profit for the period -4,218.8<br />
<strong>Report</strong> by the Executive Board 149<br />
Highlights <strong>2006</strong>/<strong>07</strong><br />
Business Model and Strategy<br />
Portfolio Structure<br />
Corporate Governance and Outlook<br />
Property Portfolio<br />
Development of Business<br />
Consolidated Financial Statements<br />
Service and Glossary
150 <strong>IMMOEAST</strong> <strong>Annual</strong> <strong>Report</strong> <strong>2006</strong>/<strong>07</strong><br />
2.3.3.3.7 FMZ TM s.r.l.<br />
As of 22 December <strong>2006</strong> a 50% stake was acquired<br />
in the Romanian FMZ TM s.r.l, a 100% subsidiary<br />
of the Cypriote company S+B CEE. This transaction<br />
resulted in the acquisition of the Targu Mures<br />
specialty shopping centre project. This property is<br />
located in the emerging economic region of Transylvania,<br />
which has a population of 160,000. This<br />
specialty shopping centre is scheduled to open in<br />
2009.<br />
The following table shows the acquired assets and<br />
liabilities at fair value as well as the consolidated<br />
proportional share of net assets at the individual<br />
company level as of the balance sheet date and the<br />
income statement of the company for the period<br />
from the acquisition date to the balance sheet date,<br />
which is included in the consolidated financial<br />
statements:<br />
2.3.3.3.8 S.C. Arbor Corporation s.r.l.<br />
As of 19 February 20<strong>07</strong> shares in S.C. Arbor Corporation<br />
s.r.l. were acquired in connection with<br />
the Glina specialty shopping centre joint venture<br />
project, which is being carried out by <strong>IMMOEAST</strong><br />
and a German developer. This project involves<br />
the purchase of several sites and construction of<br />
a specialty shopping centre. The designated location<br />
is situated on the eastern border of Bucharest,<br />
and has an excellent infrastructure as well as ideal<br />
transport connections. Intensive negotiations with<br />
potential tenants are currently in progress.<br />
The following table shows the acquired assets and<br />
liabilities at fair value as well as the consolidated<br />
proportional share of net assets at the individual<br />
company level as of the balance sheet date and<br />
the income statement of the company for the period<br />
from the acquisition date to the balance sheet<br />
date, which is included in the consolidated financial<br />
statements:<br />
Segment SEE<br />
Location of property Romania<br />
Company FMZ TM s.r.l.<br />
Date of initial consolidation 22.12.<strong>2006</strong><br />
All amounts in TEUR 30 April 20<strong>07</strong><br />
Property 1,842.2<br />
Other non-current assets 6.3<br />
Current assets 56.0<br />
Non-current liabilities -0.2<br />
Current liabilities -118.1<br />
Proportional share of net assets 1,786.2<br />
All amounts in TEUR <strong>2006</strong>/<strong>07</strong><br />
Revenues 0.0<br />
Revaluation 0.0<br />
Operating profit (EBIT) -36.1<br />
Financial results -1.5<br />
Income taxes 6.0<br />
Net profit for the period -31.6<br />
Segment SEE<br />
Location of property Romania<br />
Company S.C. Arbor Corporation s.r.l.<br />
Date of initial consolidation 29.01.20<strong>07</strong><br />
All amounts in TEUR<br />
Cash and cash equivalents 3,337.9<br />
Receivables and other assets 4.2<br />
Deferred tax assets 0.9<br />
Property 626.5<br />
Other liabilities -3,979.4<br />
Minority interests 1.0<br />
Acquired net assets -8.8<br />
(Negative) goodwill 33.4<br />
Purchase price paid in cash 24.6<br />
Less cash and cash equivalents acquired -3,337.9<br />
Net purchase price for property company -3,313.3<br />
All amounts in TEUR 30 April 20<strong>07</strong><br />
Property 4,708.5<br />
Other non-current assets 13.9<br />
Current assets 116.3<br />
Non-current liabilities 0.0<br />
Current liabilities -665.4<br />
Proportional share of net assets 4,173.2<br />
All amounts in TEUR <strong>2006</strong>/<strong>07</strong><br />
Revenues 0.0<br />
Revaluation 0.0<br />
Operating profit (EBIT) -220.4<br />
Financial results 3.7<br />
Income taxes 12.6<br />
Net profit for the period -204.1
2.3.3.3.9 S.C. IE Baneasa Project s.r.l.<br />
<strong>IMMOEAST</strong> and the Euromall developer group concluded<br />
an agreement for the construction of a joint<br />
venture project, the Euromall Residential Park, as<br />
of 19 February 20<strong>07</strong> through the acquisition of all<br />
shares in the Romanian S.C. IE Baneasa Project<br />
s.r.l. The site is located in the north-western part<br />
of Bucharest, in an area where a number of highquality<br />
residential objects are currently under construction.<br />
This project involves the construction of<br />
residential space in the middle to upper segment,<br />
whereby completion will take place in four phases<br />
over a period of four to five years.<br />
The following table shows the acquired assets and<br />
liabilities at fair value as well as the consolidated<br />
proportional share of net assets at the individual<br />
company level as of the balance sheet date and<br />
the income statement of the company for the period<br />
from the acquisition date to the balance sheet<br />
date, which is included in the consolidated financial<br />
statements:<br />
2.3.3.3.10 Eye Shop Targu Jiu s.r.l. and Eye<br />
Shop Hunedoara s.r.l.<br />
As part of activities carried out through a joint<br />
venture between <strong>IMMOEAST</strong> and the developer<br />
Eyemaxx, 50% of the shares in each of the two<br />
Romanian companies Eye Shop Targu Jiu s.r.l. and<br />
Eye Shop Hunedoara s.r.l. were acquired during the<br />
fourth quarter of <strong>2006</strong>/<strong>07</strong>. Plans calls for the construction<br />
of specialty shopping centres and shopping<br />
malls in the major economic and industrial cities<br />
of Romania.<br />
The following table shows the acquired assets and<br />
liabilities at fair value as well as the consolidated<br />
proportional share of net assets at the individual<br />
company level as of the balance sheet date and the<br />
income statement of the company for the period<br />
from the acquisition date to the balance sheet date,<br />
which is included in the consolidated financial<br />
statements:<br />
Segment SEE<br />
Location of property Romania<br />
Company S.C. IE Baneasa Project s.r.l.<br />
Date of initial consolidation 01.02.20<strong>07</strong><br />
All amounts in TEUR 30 April 20<strong>07</strong><br />
Property 22,045.2<br />
Other non-current assets 0.0<br />
Current assets 16,227.9<br />
Non-current liabilities 0.0<br />
Current liabilities -19,934.9<br />
Proportional share of net assets 18,338.2<br />
All amounts in TEUR <strong>2006</strong>/<strong>07</strong><br />
Revenues 0.0<br />
Revaluation 0.0<br />
Operating profit (EBIT) -20.2<br />
Financial results -73.3<br />
Income taxes -3.7<br />
Net profit for the period -97.1<br />
Segment SEE<br />
Location of property Romania<br />
Company Eye Shop Targu Jiu s.r.l.<br />
Date of initial consolidation 19.2.20<strong>07</strong><br />
All amounts in TEUR<br />
Notes<br />
Cash and cash equivalents 715,9<br />
Receivables and other assets 1,4<br />
Deferred tax assets 114,3<br />
Property 771,5<br />
Other liabilities -1,479,7<br />
Deferred tax liabilities -115,3<br />
Acquired net assets 8,1<br />
(Negative) goodwill -8,1<br />
Purchase price paid in cash 0,0<br />
Less cash and cash equivalents acquired -715,9<br />
Net purchase price for property company -715,8<br />
All amounts in TEUR 30 April 20<strong>07</strong><br />
Property 788,4<br />
Other non-current assets 0,0<br />
Current assets 116,6<br />
Non-current liabilities 0,0<br />
Current liabilities -177,6<br />
Proportional share of net assets 727,5<br />
All amounts in TEUR <strong>2006</strong>/<strong>07</strong><br />
Revenues 0,0<br />
Revaluation 0,0<br />
Operating profit (EBIT) -0,1<br />
Financial results -7,3<br />
Income taxes 0,0<br />
Net profit for the period -7,5<br />
<strong>Report</strong> by the Executive Board 151<br />
Highlights <strong>2006</strong>/<strong>07</strong><br />
Business Model and Strategy<br />
Portfolio Structure<br />
Corporate Governance and Outlook<br />
Property Portfolio<br />
Development of Business<br />
Consolidated Financial Statements<br />
Service and Glossary
152 <strong>IMMOEAST</strong> <strong>Annual</strong> <strong>Report</strong> <strong>2006</strong>/<strong>07</strong><br />
2.3.3.3.11LogCenterPloiestis.r.l.,LogCenterIasis.r.l.andLogCenterBrasovs.r.l<br />
A further transaction during the fourth quarter involved the purchase of 50% of the shares in the Romanian Log Center<br />
Ploiesti s.r.l., Log Center Iasi s.r.l. and Log Center Brasov s.r.l A logistics portfolio will be compiled through a joint venture<br />
with the developer Eyemaxx. The objects will be situated at major economic and industrial sites in the regional<br />
cities of Romania, which are undersupplied with modern warehouse and logistics facilities at the present time. The<br />
realisation of these projects is planned to take place over the coming three to five years.<br />
The following table shows the acquired assets and liabilities at fair value as well as the consolidated proportional<br />
share of net assets at the individual company level as of the balance sheet date and the income statement of the<br />
company for the period from the acquisition date to the balance sheet date, which is included in the consolidated<br />
financial statements:<br />
Segment SEE<br />
Location of property Romania<br />
Company Log Center Ploiesti s.r.l. Log Center Brasov s.r.l. Log Center Iasi s.r.l.<br />
Date of initial consolidation 19.2.20<strong>07</strong> 19.2.20<strong>07</strong> 29.3.20<strong>07</strong><br />
All amounts in TEUR<br />
Cash and cash equivalents 3.8 0.0 0.0<br />
Receivables and other assets 0.0 0.8 0.0<br />
Deferred tax assets 0.5 0.0 0.0<br />
Property 3,921.3 0.0 0.0<br />
Financial liabilities 0.0 0.0 -0.1<br />
Trade accounts payable -3.3 -1.9 0.0<br />
Other liabilities -3,900.6 -3.2 0.0<br />
Deferred tax liabilities -6.1 0.0 0.0<br />
Acquired net assets 15.7 -4.2 -0.1<br />
(Negative) goodwill -15.7 4.2 0.1<br />
Purchase price paid in cash 0.0 0.0 0.0<br />
Less cash and cash equivalents acquired -3.8 0.0 0.0<br />
Net purchase price for property company -3.8 0.0 0.0<br />
All amounts in TEUR 30 April 20<strong>07</strong><br />
Property 4,0<strong>07</strong>.1 0.0 0.0<br />
Other non-current assets 2.3 2.8 0.0<br />
Current assets 54.7 24.8 0.0<br />
Non-current liabilities -146.2 0.0 0.0<br />
Current liabilities -2,145.9 -35.0 -0.1<br />
Proportional share of net assets 1,772.1 -7.4 -0.1<br />
All amounts in TEUR <strong>2006</strong>/<strong>07</strong><br />
Revenues 0.0 0.0 0.0<br />
Revaluation 0.0 0.0 0.0<br />
Operating profit (EBIT) -27.6 -17.2 -0.1<br />
Financial results -5.1 0.0 0.0<br />
Income taxes 3.8 2.7 0.0<br />
Net profit for the period -28.9 -14.5 -0.1
2.3.3.3.12 S.C. Union Investitii s.r.l.<br />
The Euromall Galati Shopping Center, a joint venture<br />
project in Romania, was stated at the end of March<br />
20<strong>07</strong> through the acquisition of the Romanian S.C.<br />
Union Investitii s.r.l. This project includes the construction<br />
and development of a modern shopping<br />
centre. In addition to shops, the Euromall Galati<br />
will also contain an entertainment area and a food<br />
court. The site is located at the centre of Galati near<br />
the main Domneasca road, it can be easily reached<br />
by private transportation and is opposite the bus<br />
terminal and also close to the main railway station.<br />
The completion of this project is planned for the end<br />
of 20<strong>07</strong>.<br />
The following table shows the acquired assets and<br />
liabilities at fair value as well as the consolidated<br />
proportional share of net assets at the individual<br />
company level as of the balance sheet date and the<br />
income statement of the company for the period<br />
from the acquisition date to the balance sheet date,<br />
which is included in the consolidated financial<br />
statements:<br />
Location of property Romania<br />
Company S.C. Union Investitii S.r.l.<br />
Date of initial consolidation 7.3.20<strong>07</strong><br />
All amounts in TEUR<br />
Cash and cash equivalents 126.9<br />
Receivables and other assets 103.6<br />
Deferred tax assets 0.2<br />
Property 8,659.7<br />
Trade accounts payable -120.3<br />
Other liabilities -1,180.4<br />
Provisions -2.2<br />
Deferred tax liabilities -1,221.8<br />
Currency translation adjustment 40.9<br />
Acquired net assets 6,406.5<br />
(Negative) goodwill 2,429.3<br />
Purchase price paid in cash 8,835.9<br />
Less cash and cash equivalents acquired -126.9<br />
Net purchase price for property company 8,709.0<br />
All amounts in TEUR 30 April 20<strong>07</strong><br />
Property 9,057.3<br />
Other non-current assets 2,486.7<br />
Current assets 283.8<br />
Non-current liabilities -1,265.6<br />
Current liabilities -1,563.0<br />
Proportional share of net assets 8,999.2<br />
All amounts in TEUR <strong>2006</strong>/<strong>07</strong><br />
Revenues 0.0<br />
Revaluation 0.0<br />
Operating profit (EBIT) 15.4<br />
Financial results -4.6<br />
Income taxes 0.7<br />
Net profit for the period 11.5<br />
2.3.3.3.13 S.C. Valero invest s.r.l. and Baneasa 6981 s.r.l.<br />
At the end of <strong>2006</strong>/<strong>07</strong> <strong>IMMOEAST</strong> acquired 100% of the shares in two Romanian companies, S.C Valero invest s.r.l.<br />
and S.C. Baneasa 6981 s.r.l., and thereby took over the Victoria Park office complex, a joint project under development<br />
by these firms in Bucharest. This project involves the construction of a class A office complex, which will comprise<br />
four connected building sections. The site is located in the northern part of Baneasa, only 9 km from the city<br />
centre and 5 km from the airport. The surrounding area is considered to be the political centre of the city because the<br />
Romanian government and numerous embassies are situated here.<br />
Notes<br />
<strong>Report</strong> by the Executive Board 153<br />
Highlights <strong>2006</strong>/<strong>07</strong><br />
Business Model and Strategy<br />
Portfolio Structure<br />
Corporate Governance and Outlook<br />
Property Portfolio<br />
Development of Business<br />
Consolidated Financial Statements<br />
Service and Glossary
154 <strong>IMMOEAST</strong> <strong>Annual</strong> <strong>Report</strong> <strong>2006</strong>/<strong>07</strong><br />
The following table shows the acquired assets and liabilities at fair value as well as the consolidated proportional<br />
share of net assets at the individual company level as of the balance sheet date and the income statements of the<br />
companies for the period from the acquisition date to the balance sheet date, which are included in the consolidated<br />
financial statements:<br />
Segment SEE<br />
Location of property Romania<br />
Company S.C. Valero Invest s.r.l. S.C. Baneasa 6981 s.r.l.<br />
Date of initial consolidation 20.3.20<strong>07</strong> 5.4.20<strong>07</strong><br />
All amounts in TEUR<br />
Cash and cash equivalents 18,041.4 701.5<br />
Receivables and other assets 1,015.9 900.1<br />
Deferred tax assets 9.0 120.0<br />
Property 17,954.9 38,478.7<br />
Financial liabilities -3,113.2 -10,317.4<br />
Trade accounts payable -199.8 -680.1<br />
Other liabilities -21,788.1 -1,369.3<br />
Deferred tax liabilities -1,812.5 -4,176.9<br />
Currency translation adjustment 203.2 528.0<br />
Acquired net assets 10,310.9 24,184.6<br />
(Negative) goodwill 466.0 2,368.5<br />
Purchase price paid in cash 10,776.9 26,553.1<br />
Less cash and cash equivalents acquired -18,041.4 -701.5<br />
Net purchase price for property company -7,264.5 25,851.6<br />
All amounts in TEUR 30 April 20<strong>07</strong><br />
Property 21,624.0 40,213.1<br />
Other non-current assets 476.2 2,758.8<br />
Current assets 2,449.5 1,636.3<br />
Non-current liabilities -2,948.7 -14,471.5<br />
Current liabilities -1,547.5 -2,015.3<br />
Proportional share of net assets 20,053.5 28,121.5<br />
All amounts in TEUR <strong>2006</strong>/<strong>07</strong><br />
Revenues 117.5 59.7<br />
Revaluation 3,201.4 0.0<br />
Operating profit (EBIT) 3,226.6 85.0<br />
Financial results -60.4 -9.8<br />
Income taxes -516.9 -12.0<br />
Net profit for the period 2,649.2 63.1
2.3.3.4 Regional subsegment Serbia<br />
2.3.3.4.1 OCEAN ATLANTIC DORCOL DOO<br />
<strong>IMMOEAST</strong> also completed its first investments in Serbia during the second quarter of the <strong>2006</strong>/<strong>07</strong> Business Year.<br />
An 80% stake in OCEAN ATLANTIC DORCOL DOO, a company with headquarters in Belgrade, was acquired as of<br />
24 August <strong>2006</strong>, this transaction added the Francuska residential project to the <strong>IMMOEAST</strong> portfolio. The project<br />
entails the construction of 130 apartments and 184 underground garage spaces.<br />
The following table shows the acquired assets and liabilities at fair value as well as the consolidated proportional<br />
share of net assets at the individual company level as of the balance sheet date and the income statement of the<br />
company for the period from the acquisition date to the balance sheet date, which is included in the consolidated<br />
financial statements:<br />
Segment SEE<br />
Location of property Serbia<br />
Company OCEAN ATLANTIC DORCOL DOO<br />
Date of initial consolidation 24.8.<strong>2006</strong><br />
All amounts in TEUR<br />
Cash and cash equivalents 917.4<br />
Receivables and other assets 1,823.6<br />
Trade accounts payable -985.8<br />
Other liabilities -1,714.8<br />
Provisions -9.9<br />
Minority interests -6.1<br />
Acquired net assets 24.5<br />
(Negative) goodwill 138.2<br />
Purchase price paid in cash 162.7<br />
Less cash and cash equivalents acquired -917.4<br />
Net purchase price for property company -754.7<br />
Notes<br />
All amounts in TEUR 30 April 20<strong>07</strong><br />
Property 0.0<br />
Other non-current assets 18.9<br />
Current assets 3,514.3<br />
Non-current liabilities -912.9<br />
Current liabilities -861.8<br />
Proportional share of net assets 1,758.5<br />
All amounts in TEUR <strong>2006</strong>/<strong>07</strong><br />
Revenues 1.2<br />
Revaluation 0.0<br />
Operating profit (EBIT) -258.3<br />
Financial results -19.5<br />
Income taxes 14.0<br />
Net profit for the period -263.9<br />
<strong>Report</strong> by the Executive Board 155<br />
Highlights <strong>2006</strong>/<strong>07</strong><br />
Business Model and Strategy<br />
Portfolio Structure<br />
Corporate Governance and Outlook<br />
Property Portfolio<br />
Development of Business<br />
Consolidated Financial Statements<br />
Service and Glossary
156 <strong>IMMOEAST</strong> <strong>Annual</strong> <strong>Report</strong> <strong>2006</strong>/<strong>07</strong><br />
2.3.3.5 Regional subsegment Slovenia<br />
2.3.3.5.1 Alpha Real d.o.o. and Beta Real d.o.o.<br />
During the second quarter of the <strong>2006</strong>/<strong>07</strong> Business Year <strong>IMMOEAST</strong> also made its first investments in Slovenia by<br />
acquiring 100% of the shares in Alpha Real d.o.o. and Beta Real d.o.o. as of 30 September <strong>2006</strong>. These transactions<br />
led to the takeover of two specialty shopping centres in Kranj and Nove Mesto. The facilities are located at central<br />
sites in the respective cities and are fully let.<br />
The following table shows the acquired assets and liabilities at fair value as well as the consolidated proportional<br />
share of net assets at the individual company level as of the balance sheet date and the income statements of the<br />
companies for the period from the acquisition date to the balance sheet date, which are included in the consolidated<br />
financial statements:<br />
Location of property Slovenia<br />
Company Alpha real d.o.o. Beta real d.o.o.<br />
Date of initial consolidation 30.9.<strong>2006</strong> 30.9.<strong>2006</strong><br />
All amounts in TEUR<br />
Cash and cash equivalents 87.5 32.5<br />
Receivables and other assets 74.2 18.6<br />
Deferred tax assets 155.6 184.6<br />
Property 15,569.9 6,940.5<br />
Trade accounts payable -18.1 -104.3<br />
Other liabilities -19.7 -7.3<br />
Provisions -15.5 -14.1<br />
Deferred tax liabilities -1,540.8 -619.5<br />
Acquired net assets 14,293.2 6,431.0<br />
(Negative) goodwill 1,378.5 611.3<br />
Purchase price paid in cash 15,671.7 7,042.3<br />
Less cash and cash equivalents acquired -87.5 -32.5<br />
Net purchase price for property company 15,584.2 7,009.8<br />
All amounts in TEUR 30 April 20<strong>07</strong><br />
Property 21,943.8 9,385.5<br />
Other non-current assets 1,459.2 675.3<br />
Current assets 968.6 448.9<br />
Non-current liabilities -3,211.2 -1,267.1<br />
Current liabilities -263.2 -203.2<br />
Proportional share of net assets 20,897.2 9,039.4<br />
All amounts in TEUR <strong>2006</strong>/<strong>07</strong><br />
Revenues 758.1 354.9<br />
Revaluation 6,373.8 2,444.9<br />
Operating profit (EBIT) 6,815.9 2,590.1<br />
Financial results -0.1 -0.1<br />
Income taxes -1,785.9 -768.1<br />
Net profit for the period 5,029.9 1,821.9
2.3.4Impactofinitialconsolidations<br />
Point 2.3 presents the companies that were initially consolidated during <strong>2006</strong>/<strong>07</strong>. The previous section shows the<br />
impact of the acquisition or founding of major companies, while the following section presents the companies that<br />
hold investment property as defined in IAS 40. The following table shows the acquired assets and liabilities at fair<br />
value as well as the consolidated proportional share of net assets at the individual company level as of the balance<br />
sheet date and the income statement of the company for the period from the acquisition date to the balance sheet<br />
date, which is included in the consolidated financial statements:<br />
Segment CEE CEE CEE CEE CEE CEE<br />
Location of property Poland Poland Poland Poland Poland Poland<br />
Salzburg Center Xantium Equator Real Zenith Real Nimbus Real Cirrus Real<br />
Company Development S.A Sp. z o.o. Sp. z o.o. Sp. z o.o. Sp. z o.o. Sp. z o.o.<br />
Initial consolidation 31.7.<strong>2006</strong> 4.8.<strong>2006</strong> 28.8.<strong>2006</strong> 28.8.<strong>2006</strong> 28.8.<strong>2006</strong> 28.8.<strong>2006</strong><br />
All amounts in TEUR<br />
Cash and cash equivalents 1<strong>07</strong>.1 0.0 7.7 2.5 6.3 6.3<br />
Receivables and other assets 2,585.7 0.0 28.5 16.3 13.8 13.8<br />
Deferred tax assets 64.1 0.0 1.6 0.0 0.0 0.0<br />
Property 20,824.8 0.0 1,048.5 1,048.5 1,048.5 1,048.5<br />
Financial liabilities 0.0 0.0 -931.0 -639.9 -6<strong>07</strong>.2 -610.6<br />
Trade accounts payable -912.7 0.0 -18.1 -19.9 -17.5 -17.8<br />
Other liabilities -16,786.4 0.0 -133.4 -134.7 -104.8 -105.2<br />
Deferred tax liabilities -1,174.0 0.0 -43.8 -99.4 -106.0 -105.2<br />
Currency translation adjustment 7.5 12.0 -59.7 -56.3 -56.2 -56.2<br />
Acquired net assets 4,716.1 12.0 -99.6 117.1 177.0 173.6<br />
(Negative) goodwill -4,979.1 0.0 2,234.8 1,899.2 1,833.0 1,836.3<br />
Outstanding purchase price 0.0 0.0 0.0 0.0 0.0 0.0<br />
Purchase price paid in cash -263.0 12.0 2,135.2 2,016.3 2,009.9 2,009.9<br />
Less cash and cash equivalents acquired -1<strong>07</strong>.1 0.0 -7.7 -2.5 -6.3 -6.3<br />
Net purchase price for project company -370.2 12.0 2,127.4 2,013.9 2,003.6 2,003.7<br />
All amounts in TEUR 30 April 20<strong>07</strong><br />
Property 34,606.0 81,555.9 4,311.8 3,451.4 6,251.5 3,321.1<br />
Other non-current assets 190.5 586.6 357.5 573.0 1,112.3 552.9<br />
Current assets 2,659.1 20,437.7 399.9 33.6 36.1 35.8<br />
Non-current liabilities -3,821.8 -957.2 -3,286.2 -1,273.6 -1,774.6 -1,220.3<br />
Current liabilities -106.9 -380.6 -22.8 -2.8 -3.0 -2.7<br />
Proportional share of net assets 33,526.9 101,242.4 1,760.3 2,781.6 5,622.3 2,686.8<br />
All amounts in TEUR <strong>2006</strong>/<strong>07</strong><br />
Revenues 6.8 2,993.8 0.0 0.0 0.0 0.0<br />
Revaluation 13,312.5 719.8 1,574.0 2,360.6 5,126.5 2,232.0<br />
Operating profit (EBIT) 17,720.3 2,751.1 -370.0 1,003.9 4,369.7 921.3<br />
Financial results 108.9 -1,374.0 83.2 -23.1 -21.7 -21.5<br />
Notes<br />
Income taxes -2,477.5 -327.8 -301.3 -439.6 -964.2 -416.2<br />
Net profit for the period 15,351.7 1,049.4 -588.2 541.2 3.383.8 483.7<br />
<strong>Report</strong> by the Executive Board 157<br />
Highlights <strong>2006</strong>/<strong>07</strong><br />
Business Model and Strategy<br />
Portfolio Structure<br />
Corporate Governance and Outlook<br />
Property Portfolio<br />
Development of Business<br />
Consolidated Financial Statements<br />
Service and Glossary
158 <strong>IMMOEAST</strong> <strong>Annual</strong> <strong>Report</strong> <strong>2006</strong>/<strong>07</strong><br />
Segment CEE CEE CEE CEE CEE CEE<br />
Location of property Poland Poland Poland Slovakia Slovakia Slovakia<br />
Fobos Investment Passat Real Immoeast Dunaj STOP.SHOP.<br />
Company MBP I Sp. z o.o. Sp. z o.o. Sp. z o.o. s.r.o. SCT s.r.o. Zvolen s.r.o.<br />
Initial consolidation 1.11.<strong>2006</strong> 14.12.<strong>2006</strong> 27.3.20<strong>07</strong> 14.6.<strong>2006</strong> 21.12.<strong>2006</strong> 19.2.20<strong>07</strong><br />
All amounts in TEUR<br />
Cash and cash equivalents 0.0 0.0 69.5 0.0 309.6 0.0<br />
Receivables and other assets 0.0 6.5 205.3 0.0 444.9 0.0<br />
Deferred tax assets 0.0 0.0 49.2 0.0 17.4 0.0<br />
Property 0.0 0.0 28,344.4 0.0 11,724.1 0.0<br />
Financial liabilities 0.0 0.0 -12,616.1 0.0 -4,335.8 0.0<br />
Trade accounts payable 0.0 0.0 -23.9 0.0 -224.3 0.0<br />
Other liabilities 0.0 0.0 -1,776.4 0.0 -95.1 0.0<br />
Provisions 0.0 0.0 -14.6 0.0 -0.8 0.0<br />
Deferred tax liabilities 0.0 0.0 -2,821.2 0.0 -1,169.1 0.0<br />
Currency translation adjustment -99.6 1.4 -158.3 -4.1 218.1 0.0<br />
Acquired net assets -99.6 7.9 11,257.9 -4.1 6,889.2 0.0<br />
(Negative) goodwill 362.0 0.0 2,945.9 55.4 1,406.5 53.1<br />
Outstanding purchase price 0.0 0.0 0.0 0.0 0.0 0.0<br />
Purchase price paid in cash 262.4 7.9 14,203.8 51.3 8,295.7 53.1<br />
Less cash and cash equivalents acquired 0.0 0.0 -69.5 0.0 -309.6 0.0<br />
Net purchase price for project company 262.4 7.9 14,134.4 51.3 7,986.1 53.1<br />
All amounts in TEUR<br />
Property 127,942.0 547.0 28,741.2 14.8 15,204.0 419.4<br />
Other non-current assets 1,425.6 11.2 2,992.0 3.3 1,501.3 0.1<br />
Current assets 3,992.6 116.8 245.9 24.1 537.3 82.7<br />
Non-current liabilities -74,892.0 -8.2 -15,431.2 0.0 -6,060.9 0.0<br />
Current liabilities -1,292.9 -45.2 -135.4 -4.3 -477.7 -499.9<br />
Proportional share of net assets 57,175.3 621.5 16,412.4 37.9 10,704.0 2.3<br />
All amounts in TEUR<br />
Revenues 4,173.2 0.0 17.4 0.0 428.8 0.0<br />
Revaluation 16,837.8 0.0 45.1 0.0 2,695.7 0.0<br />
Operating profit (EBIT) 19,054.6 -5.8 -132.3 -74.4 2,902.6 -53.8<br />
Financial results -958.4 -25.6 295.7 2.3 33.1 0.0<br />
Income taxes -3,557.9 3.0 -58.7 3.1 -557.9 0.1<br />
Net profit for the period 14,538.2 -28.4 104.6 -68.9 2,377.8 -53.7
Segment CEE CEE CEE CEE CEE CEE<br />
Location of property Slovakia Czech Republic Czech Republic Czech Republic Czech Republic Czech Republic<br />
MY BOX Strakonice Aragonit Nakupni Centrum Nakupni Centrum MY BOX<br />
Company SCP s.r.o. s.r.o. s.r.o. Trebic s.r.o. AVENTIN Tabor s.r.o. Kolin s.r.o.<br />
Initial consolidation 19.3.20<strong>07</strong> 30.5.<strong>2006</strong> 1.7.<strong>2006</strong> 30.8.<strong>2006</strong> 18.9.<strong>2006</strong> 27.10.<strong>2006</strong><br />
All amounts in TEUR<br />
Cash and cash equivalents 1.4 3.6 247.5 0.1 280.4 3.1<br />
Receivables and other assets 0.2 0.0 121.3 2,399.4 0.0 0.0<br />
Deferred tax assets 42.7 0.0 0.0 2.2 0.7 0.1<br />
Property 0.2 0.0 11,690.9 0.0 134.3 0.0<br />
Financial liabilities 0.0 0.0 -5,404.3 0.0 0.0 0.0<br />
Trade accounts payable -0.1 0.0 -38.9 0.0 -53.6 0.0<br />
Other liabilities -223.1 0.0 -29.4 -2,405.0 -360.5 0.0<br />
Provisions -0.3 0.0 -99.3 0.0 0.0 0.0<br />
Deferred tax liabilities 0.0 0.0 -1,516.7 0.0 0.0 0.0<br />
Currency translation adjustment 2.4 0.0 -51.9 0.0 0.0 0.0<br />
Acquired net assets -176.7 3.6 4,919.2 -3.4 1.4 3.2<br />
(Negative) goodwill 209.4 4.4 1,699.4 21.3 0.9 2.3<br />
Outstanding purchase price 0.0 0.0 0.0 0.0 0.0 0.0<br />
Purchase price paid in cash 32.7 8.0 6,618.6 17.9 2.3 5.5<br />
Less cash and cash equivalents acquired -1.4 -3.6 -247.5 -0.1 -280.4 -3.1<br />
Net purchase price for project company 31.3 4.4 6,371.1 17.9 -278.2 2.4<br />
All amounts in TEUR<br />
Property 211.7 16.5 15,936.7 2,003.4 1,652.0 3.0<br />
Other non-current assets 46.0 1.7 1,727.1 24.2 9.0 1.1<br />
Current assets 29.5 7.7 595.9 529.8 54.3 23.7<br />
Non-current liabilities -30.2 -24.7 -7,686.5 0.0 0.0 -25.6<br />
Current liabilities -195.9 -2.7 -382.1 -3.5 -136.7 -2.1<br />
Proportional share of net assets 61.1 -1.6 10,191.1 2,553.9 1,578.6 0.2<br />
All amounts in TEUR<br />
Revenues 0.0 0.0 0.0 0.0 0.0 0.0<br />
Revaluation 0.0 0.0 4,159.7 0.0 0.0 0.0<br />
Operating profit (EBIT) -210.1 -11.2 4,406.2 -32.9 -13.3 -6.3<br />
Financial results -4.2 -0.2 -147.4 -185.5 -97.2 -0.2<br />
Notes<br />
Income taxes 0.9 1.7 -1,038.2 20.0 8.2 1.0<br />
Net profit for the period -213.4 -9.8 3,220.6 -198.4 -102.2 -5.4<br />
<strong>Report</strong> by the Executive Board 159<br />
Highlights <strong>2006</strong>/<strong>07</strong><br />
Business Model and Strategy<br />
Portfolio Structure<br />
Corporate Governance and Outlook<br />
Property Portfolio<br />
Development of Business<br />
Consolidated Financial Statements<br />
Service and Glossary
160 <strong>IMMOEAST</strong> <strong>Annual</strong> <strong>Report</strong> <strong>2006</strong>/<strong>07</strong><br />
Segment CEE CEE CEE CEE CEE CEE<br />
Location of property Czech Republic Czech Republic Czech Republic Czech Republic Czech Republic Czech Republic<br />
WINNIPEGIA MY BOX MY BOX MY BOX BB C –<br />
Company Diamant Real s.r.o. SHELF s.r.o. Rakovnik s.r.o. Sokolov s.r.o. Hranice s.r.o. Building A, k.s.<br />
Initial consolidation 31.10.<strong>2006</strong> 13.11.<strong>2006</strong> 20.11.<strong>2006</strong> 20.11.<strong>2006</strong> 20.11.<strong>2006</strong> 13.12.<strong>2006</strong><br />
All amounts in TEUR<br />
Cash and cash equivalents 212.0 7.3 3.5 3.5 3.5 5,512.3<br />
Receivables and other assets 512.9 0.0 0.0 0.0 0.0 1,217.0<br />
Deferred tax assets 590.9 0.0 0.3 0.0 0.0 136.4<br />
Property 36,543.5 0.0 0.0 0.0 0.0 64,335.5<br />
Financial liabilities -19,523.8 0.0 0.0 0.0 0.0 -31,570.0<br />
Trade accounts payable -411.5 0.0 -1.2 0.0 0.0 -53.2<br />
Other liabilities -173.5 -0.2 0.0 0.0 0.0 -2,619.0<br />
Provisions -2.5 0.0 0.0 0.0 0.0 -65.5<br />
Deferred tax liabilities -4,715.6 0.0 0.0 0.0 0.0 -9,316.9<br />
Currency translation adjustment 0.0 0.1 0.0 0.0 0.0 515.8<br />
Acquired net assets 13,032.5 7.1 2.6 3.5 3.5 28,092.4<br />
(Negative) goodwill 4,149.7 5.9 -1.8 -3.1 -3.0 9,155.5<br />
Outstanding purchase price 0.0 -57.8 0.0 0.0 0.0 0.0<br />
Purchase price paid in cash 17,182.1 -44.7 0.7 0.5 0.5 37,247.9<br />
Less cash and cash equivalents acquired -212.0 -7.3 -3.5 -3.5 -3.5 -5,512.3<br />
Net purchase price for project company 16,970.1 -52.0 -2.8 -3.1 -3.0 31,735.5<br />
All amounts in TEUR<br />
Property 47,930.3 35,149.0 38.3 4.5 963.2 71,243.3<br />
Other non-current assets 5,024.2 201.4 2.2 1.1 2.4 9,424.4<br />
Current assets 513.6 773.3 124.1 6.1 125.2 2,244.8<br />
Non-current liabilities -25,435.0 -2,<strong>07</strong>0.5 -18.0 -10.3 -81.2 -43,434.0<br />
Current liabilities -1,389.6 -422.0 -5.9 -1.4 -364.7 -1,489.6<br />
Proportional share of net assets 26,643.6 33,631.2 140.8 0.0 644.8 37,989.0<br />
All amounts in TEUR<br />
Revenues 1,021.1 829.9 0.0 0.0 0.0 1,595.9<br />
Revaluation 10,973.2 6,437.6 0.0 0.0 0.0 6,533.6<br />
Operating profit (EBIT) 11,639.0 6,834.8 -1.4 -1.4 -4.9 7,906.9<br />
Financial results -432.3 -824.1 -4.6 -0.2 -28.9 -833.6<br />
Income taxes -2,692.0 -1,546.4 1.9 1.1 2.4 -1,528.3<br />
Net profit for the period 8,514.7 4,464.4 -4.1 -0.4 -31.4 5,545.0
Segment CEE CEE CEE CEE CEE<br />
Location of property Czech Republic Czech Republic Czech Republic Czech Republic Czech Republic<br />
BB C – Building B, BB C – Building C, MY BOX MY BOX MY BOX Jablonec<br />
Company k.s. k.s. Pribram s.r.o. Breclav s.r.o. nad Nisou s.r.o.<br />
Initial consolidation 13.12.<strong>2006</strong> 13.12.<strong>2006</strong> 15.12.<strong>2006</strong> 12.2.20<strong>07</strong> 12.2.20<strong>07</strong><br />
All amounts in TEUR<br />
Cash and cash equivalents 2,213.3 513.7 78.5 1.6 1.6<br />
Receivables and other assets 1,403.1 1,680.8 17.8 0.2 0.2<br />
Deferred tax assets 243.9 0.0 0.2 0.2 0.5<br />
Property 53,610.8 40,132.8 6.8 0.1 0.0<br />
Financial liabilities -20,147.1 0.0 -9.9 0.0 0.0<br />
Trade accounts payable -1,153.4 -203.7 -1.3 -0.4 -0.4<br />
Other liabilities -871.1 -19,273.7 -89.3 0.0 0.0<br />
Provisions -85.4 -116.6 0.0 0.0 0.0<br />
Deferred tax liabilities -8,715.1 -5,912.4 0.0 0.0 0.0<br />
Currency translation adjustment 491.1 319.6 0.0 0.0 0.0<br />
Acquired net assets 26,990.1 17,140.5 2.8 1.7 1.9<br />
(Negative) goodwill 8,470.4 5,938.8 -2.4 -1.4 -1.7<br />
Purchase price paid in cash 35,460.5 23,<strong>07</strong>9.3 0.4 0.2 0.2<br />
Less cash and cash equivalents acquired -2,213.3 -513.7 -78.5 -1.6 -1.6<br />
Net purchase price for project company 33,247.2 22,565.6 -78.1 -1.3 -1.4<br />
All amounts in TEUR<br />
Property 43,637.4 60,905.9 64.4 0.1 0.0<br />
Other non-current assets 6,642.2 5,976.5 5.2 0.8 1.0<br />
Current assets 1,954.4 1,971.7 100.8 0.6 0.7<br />
Non-current liabilities -26,687.2 -26,768.1 -18.0 0.0 0.0<br />
Current liabilities -2,128.8 -1,373.4 -9.4 -1.5 -1.5<br />
Proportional share of net assets 23,418.0 40,712.7 142.9 0.0 0.3<br />
All amounts in TEUR<br />
Revenues 1,753.2 1,353.9 0.0 0.0 0.0<br />
Revaluation -10,202.6 20,410.2 0.0 0.0 0.0<br />
Operating profit (EBIT) -11,483.6 21,170.8 0.6 -0.8 -0.5<br />
Financial results -383.5 -493.5 -4.4 0.0 0.0<br />
Notes<br />
Income taxes 2,490.4 -4,875.0 2.2 0.5 0.5<br />
Net profit for the period -9,376.7 15,802.4 -1.6 -0.2 0.0<br />
<strong>Report</strong> by the Executive Board 161<br />
Highlights <strong>2006</strong>/<strong>07</strong><br />
Business Model and Strategy<br />
Portfolio Structure<br />
Corporate Governance and Outlook<br />
Property Portfolio<br />
Development of Business<br />
Consolidated Financial Statements<br />
Service and Glossary
162 <strong>IMMOEAST</strong> <strong>Annual</strong> <strong>Report</strong> <strong>2006</strong>/<strong>07</strong><br />
Segment CEE CEE CEE CEE CEE<br />
Location of property Czech Republic Czech Republic Czech Republic Hungary Hungary<br />
STOP.SHOP. STOP.SHOP.<br />
Company Centre Investments s.r.o. Brno Estates a.s. Delta Park a.s. TB Kft. BCS Kft.<br />
Initial consolidation 28.2.20<strong>07</strong> 28.2.20<strong>07</strong> 1.3.20<strong>07</strong> 8.6.<strong>2006</strong> 8.6.<strong>2006</strong><br />
All amounts in TEUR<br />
Cash and cash equivalents 557.0 1,211.8 84.9 0.0 0.0<br />
Receivables and other assets 456.3 686.6 584.6 0.0 0.0<br />
Deferred tax assets 686.9 315.3 213.7 0.0 0.0<br />
Property 16,191.0 56,955.4 47,680.4 0.0 0.0<br />
Financial liabilities -3,699.1 -18,895.0 -13,759.9 0.0 0.0<br />
Trade accounts payable -33.4 -1,889.2 -177.4 0.0 0.0<br />
Other liabilities -360.1 -272.7 -7,405.8 0.0 0.0<br />
Provisions -100.1 0.0 0.0 0.0 0.0<br />
Deferred tax liabilities -3,148.0 -9,334.3 -6,858.0 0.0 0.0<br />
Currency translation adjustment -12.1 -41.9 44.9 -0.2 -0.2<br />
Acquired net assets 10,538.3 28,735.9 20,4<strong>07</strong>.5 -0.2 -0.2<br />
(Negative) goodwill 4,042.3 21,683.5 6,899.9 0.0 0.0<br />
Purchase price paid in cash 14,580.6 50,419.4 27,3<strong>07</strong>.4 -0.2 -0.2<br />
Less cash and cash equivalents acquired -557.0 -1,211.8 -84.9 0.0 0.0<br />
Net purchase price for project company 14,023.7 49,2<strong>07</strong>.6 27,222.4 -0.2 -0.2<br />
All amounts in TEUR<br />
Property 17,114.6 79,028.2 44,949.8 405.1 399.1<br />
Other non-current assets 3,387.7 14,7<strong>07</strong>.0 6,523.0 2.7 2.9<br />
Current assets 1,663.9 2,271.2 1,042.1 88.8 1,065.7<br />
Non-current liabilities -6,938.3 -30,619.8 -19,273.9 -0.4 0.0<br />
Current liabilities -541.0 -927.1 -2,108.8 -10.4 -129.8<br />
Proportional share of net assets 14,686.9 64,459.5 31,132.3 485.8 1,338.0<br />
All amounts in TEUR<br />
Revenues 138.8 200.8 443.4 0.0 0.0<br />
Revaluation 833.7 20,241.3 -2,983.2 0.0 0.0<br />
Operating profit (EBIT) 161.1 12,715.8 -3,448.3 -13.6 -11.8<br />
Financial results -12.4 -77.1 -167.5 2.3 -2.9<br />
Income taxes -192.1 -4,838.4 700.6 1.8 2.4<br />
Net profit for the period -43.3 7,800.3 -2,915.2 -9.5 -12.4
Segment CEE CIS CIS CIS CIS<br />
Location of property Hungary Russia Russia Russia Russia<br />
Central Business Rt. Wakelin Krona Design OAO Kashirskij OOO Torgoviy<br />
Company Center Rt. Promotions Limited LLC Dvor-Severyanin Dom Na Khodinke<br />
Initial consolidation 15.1.20<strong>07</strong> 21.6.<strong>2006</strong> 21.6.<strong>2006</strong> 30.10.<strong>2006</strong> 30.11.<strong>2006</strong><br />
All amounts in TEUR<br />
Cash and cash equivalents 1,<strong>07</strong>7.2 535.1 627.6 0.4 129.9<br />
Financial instruments 0.0 31,642.3 0.0 0.0 0.0<br />
Receivables and other assets 684.1 13,303.0 2,767.1 319.3 2,788.3<br />
Deferred tax assets 4.7 0.0 10.0 428.8 253.7<br />
Property 20,710.0 140,808.1 56,794.2 38,701.0 109,717.0<br />
Financial liabilities 0.0 -1,120.5 -4,224.2 -2,879.1 -191.4<br />
Trade accounts payable -40.9 0.0 -153.9 0.0 0.0<br />
Other liabilities -5,280.6 -2,580.6 -14,190.2 -31.0 -26,396.0<br />
Provisions 0.0 -47.4 -20.5 0.0 0.0<br />
Deferred tax liabilities -1,809.5 -31,488.0 -9,967.9 -8,960.6 -21,104.2<br />
Currency translation adjustment 243.3 2,706.3 0.0 328.0 -416.2<br />
Acquired net assets 15,588.3 153,758.3 31,642.3 27,906.8 64,781.1<br />
(Negative) goodwill 2,033.6 50,958.1 0.0 0.0 1.1<br />
Outstanding purchase price 0.0 0.0 0.0 0.0 0.0<br />
Purchase price paid in cash 17,621.9 204,716.4 31,642.3 27,906.8 64,782.2<br />
Less cash and cash equivalents acquired -1,<strong>07</strong>7.2 -535.1 -627.6 -0.4 -129.9<br />
Net purchase price for project company 16,544.7 204,181.3 31,014.7 27,906.4 64,652.3<br />
All amounts in TEUR<br />
Property 20,481.7 159,500.2 73,134.9 42,222.1 119,845.6<br />
Other non-current assets 1,855.2 50,509.9 1,681.5 940.3 592.2<br />
Current assets 1,721.2 5,153.4 2,455.2 2,202.4 3,555.4<br />
Non-current liabilities -1,883.2 -36,916.5 -14,617.8 -8,868.2 -24,477.9<br />
Current liabilities -135.1 -792.5 -525.1 -1,886.7 -648.0<br />
Proportional share of net assets 22,039.7 177,454.4 62,128.7 34,609.9 98,867.3<br />
All amounts in TEUR<br />
Revenues 186.8 14,440.7 5,121.3 12.5 5,152.1<br />
Revaluation -905.4 20,709.4 17,155.3 0.0 11,582.7<br />
Operating profit (EBIT) -1,298.0 30,583.8 19,635.5 -65.2 15,512.3<br />
Financial results 62.0 -75.1 20.6 -565.8 -1,730.0<br />
Notes<br />
Income taxes 144.1 -7,631.1 -5,043.3 119.1 -3,485.2<br />
Net profit for the period -1,092.0 22,877.7 14,612.8 -511.9 10,297.1<br />
<strong>Report</strong> by the Executive Board 163<br />
Highlights <strong>2006</strong>/<strong>07</strong><br />
Business Model and Strategy<br />
Portfolio Structure<br />
Corporate Governance and Outlook<br />
Property Portfolio<br />
Development of Business<br />
Consolidated Financial Statements<br />
Service and Glossary
164 <strong>IMMOEAST</strong> <strong>Annual</strong> <strong>Report</strong> <strong>2006</strong>/<strong>07</strong><br />
Segment CIS SEE SEE SEE SEE<br />
Location of property Ukraine Bulgaria Croatia Croatia Romania<br />
Business Park Grand Zagreb Grand Centar S.C. Almera<br />
Company Alacor City LLC West-Sofia EAD d.o.o. d.o.o. New Capital s.r.l.<br />
Initial consolidation 10.1.20<strong>07</strong> 12.12.<strong>2006</strong> 30.11.<strong>2006</strong> 30.11.<strong>2006</strong> 13.7.<strong>2006</strong><br />
All amounts in TEUR<br />
Cash and cash equivalents 1.7 2.508.2 41.7 0.1 0.0<br />
Financial instruments 0.0 0.0 10,249.9 0.0 0.0<br />
Receivables and other assets 8.3 1,994.6 579.5 721.5 0.0<br />
Deferred tax assets 10.1 0.0 63.3 49.1 0.4<br />
Property 2,727.5 22,694.7 164.2 39,400.0 204.5<br />
Financial liabilities 0.0 0.0 -361.0 0.0 -88.0<br />
Trade accounts payable 0.0 0.0 -43.5 -49.7 0.0<br />
Other liabilities -1,391.1 -14,709.8 -618.4 -26,279.8 -120.8<br />
Provisions 0.0 0.0 -14.0 0.0 0.0<br />
Deferred tax liabilities -348.1 -1,223.2 -746.8 -2,844.5 0.0<br />
Currency translation adjustment 0.0 0.0 0.0 0.0 -0.2<br />
Acquired net assets 1,008.4 11,264.5 9,315.1 10,996.7 -4.2<br />
(Negative) goodwill 0.0 0.0 2,487.8 0.0 4.2<br />
Outstanding purchase price 0.0 0.0 0.0 0.0 0.0<br />
Purchase price paid in cash 1,008.4 11,264.5 11,802.9 10,996.7 0.0<br />
Less cash and cash equivalents acquired -1.7 -2,508.2 -41.7 -0.1 0.0<br />
Net purchase price for project company 1,006.7 8,756.3 11,761.2 10,996.7 0.0<br />
All amounts in TEUR<br />
Property 2,760.8 102,881.3 164.2 45,608.2 4,467.6<br />
Other non-current assets 28.6 486.8 2,609.8 0.0 19.4<br />
Current assets 2.9 2,155.5 1,532.3 731.4 969.1<br />
Non-current liabilities -341.5 -9,189.3 -0.3 -4,132.6 -1,261.1<br />
Current liabilities -0.5 -56.7 -780.0 -145.1 -1,<strong>07</strong>6.2<br />
Proportional share of net assets 2,450.3 96,277.7 3,525.8 42,062.0 3,118.8<br />
All amounts in TEUR<br />
Revenues 0.0 482.5 971.4 618.3 0.0<br />
Revaluation 0.0 78,740.4 0.0 6,208.2 0.0<br />
Operating profit (EBIT) -2.7 78,932.0 -256.3 7,606.7 -384.3<br />
Financial results -40.5 -429.6 1.6 -685.9 32.7<br />
Income taxes 10.7 -7,851.1 50.9 -1,390.7 18.6<br />
Net profit for the period -32.5 70.651.4 -203.8 5,530.1 -333.0
Segment SEE SEE SEE SEE SEE<br />
Location of property Romania Romania Romania Romania Romania<br />
S.C. Meteo Klyos Media SBACARO Logistic Contractor FMZ TM<br />
Company Business Park s.r.l. s.r.l. s.r.l. s.r.l. s.r.l.<br />
Initial consolidation 27.7.<strong>2006</strong> 4.8.<strong>2006</strong> 15.12.<strong>2006</strong> 18.12.<strong>2006</strong> 22.12.<strong>2006</strong><br />
All amounts in TEUR<br />
Cash and cash equivalents 2,377.1 0.7 0.0 0.0 0.0<br />
Receivables and other assets 172.4 46.2 0.0 0.0 0.0<br />
Deferred tax assets 11.6 0.0 0.0 0.0 0.0<br />
Property 9,849.6 12,035.4 0.0 0.0 0.0<br />
Financial liabilities -4,797.9 0.0 0.0 0.0 0.0<br />
Financial liabilities, limited partnership interest 0.0 0.0 0.0 0.0 0.0<br />
Trade accounts payable -46.1 -8,929.1 0.0 0.0 0.0<br />
Other liabilities -3,669.9 -3,123.6 0.0 -3.5 0.0<br />
Deferred tax liabilities -663.5 0.0 0.0 0.0 0.0<br />
Currency translation adjustment -198.5 8.1 0.1 -20.0 0.1<br />
Minority interest 0.0 -3.0 0.0 0.0 0.0<br />
Acquired net assets 3,034.7 34.7 0.1 -23.4 0.1<br />
(Negative) goodwill 1,472.0 46.2 0.0 4,181.7 0.0<br />
Outstanding purchase price 0.0 0.0 0.0 0.0 -112.1<br />
Purchase price paid in cash 4,506.7 80.9 0.1 4,158.3 -112.0<br />
Less cash and cash equivalents acquired -2,377.1 -0.7 0.0 0.0 0.0<br />
Net purchase price for project company 2,129.6 80.2 0.1 4,158.2 -112.0<br />
All amounts in TEUR<br />
Property 29,951.5 48,257.5 2,167.4 10,320.1 1,842.2<br />
Other non-current assets 1,548.3 0.0 6.0 3.9 6.3<br />
Current assets 1,745.5 609.0 39.0 139.5 56.0<br />
Non-current liabilities -3,798.4 -6,515.0 0.0 0.0 -0.2<br />
Current liabilities -4,978.4 -4,292.2 -3.1 -9.9 -118.1<br />
Proportional share of net assets 24,468.4 38,059.3 2,209.3 10,453.7 1,786.2<br />
All amounts in TEUR<br />
Revenues 0.0 0.0 0.0 0.0 0.0<br />
Revaluation 19,084.7 32,543.7 0.0 0.0 0.0<br />
Operating profit (EBIT) 19,105.5 32,466.2 -8.7 -4,258.4 -36.1<br />
Financial results -45.1 -0.1 -30.4 35.8 -1.5<br />
Notes<br />
Income taxes -3,021.0 -5,285.1 5.9 3.8 6.0<br />
Net profit for the period 16,039.3 27,181.0 -33.3 -4,218.8 -31.6<br />
<strong>Report</strong> by the Executive Board 165<br />
Highlights <strong>2006</strong>/<strong>07</strong><br />
Business Model and Strategy<br />
Portfolio Structure<br />
Corporate Governance and Outlook<br />
Property Portfolio<br />
Development of Business<br />
Consolidated Financial Statements<br />
Service and Glossary
166 <strong>IMMOEAST</strong> <strong>Annual</strong> <strong>Report</strong> <strong>2006</strong>/<strong>07</strong><br />
Segment SEE SEE SEE SEE SEE<br />
Location of property Romania Romania Romania Romania Romania<br />
S.C. Arbor S.C. IE Baneasa Eye Shop Log Center <strong>IMMOEAST</strong> Iride<br />
Company Corporation s.r.l. Project s.r.l. Targu Jiu s.r.l. Ploiesti s.r.l. IV Project s.r.l.<br />
Initial consolidation 29.1.20<strong>07</strong> 1.2.20<strong>07</strong> 19.2.20<strong>07</strong> 19.2.20<strong>07</strong> 1.3.20<strong>07</strong><br />
All amounts in TEUR<br />
Cash and cash equivalents 3,337.9 0.0 715.9 3.8 0.0<br />
Receivables and other assets 4.2 0.0 1.4 0.0 0.0<br />
Deferred tax assets 0.9 0.0 114.3 0.5 0.0<br />
Property 626.5 0.0 771.5 3,921.3 0.0<br />
Financial liabilities 0.0 0.0 0.0 0.0 0.0<br />
Trade accounts payable 0.0 0.0 0.0 -3.3 0.0<br />
Other liabilities -3,979.4 0.0 -1,479.7 -3,900.6 0.0<br />
Deferred tax liabilities 0.0 0.0 -115.3 -6.1 0.0<br />
Minority interest 1.0 0.0 0.0 0.0 0.0<br />
Acquired net assets -8.8 0.0 8.1 15.7 0.0<br />
(Negative) goodwill 33.4 61.8 -8.1 -15.7 0.0<br />
Outstanding purchase price 0.0 0.0 0.0 0.0 0.0<br />
Purchase price paid in cash 24.6 61.8 0.0 0.0 0.0<br />
Less cash and cash equivalents acquired -3,337.9 0.0 -715.9 -3.8 0.0<br />
Net purchase price for project company -3,313.3 61.8 -715.8 -3.8 0.0<br />
All amounts in TEUR<br />
Property 4,708.5 22,045.2 788.4 4,0<strong>07</strong>.1 5,265.2<br />
Other non-current assets 13.9 0.0 0.0 2.3 0.7<br />
Current assets 116.3 16,227.9 116.6 54.7 38.5<br />
Non-current liabilities 0.0 0.0 0.0 -146.2 -2.2<br />
Current liabilities -665.4 -19,934.9 -177.6 -2,145.9 -5.7<br />
Proportional share of net assets 4,173.2 18,338.2 727.5 1,772.1 5,296.6<br />
All amounts in TEUR<br />
Revenues 0.0 0.0 0.0 0.0 0.0<br />
Revaluation 0.0 0.0 0.0 0.0 0.0<br />
Operating profit (EBIT) -220.4 -20.2 -0.1 -27.6 9.0<br />
Financial results 3.7 -73.3 -7.3 -5.1 -70.8<br />
Income taxes 12.6 -3.7 0.0 3.8 -1.5<br />
Net profit for the period -204.1 -97.1 -7.5 -28.9 -63.3
Segment SEE SEE SEE SEE SEE<br />
Location of property Romania Romania Romania Slovenia Slovenia<br />
S.C. Union S.C. Valero S.C. Baneasa Alpha real Beta<br />
Company Investitii S.r.l. Invest s.r.l. 6981 s.r.l. d.o.o. real d.o.o.<br />
Initial consolidation 7.3.20<strong>07</strong> 20.3.20<strong>07</strong> 5.4.20<strong>07</strong> 30.9.<strong>2006</strong> 30.9.<strong>2006</strong><br />
All amounts in TEUR<br />
Cash and cash equivalents 126.9 18,041.4 701.5 87.5 32.5<br />
Receivables and other assets 103.6 1,015.9 900.1 74.2 18.6<br />
Deferred tax assets 0.2 9.0 120.0 155.6 184.6<br />
Property 8,659.7 17,954.9 38,478.7 15,569.9 6,940.5<br />
Financial liabilities 0.0 -3,113.2 -10,317.4 0.0 0.0<br />
Trade accounts payable -120.3 -199.8 -680.1 -18.1 -104.3<br />
Other liabilities -1,180.4 -21,788.1 -1,369.3 -19.7 -7.3<br />
Provisions -2.2 0.0 0.0 -15.5 -14.1<br />
Deferred tax liabilities -1,221.8 -1,812.5 -4,176.9 -1,540.8 -619.5<br />
Currency translation adjustment 40.9 203.2 528.0 0.0 0.0<br />
Acquired net assets 6,406.5 10,310.9 24,184.6 14,293.2 6,431.0<br />
(Negative) goodwill 2,429.3 466.0 2,368.5 1,378.5 611.3<br />
Outstanding purchase price 0.0 0.0 0.0 0.0 0.0<br />
Purchase price paid in cash 8,835.9 10,776.9 26,553.1 15,671.7 7,042.3<br />
Less cash and cash equivalents acquired -126.9 -18,041.4 -701.5 -87.5 -32.5<br />
Net purchase price for project company 8,709.0 -7,264.5 25,851.6 15,584.1 7,009.8<br />
All amounts in TEUR<br />
Property 9,057.3 21,624.0 40,213.1 21,943.8 9,385.5<br />
Other non-current assets 2,486.7 476.2 2,758.8 1,459.2 675.3<br />
Current assets 283.8 2,449.5 1,636.3 968.6 448.9<br />
Non-current liabilities -1,265.6 -2,948.7 -14,471.5 -3,211.2 -1,267.1<br />
Current liabilities -1,563.0 -1,547.5 -2,015.3 -263.2 -203.2<br />
Proportional share of net assets 8,999.2 20,053.5 28,121.5 20,897.2 9,039.4<br />
All amounts in TEUR<br />
Revenues 0.0 117.5 59.7 758.1 354.9<br />
Revaluation 0.0 3,201.4 0.0 6,373.8 2,444.9<br />
Operating profit (EBIT) 15.4 3,226.6 85.0 6,815.9 2,590.1<br />
Financial results -4.6 -60.4 -9.8 -0.1 -0.1<br />
Income taxes 0.7 -516.9 -12.0 -1,785.9 -768.1<br />
Net profit for the period 11.5 2,649.2 63.1 5,029.9 1,821.9<br />
For the CEE, CIS and SEE segments, the following table shows the acquired assets and liabilities at fair value as well<br />
as the consolidated proportional share of net assets at the individual company level as of the balance sheet date and<br />
the income statement of the companies for the period from the acquisition date to the balance sheet date, which are<br />
included in the consolidated financial statements:<br />
Notes<br />
<strong>Report</strong> by the Executive Board 167<br />
Highlights <strong>2006</strong>/<strong>07</strong><br />
Business Model and Strategy<br />
Portfolio Structure<br />
Corporate Governance and Outlook<br />
Property Portfolio<br />
Development of Business<br />
Consolidated Financial Statements<br />
Service and Glossary
168 <strong>IMMOEAST</strong> <strong>Annual</strong> <strong>Report</strong> <strong>2006</strong>/<strong>07</strong><br />
Segment<br />
All amounts in TEUR<br />
CEE CIS SEE<br />
Holding company,<br />
other and<br />
Group eliminations Total<br />
Cash and cash equivalents 12,763.3 1,298.8 32,674.8 878.0 47,614.9<br />
Receivables and other assets 19,069.4 19,186.3 53,451.4 2,603.4 94,310.5<br />
Deferred tax assets 2,406.9 702.7 771.9 411.4 4,292.9<br />
Property 413,<strong>07</strong>9.0 348,747.7 177,271.6 29,069.2 968,167.5<br />
Financial liabilities -133,683.7 -8,415.2 -43,859.2 -4,098.9 -190,057.1<br />
Trade accounts payable -5,959.8 -153.9 -11,626.7 -513.3 -18,253.7<br />
Other liabilities -58,723.3 -44,589.1 -90,093.5 -1,956.0 -195,361.9<br />
Provisions -488.3 -67.9 -55.8 -18.1 -630.0<br />
Deferred tax liabilities -57,392.7 -71,868.7 -17,000.5 -3,432.5 -149,694.4<br />
Currency translation adjustment 1,145.8 2,636.5 323.4 -6,556.7 -2,451.0<br />
Minority interest 0.0 0.0 -1,233.0 -6,166.5 -7,399.5<br />
Acquired net assets 192,216.5 247,477.2 100,624.4 10,224.1 550,542.3<br />
(Negative) goodwill 72,<strong>07</strong>5.4 18,298.5 8,194.0 102,087.3 200,655.1<br />
Outstanding purchase price -58.3 0.0 -112.1 -50,687.0 -50,857.4<br />
Purchase price paid in cash 264,233.6 265,775.7 108,706.3 61,624.4 700,340.0<br />
Less cash and cash equivalents acquired -12,763.3 -1,298.8 -32,674.8 -878.0 -47,614.9<br />
Net purchase price for project company 251,470.4 264,476.9 76,031.5 60,746.4 652,725.1<br />
All amounts in TEUR 30 April 20<strong>07</strong><br />
Property 748,504.3 397,463.5 384,698.3 0.0 1,530,666.1<br />
Other non-current assets 64,987.2 53,752.9 15,488.0 128,094.5 262,322.5<br />
Current assets 60,716.5 13,372.8 85,106.1 2,565.2 161,760.7<br />
Non-current liabilities -303,293.2 -85,221.8 -72,422.5 -23,259.4 -484,196.9<br />
Current liabilities -30,871.7 -3,853.0 -45,275.8 -31,267.6 -111,268.1<br />
Proportional share of net assets 539,971.6 375,514.4 367,594.1 76,132.7 1,359,212.9<br />
All amounts in TEUR <strong>2006</strong>/<strong>07</strong><br />
Revenues 16,865.0 24,726.6 3,363.8 0.0 44,955.4<br />
Revaluation 99,420.3 49,447.4 148,597.2 0.0 297,464.9<br />
Operating profit (EBIT) 94,702.9 65,663.0 145,385.2 -9,431.6 296,319.6<br />
Financial results -5,897.8 -2,390.8 -1,648.5 -4,515.2 -14,452.3<br />
Income taxes -22,183.4 -16,029.6 -20,484.0 -492.0 -59,188.9<br />
Net profit for the period 66,621.7 47,242.7 123,252.8 -14,438.8 222,678.4<br />
The carrying values of the individual assets and liabilities as defined in IFRS 3.67(f) are not provided because this<br />
information is impracticable to develop.<br />
Estimates for the revenues and profit or loss of acquired companies based on an assumed acquisition at the beginning<br />
of the reporting period is not provided because this information is impracticable to develop (IFRS 3.70).
2.3.5 Structural changes/change in consolidation method<br />
Structural changes represent the impact of shifts in investments in other companies between the parent company<br />
(<strong>IMMOEAST</strong>) and the minority shareholders of the relevant consolidated subsidiaries or companies included through<br />
proportionate consolidation which, in turn, have their own consolidated companies with minority interests. The term<br />
structural changes also includes the acquisition of shares in companies with minority interests, where these acquisitions<br />
have an impact on group equity, as well as<br />
partial deconsolidation measures and successive<br />
All amounts in TEUR Atom Centrum a.s.<br />
share purchases without transition consolidations<br />
that lead to a shift in the earned equity (either<br />
from the group’s share to minority interest, or the<br />
reverse) of enterprises in which the company that<br />
is partially deconsolidated has a controlling or joint<br />
management interest as defined in IAS 31.<br />
Cash and cash equivalents<br />
Receivables and other assets<br />
Deferred tax assets<br />
Property<br />
Tangible assets<br />
Financial liabilities<br />
Trade accounts payable<br />
903.1<br />
603.4<br />
288.9<br />
28,6<strong>07</strong>.5<br />
0.9<br />
-7,431.1<br />
-28.3<br />
The investment in Atom Centrum a.s. (office building<br />
Pankrac House) was increased from 50% to 100%<br />
as of 27 June <strong>2006</strong>, which resulted in a changeover<br />
from proportionate to full consolidation. The impact<br />
of the transition consolidation of this company is<br />
shown in the following table.<br />
Provisions<br />
Other liabilities<br />
Deferred tax liabilities<br />
Currency translation adjustment<br />
Acquired net assets<br />
(Negative) goodwill<br />
Outstanding purchase price<br />
0.0<br />
-499.5<br />
-4,941.6<br />
-1,121.9<br />
16,381.5<br />
7,606.0<br />
0.0<br />
Total purchase price 23,987.5<br />
Less cash and cash equivalents acquired -903.1<br />
Net purchase price for Atom Centrum a.s. 23,084.4<br />
In addition, IMAK CEE N.V. and IMAK Finance B.V.<br />
were acquired in full, these companies were founded<br />
in 2004/05 as joint venture between <strong>IMMOEAST</strong><br />
and the Akron Group, an Austrian property developer.<br />
<strong>IMMOEAST</strong> owned 56.6% of the shares up<br />
to this transaction. The purchase of the remaining<br />
shares resulted in a changeover from porportionate<br />
to full consolidation for these companies during the<br />
first quarter of the reporting year. The impact of the<br />
transition consolidation of the companies is shown<br />
in the following table.<br />
Notes<br />
All amounts in TEUR IMAK companies<br />
Cash and cash equivalents 2,873.4<br />
Receivables and other assets 2,088.9<br />
Deferred tax assets 1,394.9<br />
Property 134,226.2<br />
Tangible assets 44.3<br />
Financial liabilities -68,870.8<br />
Trade accounts payable -1,606.3<br />
Provisions -1,877.6<br />
Other liabilities -1,422.4<br />
Deferred tax liabilities -15,016.3<br />
Acquired net assets 51,834.4<br />
(Negative) goodwill 10,839.9<br />
Outstanding purchase price -3,475.2<br />
Total purchase price 59,199.1<br />
Less cash and cash equivalents acquired -2,873.4<br />
Net purchase price for property companies 56,325.7<br />
<strong>Report</strong> by the Executive Board 169<br />
Highlights <strong>2006</strong>/<strong>07</strong><br />
Business Model and Strategy<br />
Portfolio Structure<br />
Corporate Governance and Outlook<br />
Property Portfolio<br />
Development of Business<br />
Consolidated Financial Statements<br />
Service and Glossary
170 <strong>IMMOEAST</strong> <strong>Annual</strong> <strong>Report</strong> <strong>2006</strong>/<strong>07</strong><br />
IAS 21.21<br />
IAS 21.28<br />
IAS 21.28 in<br />
connection<br />
with IAS 21.9<br />
IAS 21.47<br />
IAS 21.48<br />
SIC-7<br />
<strong>IMMOEAST</strong> carried out a downstream merger during the second quarter of <strong>2006</strong>/<strong>07</strong>, by merging Immoeast Cora Holding<br />
s.r.l. into Cora GS s.r.l. as of 21 September <strong>2006</strong>.<br />
As of 1 November <strong>2006</strong> the investments in Mester Park Ost Bt. and Mester Park Kft. were increased from 45% to 75%,<br />
and the accounting procedure was changed from the equity method to full consolidation.<br />
An upstream merger was carried out during the third quarter of <strong>2006</strong>/<strong>07</strong> With the merger of Mistral Real Sp. z o.o.<br />
into Blizzard Real Sp. z o.o. as of 29 January 20<strong>07</strong>.<br />
2.4 Foreign currency translation<br />
The individual Group companies record foreign currency transactions at the average exchange rate in effect on the<br />
date of the event. Monetary assets and liabilities denominated in foreign currencies are translated on the balance<br />
sheet date at the average exchange rate in effect on this date. Any resulting foreign exchange gains or losses are<br />
recognised to the income statement for the reporting year.<br />
The Group currency is the EURO. For subsidiaries or associated companies that prepare their financial statements in<br />
a foreign currency, the determination of the functional currency is based on the primary (macro)economic environment<br />
in which each company operates. The determining factor is the currency in which the majority of cash flows,<br />
goods and services are denominated and settled in the relevant country. For the <strong>IMMOEAST</strong> companies affected by<br />
this regulation, the local currency is the functional currency in all cases. In accordance with IAS 21 and in keeping<br />
with the functional currency concept as reflected in the modified current rate method, the assets and liabilities in<br />
the financial statements that were converted to IFRS – and in the case of acquisitions, also revalued and prepared for<br />
consolidation – are translated at the average exchange rate on the balance sheet date; the various positions on the<br />
income statement are translated at the weighted average exchange rate for the reporting year. Goodwill allocated to<br />
a foreign subsidiary or company included through proportionate consolidation is translated at the closing rate. The<br />
equity of subsidiaries and companies included through proportionate consolidation as well as the investments in any<br />
other foreign entities in foreign currencies are translated at the historical exchange rate at the point of initial consolidation.<br />
Distributions in a foreign currency are translated at the average exchange rate for the purpose of elimination.<br />
The components of earned (historical) group equity of foreign entities that present their financial statements in a<br />
foreign currency are translated at the closing rate. Any resulting foreign exchange gains and losses are recorded to<br />
the currency translation adjustment in equity.<br />
On the disposal of a foreign operation, the cumulative exchange differences deferred in the separate component of<br />
equity for this foreign operation are recognised to profit or loss during the same period in which the gain or loss on<br />
the disposal is recognised.<br />
Companies located in member countries of the European Union are required to apply the rule defined by IAS 21 for<br />
the settlement and translation of annual financial statements from their national currency into the Euro – assets and<br />
liabilities must still be translated at the closing rate, accumulated exchange differences remain in equity and differences<br />
arising from the translation of liabilities denominated in the foreign currencies of the member states may not<br />
be charged or credited to the carrying amount of the related asset.
The following exchange rates, which were issued by Constantia Privatbank AG on 30 April 20<strong>07</strong>, were used for<br />
translation:<br />
HUF PLN CZK ROL RON<br />
Closing rate on 30 April 20<strong>07</strong> 247.180000 3.781000 28.123000 33293.000000 3.329300<br />
Average rate 255.630000 3.827850 28.271500 34021.500000 3.402150<br />
CYP SKK EEK BGN USD<br />
Closing rate on 30 April 20<strong>07</strong> 0.582600 33.727000 15.646600 1.955800 1.360500<br />
Average rate 0.579300 35.561000 15.646600 1.955800 1.3<strong>07</strong>100<br />
CHF RUB HRK UAH BAM<br />
Closing rate on 30 April 20<strong>07</strong> 1.645800 35.010000 7.361500 6.818100 1.959100<br />
Average rate 1.608550 34.570000 7.361500 6.688975 1.951550<br />
CSD SEK<br />
Closing rate on 30 April 20<strong>07</strong> 81.309000 9.152300<br />
Average rate 83.460000 9.177000<br />
The Romanian currency was redenominated from ROL (Romanian Leu) to RON (new Romanian Leu) on 1 July 2005,<br />
whereby 10,000 ROL equal 1 RON. This change was authorised by Law Nr. 348 dated 14 July 2004, which was published<br />
in the Romanian federal gazette (“Monitorul Oficial al României”) on 23 July 2004.<br />
The Bulgarian and Estonian currencies are tied to the Euro through a currency board (the domestic currency is tied<br />
to the foreign currency on a one-sided basis). Prior to the introduction of the Euro, these countries had a currency<br />
board with the D-Mark. On 5 July 1999 the Bulgarian currency (Lew) was converted at a ratio of 1 new Lew for 1,000<br />
old Lewa and tied to the German Mark (1 Lew = 1 DM). After the introduction of the Euro, the exchange rate for conversion<br />
of the Lew into Euro exactly equalled the DM – Euro rate. This exchange rate (1 EUR = 1.9558) is defined by<br />
Bulgarian law and does not change. The Estonian currency (Krone) was introduced in the newly independent Estonia<br />
after the collapse of the Soviet Union in 1992. After 1993 the Estonian Krone was linked to the D-Mark and this rate<br />
was maintained following the introduction of the Euro. The current exchange rate is 1 EUR = 15.6466.<br />
Notes<br />
<strong>Report</strong> by the Executive Board 171<br />
Highlights <strong>2006</strong>/<strong>07</strong><br />
Business Model and Strategy<br />
Portfolio Structure<br />
Corporate Governance and Outlook<br />
Property Portfolio<br />
Development of Business<br />
Consolidated Financial Statements<br />
Service and Glossary
172 <strong>IMMOEAST</strong> <strong>Annual</strong> <strong>Report</strong> <strong>2006</strong>/<strong>07</strong><br />
IAS 21.1<br />
IAS 21.32<br />
IAS 38.8<br />
IAS 38.12<br />
(a), (b)<br />
IAS 38.24<br />
IAS 38.33<br />
IAS 38.34<br />
IAS 38.111<br />
3. Accounting and valuation principles<br />
3.1 Change in accounting and valuation methods<br />
In contrast to the published consolidated financial statements as of 30 April <strong>2006</strong>, this annual report applies the<br />
revised IAS 21 as amended on 15 December 2005. The objective of this standard is to regulate the inclusion of transactions<br />
in foreign currencies and foreign operations in the financial statements of an entity, and also define how to<br />
translate financial statements into a presentation currency. In accordance with IAS 21 (revised 2005), foreign<br />
exchange gains and losses arising from long-term intercompany loans with indefinite repayment periods may no<br />
longer be recognised to the income statement through profit or loss but must be recognised directly in equity. These<br />
foreign exchange gains and losses are shown on the statement of changes in shareholders’ equity under the position<br />
“foreign exchange gains/losses according IAS 21.32”. Foreign exchange gains and losses arising from long-term<br />
intercompany loans relate to receivables and/or liabilities that may be called at any time. Therefore, these items do<br />
not meet the requirements of IAS 21.32 and are recognised to the income statement through profit or loss.<br />
3.2 Intangible assets<br />
Additional information on intangible assets is provided under point 4.3.1.<br />
IAS 38 defines intangible assets as identifiable, non-monetary assets without physical substance, which can be<br />
expected to generate a future economic benefit. The three characteristics of intangible assets are: identifiability,<br />
control (over the use of the asset) and future economic benefit (income or future cost savings). The identifiability of<br />
intangible assets is coupled either with the capability of being sold or transferred (either alone or together with other<br />
assets or liabilities) or with a contractual or legal right. In accordance with IAS 38, intangible assets are carried at<br />
cost less amortisation.<br />
If an intangible asset is acquired in a business combination in accordance with IFRS 3, the cost of this asset equals<br />
its fair value on the date of acquisition. The value of the intangible asset is subsequently reassessed in connection<br />
with the recognition of the business combination. The acquirer must record the intangible assets of the acquired<br />
company separately from goodwill as of the acquisition date, independent of whether the asset was recognised or<br />
not recognised by the acquired company prior to the business combination. In this case, the cost of the intangible<br />
asset is identical to fair value as of the acquisition date. The fair value of an intangible asset reflects the market<br />
expectations for the probability that the future economic benefits embodied in the asset will flow to the acquirer. The<br />
only circumstances in which it might not be possible to reliably measure the fair value of an intangible asset are when<br />
the asset is not separable from the entity, or there is no reliable data on exchange transactions for the same or similar<br />
assets and the estimate of fair value would be dependent on immeasurable variables.<br />
All intangible assets – with the exception of goodwill – have a finite useful life and are amortised on a systematic<br />
basis.<br />
Ordinary straight-line amortisation is based on the following useful lives:<br />
Useful life in years<br />
Other intangible assets 3-50<br />
In addition, intangible assets are tested for impairment in accordance with IAS 36.
Subsequent expenditures on an intangible asset after its acquisition or completion are expensed as incurred unless:<br />
it is probable that these expenditures will enable the asset to generate a future economic benefit which exceeds the<br />
originally estimated earning power, and these expenditures can be estimated reliably and exactly allocated to the<br />
asset. The company has no internally generated intangible assets.<br />
3.3 Differences arising from the consolidation<br />
3.3.1 Goodwill<br />
Additional information on goodwill is provided under point 4.3.2.<br />
The difference between the cost of a business combination and the proportional share of revalued net assets as of the<br />
acquisition date is recorded as goodwill and recognised as an asset in accordance with IFRS 3. Goodwill represents a<br />
payment made by the acquirer in anticipation of future economic benefits to be gained from assets that cannot be<br />
individually identified or separately recognised. Goodwill is not amortised on a regular basis, but is tested for impairment<br />
each year or on an interim basis if there are signs of a loss in value. Goodwill does not generate cash flows that<br />
are independent of the cash flows of other assets or groups of assets and often contributed to the cash flows of several<br />
cash-generating units. For this reason, goodwill is assigned to cash-generating units for the purpose of impairment<br />
testing. The need to recognise an impairment charge to a cash-generating unit is determined by comparing the<br />
carrying value with the recoverable amount. If the recoverable amount is less than the carrying value, an impairment<br />
charge is recognised at the amount of this difference to reduce the carrying amount to the recoverable amount. Any<br />
remaining difference is allocated to the other assets in the cash-generating unit in proportion to their carrying values.<br />
The allocation of an impairment charge to individual assets may not reduce the carrying value of the asset below the<br />
highest of the following amounts: a) fair value less costs to sell, b) value in use, and c) zero. All impairment charges<br />
are recognised immediately to the income statement. Subsequent increases in value are not permitted.<br />
The unit or group of units to which goodwill is assigned for the impairment test represents the lowest level of the<br />
company at which the goodwill is monitored for management purposes, and is not larger than a segment determined<br />
in accordance with IFRS 8 or IAS 14. For the purpose of impairment testing, the carrying value of the cash-generating<br />
unit is increased by the carrying value of the goodwill. This total is compared with the recoverable amount of the<br />
cash-generating unit in a next step, and any negative difference results in an impairment charge to goodwill. The<br />
recoverable amount of the cash-generating unit comprises the fair value of the property as determined by an expert<br />
opinion plus the fair value of deferred tax liabilities.<br />
The acquisition of project companies generally leads to positive goodwill because of the obligation to record deferred<br />
tax liabilities on revalued properties. The unequal valuation of these deferred tax liabilities – which, in contrast to<br />
other acquired net assets, may not be discounted – results in goodwill as a technical figure. In creating the cash-generating<br />
unit, the carrying values of the deferred tax liabilities recognised on property are added together with the<br />
assets and goodwill, and compared with the recoverable value of the unit. The deferred tax liabilities are represented<br />
in the cash-generating unit at a recoverable value of zero. This reflects the fact that – although property transactions<br />
normally take the form of share deals – the deduction of deferred tax liabilities on the purchase and sale of property<br />
companies is generally difficult or impossible to enforce in the markets in which <strong>IMMOEAST</strong> is active. The inclusion of<br />
deferred tax liabilities in the carrying value of cash-generating units represents a modification of the impairment tests<br />
performed on goodwill in previous years. This modification is based on the fact that nearly 100% of all property transactions<br />
are executed as share deals and the buyer must assume the deferred tax liabilities on such transactions.<br />
Notes<br />
<strong>Report</strong> by the Executive Board 173<br />
Highlights <strong>2006</strong>/<strong>07</strong><br />
Business Model and Strategy<br />
Portfolio Structure<br />
Corporate Governance and Outlook<br />
Property Portfolio<br />
Development of Business<br />
Consolidated Financial Statements<br />
Service and Glossary<br />
IAS 38.60<br />
IFRS 3.51<br />
IFRS 3.54 in<br />
connection<br />
with IAS 36.96<br />
IAS 36.90<br />
IAS 36.104<br />
IAS 36.105<br />
IAS 36.80<br />
IFRS 3.57b in<br />
connection<br />
with IFRS 3.B<br />
16 (i) & IAS<br />
12.53
174 <strong>IMMOEAST</strong> <strong>Annual</strong> <strong>Report</strong> <strong>2006</strong>/<strong>07</strong><br />
IFRS 3.57<br />
IFRS 3.56(a)<br />
3.3.2 Excess of acquirer’s interest in the net fair value of acquiree’s identifiable assets, liabilities and<br />
contingent liabilities over cost (excess)<br />
A consolidation will lead to negative differences (negative goodwill or excess) when the cost of a business combination<br />
is less than the proportional share of revalued net assets acquired. In such cases, IFRS 3.56 (a) requires that the<br />
acquirer reassess the identification and measurement of identifiable assets, liabilities and contingent liabilities as<br />
well as the cost of the business combination. Any excess remaining after the reassessment must be recognised<br />
immediately to the income statement as required by IFRS 3.56 (b). The IASB sees three reasons for a gain recognised<br />
under these circumstances: a) errors in identification and measurement, b) the application of standards for the measurement<br />
of assets and liabilities that do not reflect the fair value of these items and c) a bargain purchase.<br />
Negative goodwill recognised in the financial statements of <strong>IMMOEAST</strong> is comprised exclusively of goodwill as<br />
defined in IAS 3.57 (c) – bargain purchases. Identification and measurement errors are eliminated during the reassessment,<br />
and the application of standards for the measurement of assets and liabilities at amounts that do not<br />
reflect fair value leads to effects that counteract the generation of an excess or reduce this excess. This latter effect<br />
is caused by the prohibition on discounting defined by IFRS 3.57b in connection with IFRS 3.B16 (i) and IAS 12.53,<br />
which affects the deferred tax liabilities in the category summarised under this item.<br />
Bargain purchases can result from the following factors:<br />
a) When a forward purchase is executed, the acquisition price for a property company is determined for a specific<br />
point in the future. A decline in the market yield for this property before the acquisition date leads to a fair value<br />
that can exceed the price defined in the contract by a substantial amount, and thereby leads to an excess.<br />
b) Business combinations of minority interests that cannot be consolidated but, at the same time, include a call<br />
option for <strong>IMMOEAST</strong> at a fixed yield that is determined in advance can lead to an excess if the market yield<br />
declines at the time of the business combination.<br />
c) The following circumstances can also lead to an excess: A property company is acquired and the objects owned by<br />
this company have a high vacancy rate at the time the contract is signed, this situation is reflected in the purchase<br />
price. If the objects are fully let, or nearly fully let, prior to the transfer of legal ownership (closing), this will result<br />
in a higher fair value at the time of closing, which can lead to an excess.<br />
d) When companies with development projects are acquired, the strategic risk premium that forms the basis for the<br />
acquisition and has been accepted by the seller can be higher than the risk premium determined by the market.<br />
The fair value of the property can therefore be higher than the value on which the contract negotiations were based<br />
– and that can lead to an excess.<br />
e) When a property company is purchased, negotiations can result in a premium over and above the general market<br />
yield. The fair value of the property can therefore be higher than the price agreed with the seller – which, in turn,<br />
can lead to an excess.<br />
f) In the case of a joint venture, where a former contract partner transfers his share to the group and, in turn, the<br />
group subsequently has sole control over the assets of the former joint venture, the group can generally purchase<br />
the net assets at a price below market value. The reason for this is that the seller (former joint venture partner) is<br />
frequently unable to find a buyer for his share in the joint venture, and this situation has a favourable impact on<br />
the purchase price to be paid by the buyer.
3.4 Investment property<br />
Additional information on investment property is provided under point 4.1.<br />
Investment properties represent all objects that are held to generate rental income or to realise a long-term increase<br />
in value, and are not used in production or for administrative purposes or sold as part of the ordinary business<br />
activities of the company. Land and/or buildings, or parts thereof, can also represent investment property. Properties<br />
used in the production of goods or provision of services, as well as for administrative purposes, do not represent<br />
investment property as defined in IAS 40. Land that is purchased as a site for the construction of investment property<br />
is classified as IAS 40 property on the date of acquisition and subsequently measured at fair value.<br />
In accordance with IAS 40, investment properties are measured at cost plus transaction costs at the point of recognition.<br />
These costs may not include any founding or start-up costs or operating losses incurred before the investment<br />
property reaches the planned level of occupancy. For subsequent measurement, this standard provides companies<br />
with an option to choose either the cost model or the fair value model. Up to 30 April 2005 <strong>IMMOEAST</strong> recorded<br />
investment property in accordance with the cost model. In keeping with this model, properties were recorded at cost<br />
less ordinary straight-line depreciation and any necessary impairment charges. As of 31 January <strong>2006</strong> the management<br />
of <strong>IMMOEAST</strong> AG decided to follow the EPRA´s Best Practices Policy Recommendation 2.11, which advise EPRA<br />
members to follow the fair value model defined in IAS 40, based on this decision, the consolidated financial statements<br />
were adjusted retrospectively in accordance with IAS 8.22 to reflect the application of the fair value model<br />
defined in IAS 40.33.<br />
In accordance with the fair value model, properties are carried at their fair value as of the balance sheet date. Fair<br />
value is defined as the amount at which a property could be exchanged between knowledgeable, willing parities in<br />
an arm’s length transaction. All changes in fair value are recognised to the income statement. The properties are no<br />
longer depreciated on a regular basis, but measured each year at their fair value. As stated in IAS 36.2 (f), the regulations<br />
for impairment tests are not applicable because investment properties are measured at fair value and gains or<br />
losses in fair value are recognised to the income statement.<br />
Fair value must reflect the current market situation and circumstances as of the balance sheet date. The best evidence<br />
of fair value is normally provided by prices quoted on an active market for similar properties that have a similar<br />
location and conditions as well as comparable rental and other contractual relationships. The fair value of <strong>IMMOEAST</strong><br />
properties is determined by expert opinions, which are prepared by independent valuation experts. The function of<br />
the independent expert is filled by the member companies of the Colliers International Group for the CEE and SEE<br />
segment and DTZ Debenham Zadelhoff for the CIS segment.<br />
Investment properties are valued using the discounted cash flow method, specifically in the form of the term and<br />
reversion model. Under this model, current rental income up to the end of the contract term is discounted back to<br />
the valuation date, a comparable market rent is then applied, capitalised and also discounted back to the valuation<br />
date to determine the perpetual yield (reversion). Depending on the estimates for risk – which are based on the type<br />
of property, location and region as well as current market circumstances – different discount rates are used applied<br />
to current rental income and the capitalisation of the perpetual yield. The capitalisation also includes any vacancies<br />
as well as the perpetual yield based on an appropriate period of time for rental and comparable market rental prices<br />
and an assumed maximum occupancy that is derived from the above-mentioned criteria.<br />
Notes<br />
<strong>Report</strong> by the Executive Board 175<br />
Highlights <strong>2006</strong>/<strong>07</strong><br />
Business Model and Strategy<br />
Portfolio Structure<br />
Corporate Governance and Outlook<br />
Property Portfolio<br />
Development of Business<br />
Consolidated Financial Statements<br />
Service and Glossary<br />
IAS 40.5<br />
IAS 40.20 &<br />
IAS 40.23<br />
IAS 40.30<br />
IAS 8.22<br />
IAS 40.33 in<br />
connection<br />
with IAS 40.35<br />
IAS 40.38<br />
IAS 40.45
176 <strong>IMMOEAST</strong> <strong>Annual</strong> <strong>Report</strong> <strong>2006</strong>/<strong>07</strong><br />
IAS 40.55<br />
IAS 16.15<br />
IAS 16.19(d)<br />
IAS 40.33<br />
IAS 40.65<br />
IAS 36.2<br />
IAS 16.15<br />
IAS 16.23<br />
IAS 20.1<br />
IAS 20.24f<br />
Land was valued under the assumption that only the earnings potential of the site and not the earnings potential of<br />
the object to be constructed form the basis for the recognition of revaluation income. The residual value method of<br />
the income approach was used to value land, and the resulting residual value represents the fair value of the land.<br />
Investment properties that were acquired for possible redesign and renovation (redevelopment) are also valued<br />
using the residual value method. The classification as investment property is not changed by this redevelopment.<br />
When a property is carried at fair value, this same approach must be retained up to disposal even if comparable<br />
market transactions occur less often or market prices are not available as often.<br />
3.5 Property under construction<br />
Additional information on property under construction is provided under point 4.1.2.<br />
Properties constructed by the company for the generation of rental and/or leasing income or for the realisation of an<br />
increase in value are recognised as properties under construction and measured at cost. For this purpose, cost<br />
includes expenses incurred up to the completion of construction or development. In accordance with IAS 16.19,<br />
administrative expenses and other overheads are not included in acquisition or production cost. IAS 16 is applied up<br />
to completion and the start of operations in the property. Beginning with the date of completion, the property is<br />
measured at fair value in accordance with IAS 40. Any difference between the fair value of the property at this time<br />
and the previous carrying value is recognised to the income statement as required by IAS 40.65. Since the revaluations<br />
are generally considered to be material, they are shown on the same line of the income statement as other<br />
income from the revaluation of investment properties.<br />
Properties under construction are tested for impairment each year in accordance with IAS 36, whereby cost is compared<br />
with the fair value (value in use) determined by an expert opinion. Additional information on the determination<br />
of fair value is provided under point 3.4.<br />
3.6 Tangible assets<br />
In accordance with IAS 16, tangible assets are carried at cost less accumulated depreciation and any necessary writedowns<br />
that result from impairment tests. Acquisition or production cost includes all costs incurred to bring the asset<br />
to the location and condition necessary for it to be capable of operating in the intended manner. Cost includes not<br />
only the purchase price, but also expenses incurred for site preparation, initial deliveries and handling costs, installation<br />
and assembly costs and professional fees as well as estimated costs for dismantling and removing the object<br />
and restoring the site.<br />
When the payment for a tangible asset extends beyond the normal payment period, interest expense at market rates<br />
is also recognised or included.<br />
Depreciation is calculated on a straight-line basis beginning in the month of acquisition.<br />
Government grants represent assistance provided to an entity through the transfer of resources in return for past or<br />
future compliance with certain conditions relating to the operating activities of the entity. Government grants relating<br />
to assets, including non-monetary grants at fair value, must be recorded on the balance sheet as deferred income or<br />
deducted in determining the carrying value of the asset.
Financing costs are capitalised in accordance with IAS 23 if they are related to the acquisition or production of qualified<br />
assets. Borrowing costs include interest and other costs incurred by an entity in connection with the borrowing<br />
of funds. The capitalisation of borrowing costs ends with the completion of the asset.<br />
Ordinary straight-line depreciation on depreciable tangible assets is based on the following useful lives:<br />
Useful life in years<br />
Property (buildings) 25-50<br />
Other tangible assets 4-10<br />
The useful lives of the various assets and the depreciation method are reviewed regularly in agreement with IAS 16<br />
to ensure that they reflect the expected development of the economic value in use of the tangible asset.<br />
3.7 Non-current assets held for sale (IFRS 5)<br />
Additional information on non-current assets held for sale is provided under point 4.1.3.<br />
IFRS 5 classifies assets as held for sale if they can be sold in their present condition and their sale is highly probable.<br />
The involved assets represent non-current items. These assets are no longer depreciated on a regular basis, but are<br />
measured at the lower of carrying value at the point of classification as held for sale and fair value less costs to sell.<br />
The requirements for classification as held for sale are: a) the existence of a concrete intention to sell, b) the immediate<br />
availability of the asset and c) with certain exceptions, the completion of the sale within twelve months.<br />
If the requirements for classification as held for sale are no longer met, the asset is transferred to the appropriate<br />
balance sheet position and measured at the lower of carrying amount and fair value less costs to sell. Any adjustment<br />
to the value of the asset is recognised to the income statement. Investment properties represent an exception to the<br />
valuation requirements set forth in IFRS 5 because these assets are valued in accordance with the fair value model<br />
(IFRS 5.5 (d)). However, the presentation requirements defined in IFRS 5 apply.<br />
3.8 Inventories<br />
Additional information on inventories is provided under point 4.8.<br />
Inventories represent assets that are held for sale during the ordinary course of business, or are in the process of<br />
production for such sale, or take the form of materials or supplies to be consumed in the production process or in the<br />
rendering of services.<br />
The business activities of <strong>IMMOEAST</strong> as a property company include the acquisition, rental and best possible commercial<br />
utilisation of assets to optimise asset management. The properties held for sale by the <strong>IMMOEAST</strong> subsidiaries<br />
during the course of ordinary business operations do not fall under the scope of application of IAS 40 (investment<br />
properties), and are therefore treated as inventories in accordance with IAS 2.<br />
Inventories are capitalised at cost and measured at the lower of carrying value or net realisable value as of the balance<br />
sheet date. Net realisable value is determined as the estimated selling price less any outstanding production<br />
Notes<br />
<strong>Report</strong> by the Executive Board 177<br />
Highlights <strong>2006</strong>/<strong>07</strong><br />
Business Model and Strategy<br />
Portfolio Structure<br />
Corporate Governance and Outlook<br />
Property Portfolio<br />
Development of Business<br />
Consolidated Financial Statements<br />
Service and Glossary<br />
IAS 23.10-11<br />
IAS 23.4<br />
IFRS 5.1<br />
IFRS 5.25<br />
IFRS 5.15<br />
IFRS 5.6-8<br />
IFRS 5.5 (d)<br />
IAS 2.6<br />
IAS 2.10
178 <strong>IMMOEAST</strong> <strong>Annual</strong> <strong>Report</strong> <strong>2006</strong>/<strong>07</strong><br />
IAS 17.7<br />
IAS 17.4<br />
IAS 17.10<br />
IAS 17.20<br />
IAS 17.49-51<br />
IAS 40.6<br />
IAS 17.15f<br />
costs and costs to sell. The acquisition or production cost of inventories includes all purchase and processing costs<br />
as well as other expenses incurred to bring the asset to the current location and condition.<br />
Sales of inventories are included in revenues, whereby revenue is realised when ownership is transferred. In the<br />
event of a sale, the production costs are recorded as a disposal under the cost of materials.<br />
3.9 Leasing<br />
In keeping with IAS 17, the allocation of a leased asset to the lessor or lessee is based on the transfer of all material<br />
risks and rewards incident to ownership of the asset.<br />
A lease is classified as a finance lease if it transfers substantially all the risks and rewards incidental to ownership.<br />
All other leases are classified as operating leases.<br />
Situations that normally lead to the classification of a lease as a finance lease include:<br />
• The lease transfers ownership of the asset to the lessee by the end of the lease term;<br />
• The lessee has the option to purchase the asset at a price that is expected to be sufficiently lower than fair value<br />
at the date the option becomes exercisable and it is therefore reasonably certain, at the inception of the lease, that<br />
the option will be exercised;<br />
• The lease term covers the major part of the economic life of the asset, even if title is not transferred;<br />
• At the inception of the lease, the present value of the minimum lease payments amounts to at least substantially<br />
all of the fair value of the leased asset; and<br />
• The leased asset is of such as specialised nature that only the lessee can use it without major modifications.<br />
Assets obtained through finance leases are capitalised at the fair value or lower present value of the minimum lease<br />
payments from the viewpoint of the lessee, and amortised on a straight-line basis over the shorter of the presumed<br />
useful life or term of the lease agreement. Payments required on operating leases are recognised to the income statement<br />
in equal instalments over the term of the lease.<br />
Under operating leases, economic ownership remains with the lessor. The lessee recognises the lease payments as<br />
an expense, generally on a straight-line basis over the term of the lease. The lessor retains the leased item as an<br />
asset on its balance sheet, and measures this asset in accordance with normal requirements. Lease income is generally<br />
distributed on a straight-line basis over the term of the lease. Contract and similar costs are expensed analogously<br />
over the term of the lease.<br />
IAS 40.6 gives companies an option to classify property that is held through an operating lease as investment property<br />
if the fair value model is used and the property otherwise meets the definition of an investment property. This<br />
classification alternative may be elected for individual objects.<br />
In the classification of leases for land and buildings, the land and building elements are normally considered separately.<br />
The minimum lease payments are allocated to the land and building elements in proportion to their relative<br />
fair value. The land element is normally classified as an operating lease unless title is expected to pass to the lessee<br />
by the end of the lease term. The building element is classified as a finance or operating lease according to the criteria<br />
presented in IAS 17. However, separate measurement of the land and building elements is not required when the
lessee’s interest in both land and buildings is classified as investment property in accordance with IAS 40 and the<br />
fair value model is used for recognition and measurement.<br />
3.10 Financial instruments<br />
A financial instrument is defined as a contract that gives rise to a financial asset of one entity and a financial liability or<br />
equity instrument of an other entity. This definition covers securities, receivables, liabilities, equity and derivatives.<br />
The commentaries to the tables under point 4.5 present the information on financial instruments by class as required<br />
by IFRS 7.6 as well as the transition calculation to the positions shown on the balance sheet.<br />
3.10.1 Investments in other companies<br />
Additional information on investments in other companies is provided under point 4.5.<br />
Investments in other companies are stated at fair value in accordance with IAS 39. If this amount cannot be determined<br />
reliably, such investments are reported at cost less any impairment losses.<br />
Loans granted are generally recorded at cost or the lower present value as of the balance sheet date.<br />
Securities reported under non-current assets and investments in other companies are classified as available-for-sale<br />
in keeping with IAS 39, and recorded at their fair value or market value as of the balance sheet date. If fair value cannot<br />
be determined and comparable market prices are not available, fair value is established using generally accepted<br />
valuation methods (discounted cash flow method) or, in the case of property companies, according to the net asset<br />
value. The initial valuation is made as of the settlement date. Fluctuations in fair value are charged or credited directly<br />
to equity; these changes are only recognised to the income statement in the event of impairment or when the securities<br />
are sold. If there are objective indications of impairment to an asset, an appropriate write-down is made.<br />
Upon initial recognition, an entity may elect to recognise a financial instrument at fair value through profit or loss in<br />
accordance with IAS 39.9. This classification is only permitted when:<br />
• it eliminates or significantly reduces a measurement or recognition inconsistency that would otherwise arise from<br />
measuring assets, or<br />
• the financial instrument is part of a portfolios whose performance is measured on a fair value basis and information<br />
is reported internally on this basis to the entity’s key management personnel as defined in IAS 24.<br />
In addition, IAS 39.11A permits the measurement of certain hybrid financial instruments in their entirety at fair value.<br />
Financial instruments acquired after 1 May 2004 are generally designated as financial assets at fair value through<br />
profit or loss in accordance with IAS 39 (see point 4.5), and are measured at fair value as of the balance sheet date.<br />
Changes in fair value are recognised to the income statement.<br />
3.10.2 Receivables and other assets<br />
Receivables and other assets are stated at cost. Recognisable individual risks are reflected in appropriate valuation<br />
adjustments.<br />
Notes<br />
<strong>Report</strong> by the Executive Board 179<br />
Highlights <strong>2006</strong>/<strong>07</strong><br />
Business Model and Strategy<br />
Portfolio Structure<br />
Corporate Governance and Outlook<br />
Property Portfolio<br />
Development of Business<br />
Consolidated Financial Statements<br />
Service and Glossary<br />
IAS 32.11<br />
IAS 39.43<br />
IAS 39.9<br />
IAS 39.11A<br />
IAS 39.43
180 <strong>IMMOEAST</strong> <strong>Annual</strong> <strong>Report</strong> <strong>2006</strong>/<strong>07</strong><br />
IAS 7.7<br />
IAS 39.9<br />
IAS 39.43<br />
IAS 39.9<br />
IAS 39.47<br />
IAS 39. AG27<br />
IFRS 7.37 requires an analysis of the age of financial assets that are past due as of the reporting date but not impaired<br />
as well as an analysis of the individual financial assets that are individually determined to be impaired as of the<br />
reporting date, including the criteria used to determine impairment. Collateral and credit enhancements relating to<br />
the above-mentioned amounts must also be disclosed (also see point 4.6).<br />
3.10.3 Current financial instruments<br />
In accordance with IAS 39, current financial instruments are classified as held for trading and carried as fair value or<br />
the quoted market price as of the balance sheet date. All purchases and sales are recognised on the settlement date,<br />
i.e. the date on which the asset is transferred. Temporary fluctuations in market value are recognised to the income<br />
statement. In accordance with IAS 7.7, current financial instruments are included in cash flow as a component of cash<br />
and cash equivalents if they have a term of less than three months from the date of acquisition. All assets in the balance<br />
sheet position meet this criterion as of the balance sheet date.<br />
3.10.4 Derivative financial instruments<br />
Additional information on derivative financial instruments is provided under point 8.1.3.<br />
A derivative is a financial instrument with the following characteristics:<br />
• Its value changes as a result of the change in the underlying primary financial instrument, e.g. a certain interest<br />
rate, the price of a financial instruments, commodity price, exchange rate, price or interest rate index, credit rating<br />
or credit index;<br />
• It has no purchase cost or only a low purchase cost (compared with other contracts that react to changes in market<br />
conditions in a similar manner); and<br />
• It is settled at a future date, whereby settlement frequently takes the form of a net payment or conclusion of a<br />
counter-transaction.<br />
Derivatives are recognised as independent transactions. These financial instruments are used to reduce the risks<br />
associated with foreign exchange and interest rate fluctuations. Derivative transactions are only concluded with<br />
financial institutions that have first-rate credit standings.<br />
3.10.5 Financial liabilities<br />
Financial liabilities are generally measured at amortised cost. Liabilities are recorded at the amount of funds received<br />
less transaction costs. Any premium, discount or other difference (e.g. costs for the procurement of funds) between<br />
the amount received and the repayment amount is allocated over the term of the financing according to the effective<br />
interest rate method and recorded under financial results. The effective interest rate method is not used for immaterial<br />
differences; these differences are allocated on a straight-line basis over the term of the liability.<br />
3.10.6 Hybrid financial instruments<br />
Combined financial instruments, which contain both equity and debt components, must be accounted for separately,<br />
e.g. convertible bonds or option bonds. Financial instruments may be comprised of a non-derivative host contract<br />
and a derivative financial instrument. An embedded derivative must be recorded separately from the host contract.
3.10.7 Limited partnership interests<br />
As stated in IAS 32.18 (b), a financial instrument that gives the owner the right to put back this instrument to the<br />
issuer for cash or another financial instrument must be classified as a financial liability (“puttable instrument”).<br />
Shares in partnerships fall under this definition under various legal systems.<br />
In contrast to the method applied in 2005/06, for business combinations that result the purchase of shares in partnerships,<br />
the carrying value of such investments is offset against the proportional share of equity during the consolidation<br />
of equity and not during the consolidation of liabilities.<br />
3.11 Cash and cash equivalents<br />
Cash and cash equivalents comprise cash on hand, funds-in-transit and deposits with financial institutions. These<br />
items are recorded at their actual value as of the balance sheet date.<br />
3.12 Impairment of assets<br />
In accordance with IAS 36, impairment tests are performed when there are indications that an asset may be impaired.<br />
Independent of this practice, goodwill and intangible assets with an indefinite useful life are tested each year for<br />
signs of impairment. This test is generally performed separately for each asset. The impairment test is only performed<br />
on the smallest group of assets, the cash-generating unit, in cases where cash inflows cannot be directly allocated<br />
to a specific asset and an individual valuation is therefore not possible. The cash-generating unit is the smallest<br />
identifiable group of assets that produces cash inflows, which are largely independent of the cash inflows of other<br />
assets or other groups of assets.<br />
As of every balance sheet date all assets must be tested for possible signs of impairment (e.g. the carrying value of<br />
an asset exceeds the higher of fair value less cost to sell and the value in use).<br />
IAS 36 defines the recoverable amount as the relevant benchmark for the impairment test. The recoverable amount<br />
equals the higher of fair value less costs to sell and the value in use. If the carrying value of an asset exceeds the<br />
recoverable amount, the difference is recognised as an impairment charge.<br />
Fair value less costs to sell represents the amount obtainable from the sale of an asset or cash-generating unit in an<br />
arm's length transaction at normal market conditions between knowledgeable and willing parties, less the costs of<br />
disposal. The costs of disposal are incremental costs directly attributable to the disposal of an asset or cash-generating<br />
unit, excluding financing costs.<br />
Value in use is the present value of estimated future cash flows that are expected to arise from the continuing use of<br />
an asset or cash-generating unit. Cash flow planning must be based on reasonable and justifiable assumptions that<br />
reflect the entity’s latest financial plans. The determination of value in use is based on the same methodology used<br />
to establish the value of a company, i.e. the discounted cash flow method.<br />
Any necessary impairment charge is recognised to the income statement. If there is an indication that an impairment<br />
loss may no longer exist or may have decreased, the impairment loss is reversed to the carrying amount that would<br />
have been determined (net of amortisation or depreciation) if no impairment loss had been recognised in prior years.<br />
This does not apply to goodwill.<br />
Notes<br />
<strong>Report</strong> by the Executive Board 181<br />
Highlights <strong>2006</strong>/<strong>07</strong><br />
Business Model and Strategy<br />
Portfolio Structure<br />
Corporate Governance and Outlook<br />
Property Portfolio<br />
Development of Business<br />
Consolidated Financial Statements<br />
Service and Glossary<br />
IAS 32.18 (b)<br />
IAS 36.9 &<br />
IAS 36.10<br />
IAS 36.9<br />
IAS 36.19-21<br />
IAS 36.25-28<br />
IAS 36.30<br />
IAS 36.33
182 <strong>IMMOEAST</strong> <strong>Annual</strong> <strong>Report</strong> <strong>2006</strong>/<strong>07</strong><br />
IAS 12.15 in<br />
connection<br />
with IAS 12.47<br />
IAS 12.5<br />
IAS 12.15<br />
IAS 12.24<br />
IAS 12.74<br />
IAS 1.51<br />
IAS 37.14<br />
3.13 Deferred taxes<br />
Additional information on deferred taxes is provided under point 4.15.<br />
In accordance with the balance sheet liability method required by IAS 12, deferred taxes are calculated on all temporary<br />
differences between the carrying amount of an asset or liability in the IFRS consolidated financial statements<br />
and its tax base in the individual company financial statements. Temporary differences are differences between the<br />
carrying value of an asset or liability on the balance sheet and the relevant tax base. Temporary differences can be:<br />
• taxable temporary differences, which are temporary differences that will result in taxable amounts in the determination<br />
of taxable profit (tax loss) in future periods, when the carrying amount of the asset or liability is recovered<br />
or settled; or<br />
• deductible temporary differences, which are temporary differences that will result in amounts that are deductible<br />
for the determination of taxable profit (tax loss) in future periods, when the carrying amount of the asset or liability<br />
is recovered or settled.<br />
A deferred tax asset or deferred tax liability must be recorded for each taxable temporary difference unless the difference<br />
arises from the initial recognition of goodwill or the initial recognition of an assets or liability in a transaction<br />
that:<br />
• is not a business combination and<br />
• at the time of the transaction, affects neither accounting profit (before tax) nor taxable profit (tax loss).<br />
Deferred tax assets must be recognised for all tax loss carryforwards to the extent that it is probable that taxable<br />
profit will be available against which the deductible temporary difference can be utilised.<br />
The expected realisable tax credits from the loss carryfowards are also included in this calculation. Deferred tax<br />
assets and deferred tax liabilities may be offset if the conditions set forth in IAS 12.74 are met:<br />
a) the entity has a legally enforceable right to offset current tax assets against current tax liabilities, and<br />
b) the deferred tax assets and deferred tax liabilities relate to income taxes levied by the same taxation authority.<br />
The calculation of deferred taxes is based on the tax rates that will apply or are expected to apply in the individual<br />
countries at the point of realisation. The tax laws enacted or substantively enacted as of the balance sheet date are<br />
also taken into account. The calculation of deferred taxes for Austrian companies is based on a tax rate of 25%. For<br />
foreign companies, the relevant local tax rate is applied (see 4.15). In accordance with IAS 1.51, deferred taxes are<br />
classified as non-current assets or non-current liabilities following the presentation of the balance sheet by term.<br />
3.14 Provisions and other liabilities<br />
Additional information on provisions and other liabilities is provided under points 4.12 and 4.13.<br />
In accordance with IAS 37.14, an obligation arising from past events whose timing or amount is uncertain is recorded<br />
as a provision when it becomes probable that an outflow of resources will be required to settle this obligation and<br />
when the amount can be reliably estimated.
The provision is based on the best estimate at the time the financial statements are prepared. The best estimate of<br />
the amount required to meet the present obligation is the amount the entity would rationally pay to settle the obligation<br />
at the balance sheet date or to transfer the obligation to a third party at that time.<br />
The risks and uncertainties that inevitably surround many events and circumstances must be taken into account in<br />
determining the best estimate. The expected cash flows must be discounted to their present value if the time value<br />
of money is material.<br />
Where some or all of the expenditure required to settle a provision is expected to be reimbursed by another party,<br />
the reimbursement may only be recognised when it is virtually certain that reimbursement will be received if the<br />
entity settles the obligation. This reimbursement is to be treated as a separate asset. The amount recognised for the<br />
reimbursement may not exceed the amount of the provision.<br />
In the measurement of a provision, future events are to be included as follows:<br />
• planning for reasonable changes in the use of existing technologies<br />
• exclusion of possible gains expected from the disposal of assets<br />
• inclusion of changes in law only when enactment is virtually certain.<br />
Provisions must be reviewed as of each balance sheet date and adjusted through profit or loss if an outflow of<br />
resources is no longer probable.<br />
3.15 Contingent liabilities<br />
Additional information on contingent liabilities is provided under point 4.14.<br />
Contingent liabilities represent possible or existing obligations that arise from past events, in cases where it is not<br />
probable that an outflow of resources will be required to settle the obligation. In accordance with IFRS 3, contingent<br />
liabilities are only recorded on the balance sheet if they were obtained in connection with the acquisition of a company<br />
and fair value at the point of acquisition can be measured with sufficient reliability. Subsequent measurement<br />
is made through profit or loss at the higher of the expected value as determined under IAS 37 (see point 3.14) and<br />
the value determined at the point of recognition – less accumulated amortisation in accordance with IAS 18.<br />
3.16 Revenue recognition<br />
Revenues are recognised when the risks and opportunities of ownership as well as control over the goods or services<br />
are transferred to the buyer. In addition, it must be possible to reliably measure the revenues and the costs arising in<br />
connection with the sale. If these criteria are met, revenues are recognised in the relevant period. If these criteria are<br />
not met, any payments received must be treated as liabilities.<br />
Notes<br />
Revenues from the rental of property are recognised during the appropriate period determined by the rental agreement.<br />
The sale of inventories is reported under revenues, with the transfer of ownership forming the point of realisation.<br />
<strong>Report</strong> by the Executive Board 183<br />
Highlights <strong>2006</strong>/<strong>07</strong><br />
Business Model and Strategy<br />
Portfolio Structure<br />
Corporate Governance and Outlook<br />
Property Portfolio<br />
Development of Business<br />
Consolidated Financial Statements<br />
Service and Glossary<br />
IAS 37.36<br />
IAS 37.42<br />
IAS 37.53<br />
IAS 37.48<br />
IAS 37.51<br />
IAS 37.50<br />
IAS 37.59<br />
IAS 37.10 in<br />
connection<br />
with IFRS 3<br />
IAS37.36fin<br />
connection<br />
with IAS 18<br />
IAS 18.14<br />
IAS 18.19
184 <strong>IMMOEAST</strong> <strong>Annual</strong> <strong>Report</strong> <strong>2006</strong>/<strong>07</strong><br />
IAS 1.116<br />
3.17 Estimates<br />
In preparing the consolidated financial statements, it is necessary to estimate certain figures (for example, with<br />
respect to the parameters for property valuation, see 3.4) and make assumptions that influence the recording of<br />
assets and liabilities, the declaration of other obligations as of the balance sheet date, and the recording of revenues<br />
and expenses during the reporting period. The actual figures that become known at a later time may differ from these<br />
estimates. The preparation of these financial statements required the use of estimates for the recognition and measurement<br />
of provisions, impairment charges and actuarial parameters as well as the determination of the fair value<br />
of properties, the calculation of net asset value and triple net asset value, and the determination of outstanding<br />
construction costs.
4. Notes to the Balance Sheet<br />
4.1 Property<br />
Additional information on the accounting and valuation principles related to these balance sheet items are provided<br />
under point 3.4.<br />
Detailed information on the development of fixed assets is provided below, whereby the effects of changes in the<br />
consolidation range are shown separately. Also shown separately are currency translation differences, which result<br />
from the translation of assets by foreign companies using different exchange rates at the beginning and end of the<br />
year.<br />
4.1.1 Investment properties<br />
The development of the cost of investment properties<br />
is shown in the following table:<br />
All amounts in TEUR Investment properties<br />
Balance on 1 May 2005 433,960.5<br />
Change in consolidation range 834,238.3<br />
Change in consolidation method 37,963.4<br />
Currency translation adjustments 27,881.6<br />
Additions 52,583.1<br />
Disposals -4,031.6<br />
Reclassification 57,245.7<br />
Balance on 30 April <strong>2006</strong> 1,439,840.9<br />
Balance on 1 May <strong>2006</strong> 1,439,840.9<br />
Change in consolidation range 816,756.9<br />
Change in consolidation method 124,104.1<br />
Currency translation adjustments 75,739.5<br />
Additions 269,419.0<br />
Disposals -2,517.1<br />
Reclassification 119,7<strong>07</strong>.1<br />
Balance on 30 April 20<strong>07</strong> 2,843,050.4<br />
The development of the fair value of investment<br />
properties is as follows:<br />
All amounts in TEUR Investment properties<br />
Balance on 1 May 2005 455,165.6<br />
Change in consolidation range 834,434.9<br />
Change in consolidation method 41,958.6<br />
Currency translation adjustments 28,005.1<br />
Additions 52,583.1<br />
Disposals -4,015.6<br />
Revaluation 133,463.8<br />
Impairment -12,574.8<br />
Reclassification 57,355.9<br />
Balance on 30 April <strong>2006</strong> 1,586,376.6<br />
Balance on 1 May <strong>2006</strong> 1,586,376.6<br />
Change in consolidation range 816,756.9<br />
Change in consolidation method 136,852.9<br />
Currency translation adjustments 86,997.6<br />
Additions 269,419.0<br />
Disposals -2,517.1<br />
Revaluation 567,003.6<br />
Impairment -73,908.5<br />
Reclassification 114,933.6<br />
Fair value reflects the current market situation and circumstances as of the balance sheet date. The best evidence of<br />
fair value is normally provided by prices quoted on an active market for similar properties that have a similar location<br />
and conditions as well as comparable rental and other contractual relationships. The fair value of <strong>IMMOEAST</strong> properties<br />
is determined by expert opinions, which are prepared by independent valuation experts. The function of the<br />
independent expert is filled by Colliers International for the CEE and SEE segment and DTZ for the CIS segment.<br />
Notes<br />
Balance on 30 April 20<strong>07</strong> 3,501,914.5<br />
<strong>Report</strong> by the Executive Board 185<br />
Highlights <strong>2006</strong>/<strong>07</strong><br />
Business Model and Strategy<br />
Portfolio Structure<br />
Corporate Governance and Outlook<br />
Property Portfolio<br />
Development of Business<br />
Consolidated Financial Statements<br />
Service and Glossary<br />
IAS 40.76
186 <strong>IMMOEAST</strong> <strong>Annual</strong> <strong>Report</strong> <strong>2006</strong>/<strong>07</strong><br />
IAS 16.74 (a)<br />
analogously<br />
IAS 16.73 (e)<br />
IAS 16.74 (b)<br />
Additions represent the following objects:<br />
BG, Sofia, Antim Tower PL, Warsaw, MBP Galaxy<br />
CZ, Prague, Skofin Office Building PL, Warsaw, MBP Jupiter<br />
CZ, Prague, BB Centrum Building A PL, Warsaw, MBP Neptun<br />
CZ, Prague, BB Centrum Building B PL, Warsaw, MBP Orion<br />
CZ, Prague, BB Centrum Building C PL, Warsaw, MBP Saturn<br />
CZ, Brno, OC Petrov PL, Warsaw, MBP Sirius<br />
CZ, Prague, Jungmannova Plaza PL, Warsaw, MBP Merkury<br />
CZ, Prague, Diamond Point PL, Warsaw, MBP Taurus<br />
CZ, Pardubice, Grand Pardubice PL, Warsaw, MBP Vega (land)<br />
CZ, Brno Business Park I PL, Warsaw, Passat<br />
H, Budapest, Central Business Center RO, Bucharest, Victoria Park I<br />
HR, Zagreb, Grand Center RO, Bucharest, Jandarmeriei Office<br />
PL, Warsaw, Salzburg Center RO, Craiova, Shopping Center Craiova<br />
PL, Warsaw, Equator RU, Moscow, Golden Babylon I<br />
PL, Warsaw, Zenith RU, Moscow, Golden Babylon II<br />
PL, Warsaw, Nimbus RU, Moscow, 5th Avenue Shopping Center<br />
PL, Warsaw, Cirrus SLO, Kranj, Shopping Centre Kranj<br />
PL, Kalisz, Shopping Centre Kalisz SLO, Nove Mesto, Shopping Centre Nove Mesto<br />
PL, Warsaw, Brama Zachodnia<br />
PL, Warsaw, MBP Mars<br />
SK, Trnava, Arkadia Trnava<br />
There were no disposals of investment property during <strong>2006</strong>/<strong>07</strong>.<br />
The carrying value of tangible assets pledged as collateral for long-term debt totalled TEUR 2,639,434.8 (2005/06:<br />
TEUR 1,586,376.6).<br />
4.1.2 Property under construction<br />
Additional information on this balance sheet position is provided under point 3.5.<br />
The cost of property under construction developed as follows during <strong>2006</strong>/<strong>07</strong>:<br />
All amounts in TEUR Property under construction<br />
Balance on 1 May 2005 62,492.0<br />
Change in consolidation range 52,401.9<br />
Change in consolidation method 286.0<br />
Currency translation adjustments 2,539.9<br />
Additions 49,049.0<br />
Disposals -1,383.8<br />
Reclassification -75,398.5<br />
Balance on 30 April <strong>2006</strong> 89,986.5<br />
Balance on 1 May <strong>2006</strong> 89,986.5<br />
Change in consolidation range 151,410.5<br />
Change in consolidation method 11,069.0<br />
Currency translation adjustments 5,964.1<br />
Additions 105,273.6<br />
Disposals -37.6<br />
Reclassification -119,687.5<br />
Balance on 30 April 20<strong>07</strong> 243,978.6<br />
The transition consolidations involved<br />
the following objects:<br />
CZ, Prague, Pankrác House<br />
H, Budapest, Pharma Park<br />
H, Budapest, Green Point 7<br />
H, Budapest, Euro Businesspark<br />
H, Budapest, Shark Park<br />
PL, Warsaw, Bokserska Distribution Park<br />
PL, Warsaw, Bokserska Office Center<br />
PL, Warsaw, Crown Point<br />
PL, Warsaw, Crown Tower<br />
PL, Warsaw, Cybernetyki Office Center<br />
PL, Warsaw, Lopuszanska<br />
PL, Silesia Logistik Center
The carrying values of properties under construction developed as follows:<br />
All amounts in TEUR Property under construction<br />
Balance on 1 May 2005 62,326.5<br />
Change in consolidation range 52,401.9<br />
Change in consolidation method 114.5<br />
Currency translation adjustments 2,536.4<br />
Additions 49,049.0<br />
Disposals -1,383.8<br />
Impairment -3,902.9<br />
Reclassification -75,508.8<br />
Balance on 30 April <strong>2006</strong> 85,632.7<br />
Balance on 1 May <strong>2006</strong> 85,632.7<br />
Change in consolidation range 151,410.5<br />
Change in consolidation method 9,693.1<br />
Currency translation adjustments 5,841.9<br />
Additions 105,273.6<br />
Disposals -37.6<br />
Reclassification -115,041.7<br />
Balance on 30 April 20<strong>07</strong> 242,772.6<br />
The impairment charges recognised in 2005/06 were related entirely to exchange rate fluctuations.<br />
The additions to property under construction are shown below:<br />
CZ, Strakonice, MY BOX Strakonice RO, Targu Mures, Shopping C. Targu Mures<br />
CZ, Rakovník, MY BOX Rakovník RO, Galati, Euromall Galati<br />
CZ, Sokolov, MY BOX Sokolov RO, Bukarst, Bucharest Distribution Park<br />
CZ, Hranice, MY BOX Hranice RO, Targu Jiu, Shopping Center Targu Jiu<br />
CZ, Kolín, MY BOX Kolín RO, Bucharest, Euromall Baneasa<br />
CZ, Pribram, My Box Pribram RO, Bucharest, Victoria Park (II - IV)<br />
CZ, Trˇebíc Nákupní Centrum Trˇebíc RO, Bucharest, IRIDE IV<br />
CZ, Tábor, Nákupní Centrum Aventin Tábor RO, Ploiesti, LogCenter Ploiesti<br />
H, Budapest, Mester Park RO, Timisoara, Almera Logistik Portfolio<br />
H, Békéscaba, STOP.SHOP. BCS (Phase IV) RU, Moscow, Rostokinǒ<br />
H, Gyöngyös, STOP.SHOP. Gyöngyös (Phase IV) SK, Ružomberok, StopShop Ružomberok<br />
PL, Warsaw, Rondo Jasdy Polskei SK, Prievidza, Arkadia Prievidza<br />
RO, Glina, Shopping Center Glina<br />
RO, Sibiu, Shopping Center Sibiu<br />
UA, Kiev, Alacor Business Park City<br />
The fair value of property under construction totalled TEUR 569,1<strong>07</strong>.9 (2005/06: TEUR 95,387.3). Collateral is provided<br />
by property under construction with a total carrying value of TEUR 242,772.6.<br />
4.1.3 Non-current property held for sale<br />
Additional information on this balance sheet item is provided under point 3.7.<br />
Non-current property held for sale is carried at fair value (IFRS 5.5 (d)) if it falls under the scope of application defined<br />
in IAS 40. In all other cases, non-current property held for sale is stated at the lower of carrying value and fair value<br />
less costs to sell.<br />
Notes<br />
<strong>Report</strong> by the Executive Board 187<br />
Highlights <strong>2006</strong>/<strong>07</strong><br />
Business Model and Strategy<br />
Portfolio Structure<br />
Corporate Governance and Outlook<br />
Property Portfolio<br />
Development of Business<br />
Consolidated Financial Statements<br />
Service and Glossary<br />
IAS 16.74 (a)
188 <strong>IMMOEAST</strong> <strong>Annual</strong> <strong>Report</strong> <strong>2006</strong>/<strong>07</strong><br />
No properties were classified as held for sale as of 30 April 20<strong>07</strong>. The Europe Tower in Budapest, Hungary, which was<br />
recorded under this position as of 30 April <strong>2006</strong>, was sold during <strong>2006</strong>/<strong>07</strong> (also see point 5.3).<br />
All amounts in TEUR<br />
Non-current property<br />
held for sale<br />
Cost as of 1 May 2005 0.0<br />
Currency translation adjustments -1,882.5<br />
Additions 25,202.8<br />
Reclassification 19,527.3<br />
Cost as of 30 April <strong>2006</strong> 42,847.6<br />
Currency translation adjustments 1,416.4<br />
Additions 1,661.9<br />
Disposals -45,925.9<br />
Cost as of 30 April 20<strong>07</strong> 0.0<br />
Carrying value as of 1 May 2005 0.0<br />
Currency translation adjustments -1,882.5<br />
Additions 25,202.8<br />
Reclassification 19,527.3<br />
Carrying value as of 1 May <strong>2006</strong> 42,847.6<br />
Currency translation adjustments 1,416.4<br />
Additions 1,661.9<br />
Disposals -45,925.9<br />
Carrying value as of 30 April 20<strong>07</strong> 0.0<br />
The fair value of non-current properties held for sale totalled TEUR 0 (2005/06: TEUR 54,125.0).<br />
4.1.4a Net asset value (NAV)<br />
Net asset value and triple net asset value are calculated in accordance with Best Practices Policy Recommendations<br />
(6.3) and (6.4) of the European Public Real Estate Association based on the following principles:<br />
Equity as shown in the IFRS financial statements (excluding minority interests) is adjusted by the difference between<br />
the carrying value of property that does not quality for valuation at fair value. An adjustment is also made for financial<br />
instruments that are not stated at fair value. In a last step, deferred tax assets and deferred tax liabilities are offset<br />
against equity. Triple net asset value is derived from net asset value by adjusting for the difference between the carrying<br />
value and the fair value of deferred tax assets and deferred tax liabilities.
The results of the calculation are as follows:<br />
All amounts in TEUR <strong>2006</strong>/<strong>07</strong> 2005/06<br />
Equity before minority interest 4,9<strong>07</strong>,297.5 1,661,971.7<br />
Goodwill -180,722.4<br />
Deferred tax assets -61,089.0 -23,042.5<br />
Deferred tax liabilities 473,099.1 5,138,585.2 186,946.7 1,825,876.0<br />
Property under construction (carrying value) 242,772.6 85,632.7<br />
Property under construction (fair value) 569,1<strong>07</strong>.9 326,335.3 95,387.3 9,754.6<br />
Inventories (carrying value) 81,694.3<br />
Inventories (fair value)<br />
Residual value of forward purchase contracts<br />
151,751.6 70,057.3<br />
and investments carried at cost 41,144.9<br />
Property held for sale (carrying value) 0.0 42,847.6<br />
Property held for sale (fair value) 0.0 0.0 54,125.0 11,277.4<br />
Shares in associated companies (carrying value) 372,468.8 21,574.4<br />
Shares in associated companies (fair value) 438,102.6 65,633.7 39,979.4 18,404.9<br />
Net Asset Value 5,641,756.5 1,865,312.9<br />
Number of shares (in 1,000) 555,882.8 222,353.1<br />
Net asset value per share (in EUR) 10.2 8.4<br />
Properties under construction and inventories were valued in accordance with the principles described under point<br />
3.4. The residual value resulting from the measurement of forward purchases and shares in other companies stated<br />
at cost represents the excess over the contractually agreed acquisition cost. This calculation was also based on a<br />
property valuation prepared by the experts named under point 3.4.<br />
The fair value of shares in associated companies was derived from the valuation of the Palladium property (Prague),<br />
which is owned by the EPG Group, and the valuation of the Lakeside project (Bratislava), which is owned by TriGránit<br />
Centrum a.s. The stake owned in TriGránit Holding Ltd. was not valued because the acquisition was concluded shortly<br />
before the balance sheet date.<br />
The NAV effect of forward purchase contracts is calculated as the difference between the gross development value<br />
and the acquisition value for <strong>IMMOEAST</strong> based on the fixed purchase yield. This difference is discounted back to the<br />
balance sheet date. The same applies to purchase options for the remaining shares in joint ventures.<br />
The NAV effect of inventories represents the difference between the carrying value and the residual value determined<br />
by the expert opinion.<br />
4.1.4b Triple net asset value (NNNAV)<br />
All amounts in TEUR 30 April 20<strong>07</strong><br />
Net asset value (NAV) 5,641,756.5 5,641,756.5<br />
Deferred taxes (present value) -8,554.0 -8,554.0<br />
Triple net asset value (NNNAV) 5,633,202.5<br />
Number of shares (in 1,000) 555,882.8<br />
Triple net asset value per share (in EUR) 10.1<br />
Notes<br />
<strong>Report</strong> by the Executive Board 189<br />
Highlights <strong>2006</strong>/<strong>07</strong><br />
Business Model and Strategy<br />
Portfolio Structure<br />
Corporate Governance and Outlook<br />
Property Portfolio<br />
Development of Business<br />
Consolidated Financial Statements<br />
Service and Glossary
190 <strong>IMMOEAST</strong> <strong>Annual</strong> <strong>Report</strong> <strong>2006</strong>/<strong>07</strong><br />
The calculation of EPRA NNNAV is based on the premise that any taxes due in connection with the sale of a property<br />
will reduce EPRA NAV accordingly. The strategy of the company is also reflected in computing the present value of<br />
taxes. For the above calculation, this means that the <strong>IMMOEAST</strong> strategy – which focuses on long-term investments<br />
– does not include the sale of properties, and the present value of the provisions for taxes therefore equals zero. The<br />
current provisions for deferred taxes were only discounted to present value in cases where plans call for the sale of<br />
the property (e.g. in the residential segment).<br />
Outstanding construction costs<br />
The list included below shows the outstanding construction and acquisition costs for all property projects, classified<br />
by country. These amounts reflect contractual obligations to acquire or produce property projects as well as the<br />
intention of <strong>IMMOEAST</strong> management to realise or complete these projects. The following table shows the budged<br />
amounts based on current estimates:<br />
Land with construction/redevelopment projects Purchase costs Total investment Completion<br />
Bulgaria 162,718.9 162,718.9 06/2008 – 06/2010<br />
Czech Republic 62,533.4 62,533.4 08/20<strong>07</strong> – 10/2010<br />
Poland 204,632.4 204,632.4 02/2008 – 11/2010<br />
Romania 183,895.6 183,895.6 01/2008 – 12/2010<br />
613,780.3 613,780.3<br />
Carrying amount Outstanding construction/<br />
Development projects (current) purchase costs Total investment Completion<br />
Czech Republic 26,905.7 180,366.3 2<strong>07</strong>,272.0 08/20<strong>07</strong> – 10/2010<br />
Hungary 35,114.4 370,996.9 406,111.4 08/20<strong>07</strong> – 10/2008<br />
Poland 547.0 23,832.0 24,379.0 02/2008 – 11/2010<br />
Romania 120,386.3 556,666.6 677,052.9 01/2008 – 12/2010<br />
Russia 42,222.1 577,<strong>07</strong>0.4 619,292.5 06/2009<br />
Slovakia 14,836.3 38,673.3 53,509.6 09/20<strong>07</strong> – 06/2009<br />
Ukraine 2,760.8 55,412.3 58,173.1 2009<br />
242,772.6 1,803,017.9 2,045,790.5<br />
Carrying amount Outstanding construction/<br />
Inventories (current) purchase costs Total investment Completion<br />
Bulgaria 4,542.7 12,879.2 17,421.9 05/20<strong>07</strong> – 11/20<strong>07</strong><br />
Serbia 2,734.7 6,726.3 9,461.0 12/20<strong>07</strong> – 09/2008<br />
Estonia 2,950.1 0.0 0.0 -<br />
Poland 7,653.1 34,610.1 42,263.2 <strong>07</strong>/20<strong>07</strong> – 06/2008<br />
Romania 45,410.9 163,680.2 209,091.1 06/2008 – 08/2009<br />
Slovakia 18,392.69 41,587.31 59,980.00 09/2009<br />
81,684.1 259,483.1 338,217.1<br />
Forward purchases and minority Carrying amount Outstanding construction/<br />
stakes with purchase options (current) purchase costs Total investment Completion<br />
Czech Republic 27,302.4 27,302.4 12/20<strong>07</strong> – 12/2008<br />
Hungary 131,248.1 131,248.1 08/20<strong>07</strong> – 10/2008<br />
Romania 193,402.0 193,402.0 01/2008 – 12/2010<br />
Slovakia 236,448.51 236,448.51 03/20<strong>07</strong> – 12/20<strong>07</strong><br />
588,401.0 588,401.0<br />
Total construction costs 3,264,682.3 3,586,188.9
The first category includes land that is recognised and measured in accordance with IAS 40 as well as investment<br />
properties that are undergoing redevelopment. The second section comprises properties recognised in accordance<br />
with IAS 16 and the third section properties recognised in accordance with IAS 2. The last list shows purchase commitments<br />
(based on the value of the property) arising from forward purchase contracts as well as contracts that<br />
permit the acquisition of joint venture shares and minority interests. The outstanding construction costs are based<br />
on projections and budgets.<br />
4.2 Other tangible assets<br />
Additional information on this balance sheet item is provided under point 3.6.<br />
The development of other tangible assets is as follows:<br />
Machinery and<br />
Other equipment,<br />
furniture, fixtures<br />
All amounts in TEUR equipment and office equipment Prepayments Total<br />
Cost as of 1 May 2005 0.0 2,328.9 804.0 3,133.0<br />
Change in consolidation range 673.3 598.5 20.9 1,292.7<br />
Change in consolidation method 0.0 86.3 0.0 86.3<br />
Currency translation adjustments 1.2 25.7 -1.5 25.5<br />
Additions 51.5 400.8 0.0 452.3<br />
Reclassification -550.2 -71.5 -802.5 -1,424.3<br />
Cost as of 30 April <strong>2006</strong> 175.7 3,368.8 20.9 3,565.4<br />
Accumulated depreciation as of 1 May 2005 0.0 1,645.2 0.0 1,645.2<br />
Change in consolidation method 0.0 77.4 0.0 77.4<br />
Currency translation adjustments 0.0 26.2 0.0 26.2<br />
Reclassification 0.0 -153.5 0.0 -153.5<br />
Depreciation for the year 19.5 257.2 0.0 276.7<br />
Accumulated depreciation as of 30 April <strong>2006</strong> 19.5 1,852.5 0.0 1,872.1<br />
Carrying value as of 30 April <strong>2006</strong> 156.2 1,516.3 20.9 1,693.3<br />
Cost as of 1 May <strong>2006</strong> 175.7 3,368.8 20.9 3,565.4<br />
Change in consolidation range 248.8 453.4 0.0 702.2<br />
Change in consolidation method 34.0 19.2 0.0 53.1<br />
Currency translation adjustments 14.0 166.5 1.1 181.6<br />
Additions 21.6 366.1 0.2 387.9<br />
Disposals -45.2 -81.7 0.0 -126.8<br />
Reclassification 2.8 -176.1 -22.0 -195.4<br />
Cost as of 30 April 20<strong>07</strong> 451.7 4,116.2 0.2 4,568.0<br />
Accumulated depreciation as of 1 May <strong>2006</strong> 19.5 1,852.5 0.0 1,872.1<br />
Change in consolidation method 4.8 3.2 0.0 8.0<br />
Currency translation adjustments 3.1 82.4 0.0 85.5<br />
Disposals -0.6 156.1 0.0 155.6<br />
Reclassification 0.0 -131.4 0.0 -131.4<br />
Depreciation for the year 69.2 351.7 0.0 420.9<br />
Accumulated depreciation as of 30 April 20<strong>07</strong> 96.1 2,314.6 0.0 2,410.6<br />
Carrying value as of 30 April 20<strong>07</strong> 355.6 1,801.6 0.2 2,157.4<br />
No impairment charges were recognised to other tangible assets during the reporting year.<br />
Notes<br />
<strong>Report</strong> by the Executive Board 191<br />
Highlights <strong>2006</strong>/<strong>07</strong><br />
Business Model and Strategy<br />
Portfolio Structure<br />
Corporate Governance and Outlook<br />
Property Portfolio<br />
Development of Business<br />
Consolidated Financial Statements<br />
Service and Glossary<br />
IAS 16.73 (d),<br />
(e)
192 <strong>IMMOEAST</strong> <strong>Annual</strong> <strong>Report</strong> <strong>2006</strong>/<strong>07</strong><br />
IAS 38.118<br />
IAS 38.122<br />
(a), (d)<br />
4.3 Intangible assets and goodwill<br />
4.3.1 Intangible assets<br />
Additional information on this balance sheet position is provided under point 3.2.<br />
The development of intangible assets is shown below:<br />
All amounts in TEUR Other intangible assets<br />
Cost as of 1 May 2005 2,368.1<br />
Change in consolidation method 113.9<br />
Currency translation adjustments 81.7<br />
Additions 1.7<br />
Reclassification -176.6<br />
Cost as of 30 April <strong>2006</strong> 2,388.8<br />
Accumulated amortisation as of 1 May 2005 147.2<br />
<strong>IMMOEAST</strong> has no intangible assets with an indefinite useful life, and no intangible assets are encumbered.<br />
4.3.2 Goodwill<br />
Additional information on this balance sheet position is provided under point 3.3.1.<br />
All amounts in TEUR Other intangible assets<br />
Cost as of 1 May <strong>2006</strong> 2,388.8<br />
Change in consolidation range 4.1<br />
Change in consolidation method 3.7<br />
Currency translation adjustments 117.5<br />
Additions 227.8<br />
Disposals 0.0<br />
Reclassification 0.0<br />
Cost as of 30 April 20<strong>07</strong> 2,741.9<br />
Change in consolidation method 101.3<br />
Currency translation adjustments 4.5 Accumulated amortisation as of 1 May <strong>2006</strong> 421.1<br />
Disposals -0.7 Change in consolidation method 0.7<br />
Reclassification -0.4 Currency translation adjustments 25.1<br />
Amortisation for the year 169.1 Disposals 0.0<br />
Accumulated amortisation as of 30 April <strong>2006</strong> 421.1 Reclassification 0.0<br />
Carrying value as of 30 April <strong>2006</strong> 1,967.8 Amortisation for the year 242.3<br />
Accumulated amortisation as of 30 April 20<strong>07</strong> 689.2<br />
Carrying value as of 30 April 20<strong>07</strong> 2,052.7<br />
In order to test goodwill for impairment, the carrying value of the cash-generating unit is increased by the carrying<br />
value of goodwill. The total amount is then compared with the recoverable amount of the cash-generating unit. Any<br />
negative difference is recognised as an impairment charge to goodwill. The acquisition of project companies generally<br />
leads to positive goodwill because of the obligation to record deferred tax liabilities on revalued properties.<br />
The unequal valuation of these deferred tax liabilities – which, in contrast to other acquired net assets, may not be<br />
discounted according to IFRS 3.57b in connection with IFRS 3.B16 (i) and IAS 12.53 – results in goodwill as a technical<br />
figure.<br />
Additional information on the recognition and measurement of goodwill is provided under point 3.3.1. During <strong>2006</strong>/<strong>07</strong><br />
TEUR 43,244,1 (2005/06: TEUR 30,729,6) of newly acquired goodwill was written off through the income statement<br />
in accordance with IFRS 3.54. The development of goodwill is as follows:
All amounts in TEUR Goodwill<br />
Carrying value as of 30 April 2005 0.0<br />
Additions 31,093.3<br />
Currency translation adjustments -363.7<br />
Impairment -30 729.6<br />
Carrying value as of 30 April <strong>2006</strong> 0.0<br />
Addition from initial consolidation 205,671.5<br />
Addition from transition consolidation 18,445,9<br />
Currency translation adjustments -151.0<br />
Impairment -43,244.0<br />
Carrying value as of 30 April 20<strong>07</strong> 180,722.4<br />
4.3.2a Impairment test with resulting impairment charge<br />
The following section explains the impairment tests that resulted in the major impairment charges:<br />
4.3.2a.1 Equator/Zenith/Cirrus/Nimbus<br />
Goodwill 7,899.9<br />
Carrying value of cash-generating unit 17,335.8<br />
Deferred tax liability -2,550.2<br />
22,685.5<br />
Fair value of cash-generating unit 17,335.8<br />
Fair value of deferred tax liability 0.0<br />
17,335.8<br />
Impairment 5,349.7<br />
4.3.2a.2 Rostokinǒ<br />
Goodwill 13,086.5<br />
Carrying value of cash-generating unit 42,222.1<br />
Deferred tax liability -8,868.2<br />
46,440.5<br />
Fair value of cash-generating unit 42,222.1<br />
Fair value of deferred tax liability 0.0<br />
42,222.1<br />
Impairment 4,218.4<br />
4.3.2a.3 BB Centrum Building B<br />
Goodwill 8,515.2<br />
Carrying value of cash-generating unit 43,637.4<br />
Deferred tax liability -6,327.2<br />
45,825.4<br />
Fair value of cash-generating unit 43,637.4<br />
Fair value of deferred tax liability 0.0<br />
43,637.4<br />
Impairment 2,188.0<br />
Notes<br />
The impairment charge recognised to the goodwill<br />
that was allocated to the cash-generating unit<br />
Equator/Zenith/Cirrus/Nimbus resulted from the<br />
purchase price premium for the acquisition of all<br />
four property elements (also see 2.3.1.1.1.3).<br />
The impairment charge recognised to the goodwill<br />
that was allocated to the cash-generating unit<br />
Rostokinǒ is related to reserves in this development<br />
project, which were not available as of the balance<br />
sheet date (also see 2.3.1.2.1.2).<br />
The impairment charge recognised to the goodwill<br />
that was allocated to the cash-generating unit Centrum<br />
Building B resulted from a decline in the value<br />
of the property in comparison with the acquisition<br />
date (also see 2.3.1.3.1.4).<br />
<strong>Report</strong> by the Executive Board 193<br />
Highlights <strong>2006</strong>/<strong>07</strong><br />
Business Model and Strategy<br />
Portfolio Structure<br />
Corporate Governance and Outlook<br />
Property Portfolio<br />
Development of Business<br />
Consolidated Financial Statements<br />
Service and Glossary<br />
IFRS 3.75
194 <strong>IMMOEAST</strong> <strong>Annual</strong> <strong>Report</strong> <strong>2006</strong>/<strong>07</strong><br />
4.3.2a.4 Bucharest Distribution Park<br />
Goodwill 4,181.7<br />
Carrying value of cash-generating unit 10,320.1<br />
Deferred tax liability 0.0<br />
14,501.8<br />
Fair value of cash-generating unit 10,320.1<br />
Fair value of deferred tax liability 0.0<br />
10,320.1<br />
Impairment 4,181.7<br />
4.3.2a.5 Brno Estates<br />
Goodwill 21,798.0<br />
Carrying value of cash-generating unit 79,028.2<br />
Deferred tax liability -14,299.3<br />
86,526.9<br />
Fair value of cash-generating unit 79,028.2<br />
Fair value of deferred tax liability 0.0<br />
79,028.2<br />
Impairment 7,498.7<br />
4.3.2a.6 Alacor<br />
Goodwill 12,499.0<br />
Carrying value of cash-generating unit 2,760.8<br />
Deferred tax liability -341.5<br />
14,918.3<br />
Fair value of cash-generating unit 2,760.8<br />
Fair value of deferred tax liability 0.0<br />
2,760.8<br />
Impairment 12,157.5<br />
4.3.2a.7 Golden Babylon I and II<br />
Goodwill 50,317.7<br />
Carrying value of cash-generating unit 159,500.2<br />
Deferred tax liability -50,144.1<br />
159,673.7<br />
Fair value of cash-generating unit 159,500.2<br />
Fair value of deferred tax liability 0.0<br />
159,500.2<br />
Impairment 173.5<br />
The impairment charge recognised to the goodwill<br />
that was allocated to the cash-generating unit<br />
Bucharest Distribution Park resulted from insufficient<br />
reserves as of the balance sheet date.<br />
The impairment charge recognised to the goodwill<br />
that was allocated to the cash-generating unit<br />
Brno Estates resulted from the high variable purchase<br />
price component (earn-out), which was not<br />
reflected in the valuation of the property (also see<br />
2.3.1.1.3.5).<br />
The impairment charge recognised to the goodwill<br />
that was allocated to the cash-generating unit Alacor<br />
resulted from insufficient reserves as of the balance<br />
sheet date (also see 2.3.1.2.2.1).<br />
The impairment charge recognised to goodwill allocated<br />
to the cash-generating units Golden Babylon I<br />
and II is attributable to the deferred tax liability that<br />
resulted from the low tax bases of these properties<br />
as well as an increase in the value of the Rouble<br />
after the acquisition date (also see 2.3.1.2.1.1).
4.3.2a.8 Centre Invest<br />
Goodwill 4,063.7<br />
Carrying value of cash-generating unit 17,114.6<br />
Deferred tax liability -3,350.7<br />
17,827.6<br />
Fair value of cash-generating unit 17,114.6<br />
Fair value of deferred tax liability 0.0<br />
17,114.6<br />
Impairment 713.0<br />
4.3.2a.9 Passat<br />
Goodwill 2,982.4<br />
Carrying value of cash-generating unit 28,741.2<br />
Deferred tax liability -2,928.1<br />
28,795.5<br />
Fair value of cash-generating unit 28,741.2<br />
Fair value of deferred tax liability 0.0<br />
28,741.2<br />
Impairment 54.3<br />
4.3.2a.10 Delta Park<br />
Goodwill 6,936.4<br />
Carrying value of cash-generating unit 44,949.8<br />
Deferred tax liability -6,243.3<br />
45,642.8<br />
Fair value of cash-generating unit 44,949.8<br />
Fair value of deferred tax liability 0.0<br />
44,949.8<br />
Impairment 693.1<br />
4.3.2a.11 Central Business Centre<br />
Goodwill 2,103.1<br />
Carrying value of cash-generating unit 20,481.7<br />
Deferred tax liability -1,740.9<br />
20,843.9<br />
Fair value of cash-generating unit 20,481.7<br />
Fair value of deferred tax liability 0.0<br />
20,481.7<br />
Impairment 362.2<br />
Notes<br />
The impairment charge recognised to the goodwill<br />
that was allocated to the cash-generating unit<br />
Centre Invest resulted from insufficient revaluation<br />
results (also see 2.3.1.1.3.5).<br />
The impairment charge recognised to the goodwill<br />
that was allocated to the cash-generating unit Passat<br />
resulted from insufficient revaluation results<br />
(also see 2.3.1.1.1.7).<br />
The impairment charge recognised to the goodwill<br />
that was allocated to the cash-generating unit Delta<br />
Park resulted from insufficient revaluation results<br />
(also see 2.3.1.1.3.5).<br />
The impairment charge recognised to the goodwill<br />
that was allocated to the cash-generating unit<br />
Central Business Center resulted from insufficient<br />
revaluation results (also see 2.3.1.1.4.1).<br />
<strong>Report</strong> by the Executive Board 195<br />
Highlights <strong>2006</strong>/<strong>07</strong><br />
Business Model and Strategy<br />
Portfolio Structure<br />
Corporate Governance and Outlook<br />
Property Portfolio<br />
Development of Business<br />
Consolidated Financial Statements<br />
Service and Glossary
196 <strong>IMMOEAST</strong> <strong>Annual</strong> <strong>Report</strong> <strong>2006</strong>/<strong>07</strong><br />
IAS 36.134<br />
IAS 36.134<br />
IAS 36.134<br />
IAS 36.134<br />
4.3.2b Impairment test without resulting impairment charge<br />
The following section explains the impairment tests for material goodwill recognised by the company:<br />
4.3.2b.1 5th Avenue<br />
Goodwill 20,988.5<br />
Carrying value of cash-generating unit 119,845.6<br />
Deferred tax liability -23,644.7<br />
117,189.4<br />
Fair value of cash-generating unit 119,845.6<br />
Fair value of deferred tax liability 0.0<br />
119,845.6<br />
Surplus -2,656.2<br />
4.3.2b.2 Mester Park<br />
Goodwill 4,103.0<br />
Carrying value of cash-generating unit 34,310.3<br />
Deferred tax liability -2,794.0<br />
35,619.3<br />
Fair value of cash-generating unit 180,013.7<br />
Fair value of deferred tax liability 0.0<br />
180,013.7<br />
Surplus -144,394.4<br />
4.3.2b.3 Atom Centrum<br />
Goodwill. 7,642.5<br />
Carrying value of cash-generating unit 59,998.1<br />
Deferred tax liability -10,577.3<br />
57,063.3<br />
Fair value of cash-generating unit 59,998.1<br />
Fair value of deferred tax liability 0.0<br />
59,998.1<br />
Surplus -2,934.8<br />
4.3.2b.4 Skofin<br />
Goodwill 1,708.3<br />
Carrying value of cash-generating unit 15,936.7<br />
Deferred tax liability -2,575.6<br />
15,069.5<br />
Fair value of cash-generating unit 15,936.7<br />
Fair value of deferred tax liability 0.0<br />
15,936.7<br />
Surplus -867.2<br />
The goodwill recognised for the cash-generating<br />
unit 5th Avenue is covered by sufficient revaluation<br />
results (see 2.3.1.2.1.3).<br />
The goodwill recognised for the cash-generating<br />
unit Mester Park can be covered by sufficient undisclosed<br />
reserves from the property valuation.<br />
The goodwill recognised for the cash-generating<br />
unit Atom Centrum can be covered by sufficient<br />
revaluation gains (see 2.3.2).<br />
The goodwill recognised for the cash-generating<br />
unit Skofin can be covered by sufficient revaluation<br />
gains (see 2.3.1.1.3.1).
4.3.2b.5 BB Centrum Building C<br />
Goodwill 5,970.1<br />
Carrying value of cash-generating unit 60,905.9<br />
Deferred tax liability -10,844.4<br />
56,031.7<br />
Fair value of cash-generating unit 60,905.9<br />
Fair value of deferred tax liability 0.0<br />
60,905.9<br />
Surplus -4,874.2<br />
4.3.2b.6 BB Diamond Point<br />
Goodwill 4,171.6<br />
Carrying value of cash-generating unit 47,930.3<br />
Deferred tax liability -7,429.6<br />
44,672.4<br />
Fair value of cash-generating unit 47,930.3<br />
Fair value of deferred tax liability 0.0<br />
47,930.3<br />
Surplus -3,258.0<br />
4.3.2b.7 Grand Centar<br />
Goodwill 2,487.8<br />
Carrying value of cash-generating unit 164.2<br />
Deferred tax liability -4,133.0<br />
-1,480.9<br />
Fair value of cash-generating unit 164.2<br />
Fair value of deferred tax liability 0.0<br />
164.2<br />
Surplus -1,645.2<br />
4.3.2b.8 Victoria Park Buildings II to IV<br />
Goodwill 2,420.3<br />
Carrying value of cash-generating unit 40,213.1<br />
Deferred tax liability -4,496.3<br />
38,137.1<br />
Fair value of cash-generating unit 43,009.0<br />
Fair value of deferred tax liability 0.0<br />
43,009.0<br />
Surplus -4,871.9<br />
Notes<br />
The goodwill recognised for the cash-generating<br />
unit BB Centrum Building C can be covered by<br />
sufficient revaluation gains (see 2.3.1.1.3.4).<br />
The goodwill recognised for the cash-generating<br />
unit Diamond Point can be covered by sufficient<br />
revaluation gains (see 2.3.1.1.3.2).<br />
The goodwill recognised for the cash-generating<br />
unit Grand Centar can be covered by sufficient<br />
revaluation gains (see 2.3.1.3.2.1).<br />
The goodwill recognised for the cash-generating<br />
unit Victoria Park Buildings II to IV can be covered<br />
by sufficient undisclosed reserves from the property<br />
valuation (see 2.3.1.3.3.13).<br />
<strong>Report</strong> by the Executive Board 197<br />
Highlights <strong>2006</strong>/<strong>07</strong><br />
Business Model and Strategy<br />
Portfolio Structure<br />
Corporate Governance and Outlook<br />
Property Portfolio<br />
Development of Business<br />
Consolidated Financial Statements<br />
Service and Glossary<br />
IAS 36.134<br />
IAS 36.134<br />
IAS 36.134<br />
IAS 36.134
198 <strong>IMMOEAST</strong> <strong>Annual</strong> <strong>Report</strong> <strong>2006</strong>/<strong>07</strong><br />
IAS 36.134<br />
IAS 36.134<br />
IAS 36.134<br />
4.3.2b.9 Arkadia<br />
Goodwill 1,483.0<br />
Carrying value of cash-generating unit 15,204.0<br />
Deferred tax liability -1,820.8<br />
14,866.2<br />
Fair value of cash-generating unit 15,204.0<br />
Fair value of deferred tax liability 0.0<br />
15,204.0<br />
Surplus -337.8<br />
4.3.2b.10 Kranj<br />
Goodwill 1,378.5<br />
Carrying value of cash-generating unit 21,943.8<br />
Deferred tax liability -3,211.2<br />
20,111.1<br />
Fair value of cash-generating unit 21,943.8<br />
Fair value of deferred tax liability 0.0<br />
21,943.8<br />
Surplus -1,832.7<br />
4.3.2b.10 BB Centrum Building A<br />
Goodwill 9,203.8<br />
Carrying value of cash-generating unit 71,243.3<br />
Deferred tax liability -10,986.0<br />
69,461.2<br />
Fair value of cash-generating unit 71,243.3<br />
Fair value of deferred tax liability 0.0<br />
71,243.3<br />
Surplus -1,782.2<br />
4.3.3 Negative goodwill (excess)<br />
Additional information on this balance sheet position is provided under point 3.3.2.<br />
Negative goodwill from business combinations that<br />
took place before the 2004/05 financial year, was<br />
recorded through equity without recognition to profit<br />
or loss in accordance with IFRS 3.81. For negative<br />
goodwill acquired during the reporting year, IFRS 3.56<br />
(a) requires a reassessment of the identification and<br />
measurement of the amounts resulting from the purchase<br />
price allocation. Any remaining excess of net<br />
assets over the purchase price is recognised immediately<br />
in profit or loss in agreement with IFRS 3.56<br />
(b) (also see point 3.3.2). The resulting amount of<br />
TEUR 5,015.2 (2005/06: TEUR 43,951.0) was recorded<br />
under other operating income.<br />
The goodwill recognised for the cash-generating<br />
unit Arkadia can be covered by sufficient revaluation<br />
gains (see 2.3.1.1.2.2).<br />
The goodwill recognised for the cash-generating<br />
unit Kranj can be covered by sufficient revaluation<br />
gains (see 2.3.1.3.5.1).<br />
The goodwill recognised for the cash-generating<br />
unit BB Centrum Building A can be covered by<br />
sufficient revaluation gains (see 2.3.1.1.3.4).<br />
The development of negative goodwill is shown in the following<br />
table:<br />
All amounts in TEUR Negative goodwill<br />
Carrying value as of 30 April 2005 0.0<br />
Additions -45,474.9<br />
Currency translation adjustments 1,524.0<br />
Reversal through profit and loss 43,951.0<br />
Carrying value as of 30 April <strong>2006</strong> 0.0<br />
Additions -5,016.4<br />
Currency translation adjustments 1.2<br />
Reversal through profit and loss 5,015.2<br />
Carrying value as of 30 April 20<strong>07</strong> 0.0
4.3.4 Differences arising from the consolidation of liabilities on the acquisition of puttable instruments<br />
Shares in partnerships were recorded in 2005/06 based on the requirements of IAS 32.18 (b).<br />
In contrast to this procedure, the carrying value of these investments was offset against the proportional share of<br />
equity in newly acquired partnerships during the consolidation of equity and not during the consolidation of liabilities<br />
in <strong>2006</strong>/<strong>07</strong>.<br />
Differences of TEUR 0.0 (2005/06: TEUR 7.1) arising from the consolidation of liabilities were recognised to the income<br />
statement and included under other operating expenses (see point 5.6).<br />
4.4 Shares in associated companies<br />
Additional information on this balance sheet position is provided under point 2.2.2<br />
The cost and carrying values of shares in associated companies are comprised of the following:<br />
All amounts in TEUR European Property Group TriGránit Holding TriGránit Centrum a.s. Mester Park Kft. M.O.F. Immobilien AG Total<br />
Cost as of 1 May 19,783.5 0.0 0.0 9,562.3 3.8 29,349.6<br />
Additions 0.0 354,119.1 4,140.5 0.0 0.0 358,259.6<br />
Disposals 0.0 0.0 0.0 -9,562.3 -3.8 -9,566.1<br />
Cost as of 30 April 19,783.5 354,119.1 4,140.5 0.0 0.0 378,043.1<br />
Carrying value as of 1 May 13,342.4 0.0 0.0 8,228.1 3.8 21,574.3<br />
Additions 0.0 354,119.1 4,140.5 0.0 0.0 358,259.6<br />
Disposals<br />
Changes in shareholders’ equity<br />
0.0 0.0 0.0 -8,228.1 -3.8 -8,231.9<br />
of associates<br />
Share of profit/(loss) from investments<br />
155.5 0.0 10.7 0.0 0.0 166.2<br />
in other companies -989.8 1,554.4 135.9 0.0 0.0 700.6<br />
Carrying value as of 30 April 12,508.1 355,673.5 4,287.1 0.0 0.0 372,468.8<br />
<strong>Report</strong> by the Executive Board 199<br />
Highlights <strong>2006</strong>/<strong>07</strong><br />
Business Model and Strategy<br />
Portfolio Structure<br />
Corporate Governance and Outlook<br />
Property Portfolio<br />
Development of Business<br />
Consolidated Financial Statements<br />
Service and Glossary<br />
30 April <strong>2006</strong><br />
European M.O.F.<br />
All amounts in TEUR Property Group Mester Park Kft. Immobilien AG Total<br />
Cost as of 1 May 2005 19,783.5 9,562.3 0.0 29,345.8<br />
Additions 0.0 0.0 3.8 3.8<br />
Cost as of 30 April 19,783.5 9,562.3 3.8 29,349.6<br />
Carrying value as of 1 May 16,123.0 9,046.9 0.0 25,169.9<br />
Additions 0.0 0.0 3.8 3.8<br />
Changes in shareholders’ equity of associates 362.5 -217.6 0.0 145.0<br />
Distribution -2,541.3 0.0 0.0 -2,541.3<br />
Share of profit/(loss) from investments in other companies -601.9 -601.2 0.0 -1,203.1<br />
Notes<br />
Carrying value as of 30 April 13,342.4 8,228.1 3.8 21,574.3<br />
Shares in associated companies include a 25% stake in European Property Group Ltd. and a 25% stake in TriGránit<br />
Holding and TriGránit Centrum a.s.
200 <strong>IMMOEAST</strong> <strong>Annual</strong> <strong>Report</strong> <strong>2006</strong>/<strong>07</strong><br />
IAS 28.39<br />
IAS 28.37<br />
As of 1 November <strong>2006</strong> the investment in Mester Park Ost Bt. and Mester Park Kft. was increased from 45% to 75%,<br />
which resulted in a changeover from equity valuation to full consolidation (also see point 2.2 Structural changes).<br />
M.O.F. Immobilien AG was classified as an IAS 39 investment in <strong>2006</strong>/<strong>07</strong> due to a lack of consolidated information<br />
prepared and reported in accordance with IFRS (also see point 4.5).<br />
The proportionalshare of changes in the equity of associated companies, which were included in the consolidated<br />
financial statements without recognition through profit or loss in accordance with IAS 28.11, comprise a hedging<br />
reserve of TEUR 45.3 (2005/06: TEUR 276.6) from the consolidated financial statements of the European Property<br />
Group Ltd. and foreign currency differences of TEUR 121.0 (2005/06: TEUR –131.6).<br />
The aggregated net assets of associated companies are as follows:<br />
30 April 20<strong>07</strong> 30 April <strong>2006</strong><br />
European TriGránit TriGránit European Mester Park M.O.F.<br />
All amounts in TEUR Property Group1) Holding1) Centrum a.s. 2) Property Group3) Kft. 4) Immobilien AG<br />
Property 567.0 109,063.0 13,443.8 112,051.0 10,441.7 0.0<br />
Other non-current assets 121,013.0 233,787.0 24.1 460.0 28.0 0.0<br />
Current assets 12,666.0 97,585.0 2,355.2 13,004.0 753.0 3.8<br />
Total assets 134,246.0 440,435.0 15,823.1 125,515.0 11,222.7 3.8<br />
Equity 69,529.0 169,968.0 1,183.7 77,673.0 9,424.9 3.8<br />
Non-current liabilities 61,324.0 241,6<strong>07</strong>.0 9,797.5 44,955.0 752.7 0.0<br />
Current liabilities 3,393.0 28,860.0 4,841.9 2,887.0 1,045.1 0.0<br />
Total equity and liabilities 134,246.0 440,435.0 15,823.1 125,515.0 11,222.7 3.8<br />
1) 31 December <strong>2006</strong> 2) 30 April 20<strong>07</strong> 3) 31 March <strong>2006</strong> 4) consolidated<br />
The aggregated income statement for the associated companies is as follows:<br />
<strong>2006</strong>/<strong>07</strong> 2005/06<br />
European TriGránit TriGránit European Mester Park M.O.F.<br />
All amounts in TEUR Property Group1) Holding1) Centrum a.s. 2) Property Group3) Kft. 4) Immobilien AG<br />
Revenues 3,110.0 4,320.0 0.0 535.0 667.2 0.0<br />
Operating profit -4,578.0 28,149.0 -336.1 -406.0 -603.7 0.0<br />
Financial results 127.0 -8,893.0 1,032.1 23.0 53.5 0.0<br />
Earnings before tax -4,451.0 19,256.0 696.1 -383.0 -550.2 0.0<br />
1) 31 December <strong>2006</strong> 2) 30 April 20<strong>07</strong> 3) 31 March <strong>2006</strong> 4) consolidated<br />
4.5 Other financial instruments<br />
Additional information on this balance sheet position is provided under point 3.10.<br />
The development of financial instruments is shown in the following table:<br />
Investments in Financial<br />
All amounts in TEUR other companies instruments Total<br />
Cost as of 1 May <strong>2006</strong> 75,878.8 1,000.3 76,879.1<br />
Additions 171,321.2 7,688.5 179,009.7<br />
Disposals 0.0 -2,664.0 -2,664.0<br />
Currency translation effects 0.0 22.2 22.2<br />
Cost as of 30 April 20<strong>07</strong> 247,200.0 6,047.0 253,247.0<br />
Carrying value as of 30 April <strong>2006</strong> 93,089.3 1,000.3 94,089.6<br />
Carrying value as of 30 April 20<strong>07</strong> 283,957.8 6,316.4 290,274.2
Investments in other companies include an atypical silent partner investment in “Wienerberg City” Errichtungsgesellschaft<br />
m.b.H., which has an acquisition cost of TEUR 10,000. <strong>IMMOEAST</strong> Beteiligungs GmbH as the atypical silent<br />
partner participates in the profit and loss, and total assets of the company (including goodwill and undisclosed<br />
reserves) in proportion to its investment. The allocation of losses is limited to a maximum of 120% of the silent partner<br />
contribution. During the <strong>2006</strong>/<strong>07</strong> financial year, a revaluation of TEUR 1,300.1 was recorded to this investment,<br />
but not recognised through profit or loss. The carrying value totalled TEUR 11,<strong>07</strong>5.9 as of 30 April 20<strong>07</strong>.<br />
Financial instruments comprise securities and derivatives. Information on the conditions and market values of the<br />
derivatives is provided under points 8.1.2.2.1.2 and 8.1.2.2.2.<br />
The conditions of the remaining investments in other companies are as follows:<br />
The total commitment of <strong>IMMOEAST</strong> in Polonia Property Fund Ltd. equals TEUR 20,000.0, whereby the focal point of<br />
investments made by this fund is placed on Poland, Hungary and the Czech Republic.<br />
The investment activities of Heitman Central Europe Property Partners II also concentrate on Poland, Hungary, the<br />
Czech Republic and Slovakia in the CEE segment. The total commitment of <strong>IMMOEAST</strong> in this investment equals<br />
TEUR 20,000.0, with a term limited to the end of 2009.<br />
In addition, <strong>IMMOEAST</strong> holds three investments that focus exclusively on the CIS segment. The total commitment<br />
amounts to TEUR 48,204.9 in Eastern Property Holdings Ltd., TEUR 93,142.6 in FF&P Russia Real Estate Ltd. and<br />
TEUR 18,375.6 in the FF&P Development Fund.<br />
Heitman Central Europe Property Partners III invests in Poland, Hungary, the Czech Republic, Slovakia, Bulgaria and<br />
Romania as well as in the CEE and SEE segments. The total commitment of <strong>IMMOEAST</strong> equals TEUR 25,000.0 and<br />
ends in 2015.<br />
<strong>IMMOEAST</strong> holds a total commitment of TEUR 36,000.0 in the Global Emerging Property Fund, whose investment<br />
activities focus primarily on Romania, Bulgaria and Serbia. The term of this commitment is also limited to 2015.<br />
<strong>Report</strong> by the Executive Board 201<br />
Highlights <strong>2006</strong>/<strong>07</strong><br />
Business Model and Strategy<br />
Portfolio Structure<br />
Corporate Governance and Outlook<br />
Property Portfolio<br />
Development of Business<br />
Consolidated Financial Statements<br />
Service and Glossary<br />
Revaluation/ Revaluation/<br />
impairment impairment Group<br />
Group carrying Additions/ charges through charges through carrying Distribu-<br />
Total Focus of value as of disposals in profit/loss in profit/loss in value as of tions in<br />
All amounts in TEUR Commitment investment Term 30.4.<strong>2006</strong> <strong>2006</strong>/<strong>07</strong> <strong>2006</strong>/<strong>07</strong> <strong>2006</strong>/<strong>07</strong> per 30.4.20<strong>07</strong> <strong>2006</strong>/<strong>07</strong><br />
Polonia Property Fund Ltd.<br />
Heitman Central Europe<br />
20,000.0 PL, H, CZ Mid-2010 19,256.2 6,260.0 0.0 5,368.6 31,538.3 0.0<br />
Property Partners II 20,000.0 PL, H, CZ, SK End of 2009 19,274.4 684.3 0.0 733.5 20,038.6 3,777.8<br />
Eastern Property Holdings Ltd. 48,204.9 CIS 15,725.3 36,222.2 4,698.3 0.0 56,645.7 216.0<br />
FF&P Russia Real Estate Ltd. 93,142.6 CIS Mid-2009 16,275.5 24,119.3 -947.1 0.0 39,447.8 597.7<br />
Global Emerging Property Fund<br />
Heitman Central Europe Property<br />
36,000.0 RO, BG, SBR Mid-2015 4,415.4 16,281.3 7,848.0 0.0 28,544.7 0.0<br />
Partners III 25,000.0 PL, H, CZ, SK, BG, RO Mid-2015 3,1<strong>07</strong>.1 8,224.3 484.6 0.0 11,816.0 0.0<br />
Prime Property BG Reit 11,766.2 BG 5,259.7 7,127.8 -510.4 0.0 11,877.1 0.0<br />
Bluehouse Accession Property II 30,000.0 BG, RO End of 2016 0.0 5,250.0 841.2 0.0 6,091.2 0.0<br />
MOF Immobilien AG 50,000.0 A, CRO, SRB, UA, BG End of 2009 0.0 2,130.0 0.0 0.0 2,130.0 0.0<br />
Adama 160,341.1 RO, BG, MD 0.0 26,724.7 0.0 0.0 26,724.7 0.0<br />
FF&P Development Fund 18,375.6 CIS Start of 2010 0.0 7,981.9 0.0 0.0 7,981.9 0.0<br />
Europa Emerging Europe Fund Ltd. 25,000.0 SRB, TR, UA, MK, MNE Start of 2015 0.0 0.0 0.0 0.0 0.0 0.0<br />
Dikare Holdings Ltd.<br />
Polus Transilvania Companie<br />
5,302.0 RO 0.0 1,575.0 0.0 0.0 1,575.0 0.0<br />
de Investitii S.A. 185,000.0 RO 0.0 28,470.9 0.0 0.0 28,470.9 0.0<br />
Notes
202 <strong>IMMOEAST</strong> <strong>Annual</strong> <strong>Report</strong> <strong>2006</strong>/<strong>07</strong><br />
The total commitment of <strong>IMMOEAST</strong> in Prime Property BG Reit equals TEUR 11,766.2; this firm focuses on projects in<br />
Bulgaria. <strong>IMMOEAST</strong> also holds an investment in Bluehouse Accession Property II, which concentrates on Bulgaria<br />
und Romania; the total commitment equals TEUR 30,000.0 and has a term that expires at the end of 2015.<br />
MOF Immobilien AG, which is included in the consolidated financial statements as of 30 April <strong>2006</strong> at equity, is now<br />
classified as an IAS 39 investment. The investment activities of MOF Immobilien AG are focused primarily on Austria,<br />
Croatia, Serbia, Ukraine and Bulgaria, and <strong>IMMOEAST</strong> has a total commitment of TEUR 50,000.0.<br />
The second highest total commitment held by <strong>IMMOEAST</strong> is an investment of TEUR 160,341.1 in Adama. This firm<br />
concentrates on projects in Romania, Bulgaria and Moldavia in South-eastern Europe.<br />
Europa Emerging Europe Fund Ltd. invests chiefly in Bulgaria, Romania, Croatia, Serbia, Turkey, Ukraine, Macedonia<br />
and Montenegro. The total commitment of <strong>IMMOEAST</strong> equals in TEUR 25,000.0 and ends in 2015.<br />
A further IAS 39 investment is the stake held in Dikare Holdings Ltd., which focuses on Romania. The total commitment<br />
of <strong>IMMOEAST</strong> equals TEUR 5,302.0.<br />
At TEUR 185,000.0, Polus Transilvania Companie de Investitii S.A. represents the highest total commitment held by<br />
<strong>IMMOEAST</strong>. Polus Transilvania Companie de Investitii S.A. invests exclusively in Romania.<br />
The following table shows the fair values of investments in other companies,<br />
which are not recognised through profit or loss:<br />
All amounts in TEUR 30 April 20<strong>07</strong> 30 April <strong>2006</strong><br />
Polonia Property Fund Ltd. 31,583.3 19,256.2<br />
Heitman Central Europe Property Partners II 20,038.7 19,274.4<br />
“Wienerberg City” Errichtungsgesellschaft m.b.H. 11,<strong>07</strong>5.9 9,775.8<br />
Polus Transilvania Companie de Investitii S.A. 28,470.9 0.0<br />
Total 91,123.8 48,306.4<br />
The following table shows the fair values of investments in other companies,<br />
which are recognised through profit or loss:<br />
All amounts in TEUR 30 April 20<strong>07</strong> 30 April <strong>2006</strong><br />
Eastern Property Holdings Ltd. 56,645.7 15,725.3<br />
FF&P Russia Real Estate Ltd. 39,447.8 16,275.5<br />
Global Emerging Property Fund 28,544.7 4,415.4<br />
Heitman Central Europe Property Partners III 11,816.0 3,1<strong>07</strong>.1<br />
Prime Property BG Reit 11,877.1 5,259.7<br />
Bluehouse Accession Property II 6,091.2 0.0<br />
M.O.F. Immobilien AG 2,130.0 0.0<br />
Adama 26,724.7 0.0<br />
FF&P Development Fund 7,981.9 0.0<br />
Europa Emerging Europe Fund Ltd. 0.0 0.0<br />
Dikare Holdings Ltd. 1,575.0 0.0<br />
Total 192,834.0 44,783.0
The other investments recognised at fair value through profit and loss are part of a portfolio, whose results are<br />
measured on the basis of fair value and also reported regularly on this basis to management. These investments are<br />
irrevocably allocated to the category “at fair value through profit or loss” as of the acquisition date.<br />
The fair value of properties held through investments in other companies totalled EUR 786.9 million as of 30 April<br />
20<strong>07</strong> (2005/06: EUR 176.7 mill.):<br />
The following table compares the carrying value of financial instruments with their present value:<br />
Amortised Fair value not Fair value through Carrying value Carrying value<br />
All amounts in TEUR cost through profit or loss profit or loss 30 April 20<strong>07</strong> 30 April 20<strong>07</strong><br />
ASSETS<br />
Receivables and other assets<br />
Loans and receivables<br />
Other financial instruments<br />
1,290,901.5 1,290,901.5 1,290,901.5<br />
Designated at fair value through profit and loss 192,834.0 192,834.0 192,834.0<br />
Held for trading 2,004.4 2,004.4 2,004.4<br />
Available for sale<br />
Financial instruments<br />
95,435.8 95,435.8 95,435.8<br />
Held for trading 300,000.0 300,000.0 300,000.0<br />
Cash and cash equivalents<br />
Loans and receivables 402,146.3 402,146.3 402,146.3<br />
EQUITY AND LIABILITIES<br />
Financial liabilities<br />
Measured at amortised cost<br />
Trade accounts payable<br />
1,<strong>07</strong>3,628.4 1,<strong>07</strong>3,628.4 1,051,700.3<br />
Measured at amortised cost<br />
Other liabilities<br />
106,981.1 106,981.1 106,981.1<br />
Designated at fair value through profit and loss 367.3 367.3 367.3<br />
Measured at amortised cost 136,881.5 136,881.5 136,881.5<br />
The following table shows a transition from the carrying values of financial instruments to the IAS 39 valuation categories:<br />
Fair value not through Fair value through Carrying value Carrying value<br />
All amounts in TEUR Amortised cost profit or loss profit or loss 30 April 20<strong>07</strong> 30 April 20<strong>07</strong><br />
ASSETS<br />
Held for trading<br />
Derivatives 2,004.4 2,004.4<br />
Financial instruments 300,000.0 300,000.0<br />
Designated at fair value through profit and loss<br />
Investments in other companies 192,834.0 192,834.0<br />
Available for sale<br />
Financial instruments 4,312.0 4,312.0<br />
Investments in other companies<br />
Loans and receivables<br />
91,123.8 91,123.8<br />
Trade accounts receivable 31,082.4 31,082.4<br />
Other receivables and assets 1,259,819.0 1,259,819.0<br />
Cash and cash equivalents 402,146.3 402,146.3<br />
Notes<br />
<strong>Report</strong> by the Executive Board 203<br />
Highlights <strong>2006</strong>/<strong>07</strong><br />
Business Model and Strategy<br />
Portfolio Structure<br />
Corporate Governance and Outlook<br />
Property Portfolio<br />
Development of Business<br />
Consolidated Financial Statements<br />
Service and Glossary<br />
IAS 39.9, IFRS<br />
7.B5 (a)<br />
IFRS 7.6<br />
IFRS 7.25<br />
IAS 7.8<br />
IFRS 7.25
204 <strong>IMMOEAST</strong> <strong>Annual</strong> <strong>Report</strong> <strong>2006</strong>/<strong>07</strong><br />
Fair value not through Fair value through Carrying value<br />
All amounts in TEUR Amortised cost profit or loss profit or loss 30 April 20<strong>07</strong><br />
EQUITY AND LIABILITIES<br />
Held for trading<br />
Derivatives 367.3 367.3<br />
Financial liabilities measured at amortised cost<br />
Trade accounts payable 106,981.1 106,981.1<br />
Amounts due to financial institutions 1,044,704.5 1,044,704.5<br />
Amounts due to local authorities 7.0 7.0<br />
Liability, limited partnership interest 10,440.0 10,440.0<br />
Other financial liabilities 18,477.0 18,477.0<br />
Other liabilities 136,881.5 136,881.5<br />
4.6 Receivables and other assets<br />
Thereof remaining<br />
Thereof remaining term between 1 Thereof remaining<br />
All amounts in TEUR 30 April 20<strong>07</strong> term under 1 year and 5 years term over 5 years 30 April <strong>2006</strong><br />
Trade accounts receivable<br />
Rents receivable 27,094.9 27,051.3 43.6 0.0 12,<strong>07</strong>8.4<br />
Miscellaneous 3,987.5 3,537.5 450.0 0.0 1,833.3<br />
Accounts receivable from joint venture partners 19,010.6 163.2 18,847.5 4,305.8<br />
Accounts receivable from subsidiaries 33,370.0 718.0 97.1 32,554.9 911.3<br />
Accounts receivable from subsidiaries,<br />
limited partnership contribution 3,194.0 3,194.0 0.0 0.0 3,194.0<br />
Accounts receivable from parent company<br />
(trust receivable) 993,142.2 993,142.2 0.0 0.0 412,534.1<br />
Other receivables and assets<br />
Financing 114,998.6 92,014.5 1.6 22,982.5 17,280.0<br />
Fiscal authorities (transaction taxes) 37,026.6 33,588.4 3,438.2 0.0 22,032.6<br />
Fiscal authorities (income taxes) 2,725.7 2,725.7 0.0 0.0 1,243.5<br />
Property management 4,997.4 4,898.5 17.5 81.5 1,481.7<br />
Accrued interest 922.7 922.7 0.0 0.0 176.2<br />
Insurance 296.1 296.1 0.0 0.0 137.2<br />
Administrative duties 14,371.1 14,371.1 0.0 0.0 6,296.0<br />
Commissions 1,186.8 453.2 379.7 354.0 910.2<br />
Lease incentives 3,371.4 1,447.0 1,679.7 244.8 687.7<br />
Miscellaneous 31,205.6 18,355.2 366.1 12,484.3 9,023.2<br />
Total 1,290,901.2 1,196,878.6 25,320.9 68,702.0 494,125.2<br />
Accounts receivable from subsidiaries as a result of limited partnership interests relate to I-E-H zweite Immoeast<br />
Holding GmbH, which holds 20% of the shares in AM-ImmoEast Central European Property Fund C.V. as the limited<br />
partner. The amount of TEUR 3,194.0 represents the part of the receivable that was not included in the consolidation<br />
of liabilities. The shares in AM-ImmoEast Central European Property Fund C.V. are puttable instruments as defined<br />
in IAS 32.18 (b) (see point 3.10.6).<br />
Miscellaneous other receivables and assets are comprised primarily of TEUR 10,664.4 in ancillary transaction costs<br />
incurred for the future acquisition of shares in property companies in Romania and Hungary as well as TEUR 12,280.4<br />
of loans granted to non-group companies in connection with project financing.<br />
The following table shows the age structure of trade accounts receivable:
Thereof not impaired and due within the following time periods<br />
Thereof neither<br />
impaired Between 3 Between 6 Over 12<br />
All amounts in TEUR 30 April 20<strong>07</strong> nor overdue Up to 3 months and 6 months and 12 months months<br />
Trade accounts receivable (rents) 27,094.9 14,578.9 7,440.1 2,974.2 1,250.6 851.0<br />
Trade accounts receivable (other) 3,987.5 3,266.5 420.0 139.4 91.3 70.4<br />
Total 31,082.4 17,845.5 7,860.1 3,113.6 1,341.9 921.4<br />
Thereof not impaired and due within the following time periods<br />
Thereof neither<br />
impaired Between 3 Between 6 Over 12<br />
All amounts in TEUR 30 April <strong>2006</strong> nor overdue Up to 3 months and 6 months and 12 months month<br />
Trade accounts receivable (rents) 12,<strong>07</strong>8.4 7,606.0 3,193.6 658.5 517.4 102.9<br />
Trade accounts receivable (other) 1,833.3 1,543.4 147.7 69.8 49.6 22.9<br />
Total 13,911.7 9,149.3 3,341.3 728.3 567.0 125.8<br />
The risk associated with trade accounts receivables due from tenants and customers is low because the credit standing<br />
of all tenants and customers is monitored on a regular basis and no tenant or customer is responsible for more<br />
than 5% of total receivables. In cases where receivables carry a risk of default, an impairment charge is recognised.<br />
With respect to the trade accounts receivable that were neither impaired nor overdue as of the balance sheet date,<br />
there are no signs that the debtors will be unable to meet their payment obligations.<br />
4.7 Current financial instruments<br />
Additional information on this balance sheet position is provided under point 3.10.3.<br />
Securities of TEUR 300,000.0 (2005/06: TEUR 101,966.0), which are recorded under current assets, have a remaining<br />
term of less than three months.<br />
4.8 Inventories<br />
Additional information on this balance sheet position is provided under point 3.8.<br />
Inventories totalled TEUR 81,694.3 as of 30 April 20<strong>07</strong> (2005/06: TEUR 18,375.5). All objects included under inventories<br />
represent properties under construction.<br />
The additions relate to the following objects:<br />
BG, Zarevo, Koral Bay BG, St. Vlas<br />
SRB, Belgrade, Francuska PL, Katowice, Silesia Residential<br />
PL, Katowice, Silesia Residential II PL, Katowice, Silesia Residential III<br />
PL, Katowice, Silesia Residential IV<br />
RO, Bucharest, Jandarmeriei Residential<br />
RO, Brasov, IUS Brasov<br />
Notes<br />
<strong>Report</strong> by the Executive Board 205<br />
Highlights <strong>2006</strong>/<strong>07</strong><br />
Business Model and Strategy<br />
Portfolio Structure<br />
Corporate Governance and Outlook<br />
Property Portfolio<br />
Development of Business<br />
Consolidated Financial Statements<br />
Service and Glossary
206 <strong>IMMOEAST</strong> <strong>Annual</strong> <strong>Report</strong> <strong>2006</strong>/<strong>07</strong><br />
IAS 1.124B<br />
IAS 12.81 (a)<br />
4.9 Shareholders’ equity<br />
The development of equity in the <strong>IMMOEAST</strong> Group is shown on the Statement of Changes in Equity, which forms an<br />
integral part of these consolidated financial statements.<br />
Management views capital as equity defined under IFRS, which excludes components of debt. <strong>IMMOEAST</strong> is not<br />
subject to any external regulations or supervisory regulations that require a minimum level of capital.<br />
The annual general meeting on 17 September 2004 approved an increase of EUR 88,941,240 in share capital from<br />
EUR 59,294,160 to EUR 148,235,400. A resolution passed by the annual general meeting on 6 June 2005 authorised<br />
the Executive Board to increase share capital in accordance with § 169 of the Austrian Stock Corporation<br />
Act. This authorisation is valid up to 22 June 2010 and covers an increase of up to EUR 74,117,700 to a total of<br />
EUR 222,353,100. A second segment of the capital increase was approved based on a resolution of the Executive<br />
Board from 22 June 2005 and the authorisation from 6 June 2005. In total, share capital was increased to<br />
EUR 222,353,100 through the issue of 163,058,940 shares.<br />
The annual general meeting on 20 March <strong>2006</strong> approved an increase in share capital by up to EUR 333,529,650 to<br />
EUR 555,882,750.<br />
The annual general meeting on 14 September <strong>2006</strong> authorised the Executive Board to increase share capital in<br />
accordance with § 169 of the Austrian Stock Corporation Act. This authorisation is valid up to 24 November 2011<br />
and covers an increase of up to EUR 277,941,375 to a total of EUR 833,824,125. This increase of EUR 277,941,375<br />
was approved and subsequently executed based on resolutions by the Executive Board on 30 April 20<strong>07</strong> and 21 May<br />
20<strong>07</strong>.<br />
The share capital of <strong>IMMOEAST</strong> totalled EUR 555,882,750 as of 30 April 20<strong>07</strong> (2005/06: EUR 222,353,100) and is<br />
divided into 555,882,750 (2004/05: 222,353,100) zero value shares.<br />
The classification of shares as of 30 April 20<strong>07</strong> is as follows:<br />
Number of shares Share capital EUR Number of shares Share capital EUR<br />
30 April 20<strong>07</strong> 30 April 20<strong>07</strong> 30 April <strong>2006</strong> 30 April <strong>2006</strong><br />
Registered shares 2 2 2 2<br />
Bearer shares 555,882,748 555,882,748 222,353,098 222,353,098<br />
Total 555,882,750 555,882,750 222,353,100 222,353,100<br />
The share premium in the individual financial statements prepared in accordance with Austrian commercial law<br />
includes appropriated reserves of TEUR 3,613,706.0 (2005/06: TEUR 1,195,616.0) from capital increases made in<br />
accordance with § 229 (2) 1 of the Austrian Commercial Code in conjunction with § 130 (2) of the Austrian Stock<br />
Corporation Act.<br />
The capital increase carried out in <strong>2006</strong>/<strong>07</strong> generated a premium of TEUR 2,418,090.0 (2005/06: TEUR 962,047.7),<br />
which was credited to the share premium account. Issue costs of TEUR 69,620.5 (2005/06: TEUR 29,047.5) were<br />
charged to the share premium account after the deduction of taxes totalling TEUR 23,206.8.
4.10 Financial liabilities<br />
Additional information on this balance sheet position is provided under point 3.10.5.<br />
Thereof remaining<br />
Thereof remaining term between Thereof remaining<br />
All amounts in TEUR 30 April 20<strong>07</strong> term under 1 year 1 and 5 years term over 5 years 30 April <strong>2006</strong><br />
Amounts due to financial institutions 1,044,704.5 90,276.6 508,976.9 445,450.9 691,427.9<br />
Thereof guaranteed 0.0 0.0 0.0 0.0 0.0<br />
Thereof secured by collateral 1,023,858.3 90,047.7 488,359.6 445,450.9 690,559.8<br />
Thereof not secured by collateral 20,846.2 228.9 20,617.3 0.0 868.1<br />
Financial liabilities, limited partnership interest 10,440.0 10,440.0 0.0 0.0 10,440.0<br />
Other financial liabilities 18,483.9 15,422.8 1,781.0 1,280.2 429.4<br />
Total 1,<strong>07</strong>3,628.4 116,139.4 510,757.9 446,731.1 702,297.3<br />
The financial liabilities of TEUR 10,440.0 arising from limited partnership interests were included in the consolidated<br />
financial statements through the limited partner investment in I-E-H Holding GmbH, as the limited partner, and<br />
AM-ImmoEast Asset Management GmbH, as general partner and manager of AM-ImmoEast Central European Property<br />
Fund C.V., and do not affect the unconsolidated partnership capital of the remaining shareholders of AM-ImmoEast<br />
Central European Property Fund C.V. The shares in AM-ImmoEast Central European Property Fund C.V. represent puttable<br />
instruments as defined in IAS 32.18 (b) (see point 3.10.6).<br />
The key conditions of financial liabilities are as follows:<br />
Nominal value/ Remaining<br />
original credit liability as of<br />
amount in 30. April 20<strong>07</strong> Interest rate<br />
Bank Company Currency in 1,000 *) in 1,000 *) fixed/variable<br />
Segment: CEE<br />
Country: Czech Republic<br />
Weighted average interest rate: 5.17%<br />
Aareal Bank AG Airport Property Development a.s. EUR 12,100.0 10,870.2 variable<br />
Aareal Bank AG Airport Property Development a.s. EUR 760.0 636.3 variable<br />
Aareal Bank AG Airport Property Development a.s. EUR 460.0 211.8 variable<br />
Bank Austria Creditanstalt AG PERL INVEST a.s. EUR 2,699.5 2,532.1 variable<br />
Bank Austria Creditanstalt AG PERL INVEST a.s. EUR 2,643.9 306.0 fixed<br />
Bank Austria Creditanstalt AG NP Investment a.s. EUR 13,911.5 13,181.2 variable<br />
Bank Austria Creditanstalt AG NP Investment a.s. EUR 13,420.1 1,591.5 fixed<br />
Bank Austria Creditanstalt AG Prokopova Development a.s. EUR 431.9 405.9 variable<br />
Bank Austria Creditanstalt AG Prokopova Development a.s. EUR 468.1 49.0 fixed<br />
Bank Austria Creditanstalt AG E.N.G. Property a.s. EUR 2,249.6 2,109.7 variable<br />
Bank Austria Creditanstalt AG E.N.G. Property a.s. EUR 2,212.2 255.0 fixed<br />
Bank Austria Creditanstalt AG JUNGMANNOVA ESTATES a.s. EUR 5,665.8 673.0 fixed<br />
Bank Austria Creditanstalt AG JUNGMANNOVA ESTATES a.s. EUR 5,849.0 5,562.0 variable<br />
Bank Austria Creditanstalt AG J.H. Prague a.s. EUR 5,061.4 604.0 fixed<br />
Bank Austria Creditanstalt AG J.H. Prague a.s. EUR 5,219.1 4,894.2 variable<br />
Bank Austria Creditanstalt AG PAN Development a.s. EUR 3,161.9 369.9 fixed<br />
Bank Austria Creditanstalt AG PAN Development a.s. EUR 3,239.4 3,039.4 variable<br />
Bank Austria Creditanstalt AG RHP Development spol.s.r.o. EUR 11,750.0 11,749.7 variable<br />
Bank Austria Creditanstalt AG Diamant Real s.r.o. EUR 7,631.7 7,631.7 variable<br />
Bank Austria Creditanstalt AG Diamant Real s.r.o. EUR 1,530.0 1,530.0 variable<br />
Bank Austria Creditanstalt AG Diamant Real s.r.o. EUR 2,805.3 2,805.3 variable<br />
Bank Austria Creditanstalt AG Diamant Real s.r.o. EUR 538.5 538.5 variable<br />
Bank Austria Creditanstalt AG Diamant Real s.r.o. EUR 5,446.8 5,446.8 variable<br />
Erste Bank der oesterreichischen Sparkassen AG Akvamarin Beta s.r.o. EUR 13,680.0 12,741.4 variable<br />
Notes<br />
<strong>Report</strong> by the Executive Board 2<strong>07</strong><br />
Highlights <strong>2006</strong>/<strong>07</strong><br />
Business Model and Strategy<br />
Portfolio Structure<br />
Corporate Governance and Outlook<br />
Property Portfolio<br />
Development of Business<br />
Consolidated Financial Statements<br />
Service and Glossary
208 <strong>IMMOEAST</strong> <strong>Annual</strong> <strong>Report</strong> <strong>2006</strong>/<strong>07</strong><br />
Nominal value/ Remaining<br />
original credit liability as of<br />
amount in 30. April 20<strong>07</strong> Interest rate<br />
Bank Company Currency in 1,000 *) in 1,000 *) fixed/variable<br />
Erste Bank der oesterreichischen Sparkassen AG Aragonit s.r.o. EUR 6,000.0 5,258.7 variable<br />
HVB Bank Czech Republic a.s. Prague Office Park I s.r.o. CHF 2,400.0 1,521.9 fixed<br />
HVB Bank Czech Republic a.s. Prague Office Park I s.r.o. CHF 5,580.0 4,284.1 fixed<br />
HVB Bank Czech Republic a.s. Prague Office Park I s.r.o. CHF 1,995.0 1,856.6 fixed<br />
HVB Bank Czech Republic a.s. Atom Centrum a.s. EUR 15,120.0 14,281.6 variable<br />
HVB Bank Czech Republic a.s. Centrum Olympia Olomuc a.s. EUR 19,408.3 16,358.1 variable<br />
HVB Bank Czech Republic a.s. SB Praha 4 spol.s.r.o. EUR 1,489.9 1,422.3 variable<br />
HVB Bank Czech Republic a.s. SB Praha 4 spol.s.r.o. EUR 1,733.3 976.8 variable<br />
HVB Bank Czech Republic a.s. SB Praha 4 spol.s.r.o. EUR 7,792.1 2,915.2 variable<br />
HVB Bank Czech Republic a.s. BB C - Building A, k.s. EUR 2,482.4 2,482.4 variable<br />
HVB Bank Czech Republic a.s. BB C - Building A, k.s. EUR 1,412.7 1,282.1 variable<br />
HVB Bank Czech Republic a.s. BB C - Building A, k.s. EUR 25,625.0 25,625.0 variable<br />
HVB Bank Czech Republic a.s. BB C - Building B, k.s. EUR 2,593.2 2,593.2 variable<br />
HVB Bank Czech Republic a.s. BB C - Building B, k.s. EUR 17,664.6 17,664.6 variable<br />
HVB Bank Czech Republic a.s. BB C - Building C, k.s. EUR 2,096.4 2,096.4 variable<br />
HVB Bank Czech Republic a.s. BB C - Building C, k.s. EUR 13,792.0 13,792.0 variable<br />
HVB Bank Czech Republic a.s. Centre Investments s.r.o. EUR 200.0 182.7 fixed<br />
HVB Bank Czech Republic a.s. Centre Investments s.r.o. EUR 600.0 482.8 fixed<br />
HVB Bank Czech Republic a.s. Centre Investments s.r.o. EUR 1,998.0 1,537.0 fixed<br />
HVB Bank Czech Republic a.s. Centre Investments s.r.o. EUR 1,871.0 1,411.3 fixed<br />
HVB Bank Czech Republic a.s. ATLAS 2001 CR s.r.o. EUR 10,006.0 9,046.7 variable<br />
HVB Bank Czech Republic a.s. ATLAS 2001 CR s.r.o. EUR 6,908.9 6,246.5 variable<br />
HVB Bank Czech Republic a.s. ATLAS 2001 CR s.r.o. EUR 2,335.1 2,111.2 variable<br />
Investkredit Bank AG WEGE spol.s.r.o. CHF 1,500.3 1,236.0 variable<br />
Investkredit Bank AG ODP Office Development Praha spol.s.r.o. CHF 3,000.6 2,472.0 variable<br />
Investkredit Bank AG MY BOX Uherske Hradiste s.r.o. CZK 3,105.1 3,105.1 variable<br />
Investkredit Bank AG MY BOX Uherske Hradiste s.r.o. CZK 13,956.7 6.4 variable<br />
Investkredit Bank AG MY BOX Uherske Hradiste s.r.o. EUR 1,904.4 7.4 variable<br />
Investkredit Bank AG WEGE spol.s.r.o. EUR 936.5 755.5 variable<br />
Investkredit Bank AG ODP Office Development Praha spol.s.r.o. EUR 2,<strong>07</strong>1.7 1,673.4 variable<br />
Investkredit Bank AG SBF Development Praha spol.s.r.o. EUR 4,500.0 4,290.5 variable<br />
Investkredit Bank AG SBF Development Praha spol.s.r.o. EUR 17,300.0 16,958.7 variable<br />
Investkredit Bank AG MY BOX Hranice s.r.o. EUR 2,092.0 8.8 variable<br />
Investkredit Bank AG Brno Estates a.s. EUR 15,900.0 15,900.0 variable<br />
Oberbank AG VALDEK Praha spol.s.r.o. CHF 3,000.0 2,106.8 variable<br />
Oberbank AG ABLO Property s.r.o. EUR 24,000.0 22,800.0 variable<br />
Oberbank AG VALDEK Praha spol.s.r.o. EUR 113.7 78.5 variable<br />
Oberbank AG VALDEK Praha spol.s.r.o. EUR 2,383.3 2,158.2 variable<br />
Oberbank AG VALDEK Praha spol.s.r.o. EUR 6,879.8 3,300.8 variable<br />
Oberbank AG NF 23 spol.s.r.o. EUR 1,205.8 1,027.9 variable<br />
Raiffeisen Zentralbank Österreich AG Delta Park a.s. EUR 15,500.0 13,750.0 variable<br />
Segment: CEE<br />
Country: Hungary<br />
Weighted average interest rate: 5.27%<br />
Bank Austria Creditanstalt AG Arpad Center Kft. EUR 6,500.0 5,348.0 variable<br />
Bank Austria Creditanstalt AG Globe 13 Kft. EUR 21,000.0 17,220.0 variable<br />
Bank Austria Creditanstalt AG Lentia Real (1) Kft. EUR 10,800.0 8,936.0 variable<br />
Bank Austria Creditanstalt AG Szepvölgyi Business Park Kft. EUR 10,500.0 9,600.0 variable<br />
Erste Bank der oesterreichischen Sparkassen AG Globe 3 Ingatlanfejlesztö Kft. CHF 5,880.3 5,117.0 variable<br />
Erste Bank der oesterreichischen Sparkassen AG C.E.P.D. Kft. EUR 26,750.0 24,292.5 variable
<strong>Report</strong> by the Executive Board<br />
Highlights <strong>2006</strong>/<strong>07</strong><br />
Business Model and Strategy<br />
Portfolio Structure<br />
209<br />
Corporate Governance and Outlook<br />
Property Portfolio<br />
Development of Business<br />
Consolidated Financial Statements<br />
Service and Glossary<br />
Nominal value/ Remaining<br />
original credit liability as of<br />
amount in 30. April 20<strong>07</strong> Interest rate<br />
Bank Company Currency in 1,000 *) in 1,000 *) Notes<br />
fixed/variable<br />
Erste Bank der oesterreichischen Sparkassen AG DH Logistik Kft. EUR 4,400.0 4,013.5 variable<br />
Erste Bank der oesterreichischen Sparkassen AG West Gate Üzleti Park Fejlesztö Kft. EUR 3,642.7 1,988.1 variable<br />
Erste Bank der oesterreichischen Sparkassen AG West Gate Üzleti Park Fejlesztö Kft. EUR 12,<strong>07</strong>5.3 8,964.4 variable<br />
Erste Bank der oesterreichischen Sparkassen AG West Gate Üzleti Park Fejlesztö Kft. EUR 13,736.5 440.4 variable<br />
Erste Bank der oesterreichischen Sparkassen AG Globe 3 Ingatlanfejlesztö Kft. EUR 6,540.6 669.6 variable<br />
HVB Hungary Rt. SAS Inter Kft. EUR 9,056.0 8,176.7 variable<br />
HVB Hungary Rt. SAS Inter Kft. EUR 200.0 115.1 variable<br />
HVB Hungary Rt. SAS Inter Kft. EUR 500.0 303.4 variable<br />
HVB Hungary Rt. Euro Businesspark Kft. EUR 15,880.0 14,011.9 variable<br />
HVB Hungary Rt. Euro Businesspark Kft. EUR 800.0 800.0 variable<br />
HVB Hungary Rt. Euro Businesspark Kft. EUR 13,154.3 13,154.3 variable<br />
Raiffeisen Zentralbank Österreich AG Mester Park Kft. EUR 12,990.0 8,134.0 variable<br />
Raiffeisenlandesbank Oberösterreich AG Center Invest Kft. EUR 8,900.0 7,874.9 variable<br />
Raiffeisenlandesbank Oberösterreich AG Center Invest Kft. EUR 12,900.0 10,800.4 variable<br />
Raiffeisenlandesbank Oberösterreich AG Center Invest Kft. EUR 7,281.8 6,<strong>07</strong>2.4 variable<br />
Raiffeisenlandesbank Oberösterreich AG Center Invest Kft. EUR 13,910.0 12,828.4 variable<br />
Raiffeisenlandesbank Oberösterreich AG Center Invest Kft. EUR 13,650.6 12,698.1 variable<br />
Raiffeisenlandesbank Oberösterreich AG Center Invest Kft. EUR 6,400.0 5,965.8 variable<br />
Segment: CEE<br />
Country: Poland<br />
Weighted average interest rate: 5.75%<br />
Aareal Bank AG Nowe Centrum Sp. z o.o. EUR 101,000.0 85,1<strong>07</strong>.0 variable<br />
Aareal Bank AG MBP I Sp. z o.o. EUR 74,212.5 70,830.8 variable<br />
Bank Austria Creditanstalt AG Blizzard Real Sp. z o.o. EUR 25,217.5 18,538.0 variable<br />
Bank Austria Creditanstalt AG Passat Real Sp. z o.o. EUR 15,100.0 12,480.3 variable<br />
Bank Zachodni WBK S.A. Silesia Residential Project Sp. z o.o. PLN 40,363.6 8,613.0 variable<br />
Bank Zachodni WBK S.A. Silesia Residential Project Sp. z o.o. PLN 4,200.0 1,<strong>07</strong>5.7 variable<br />
Bank Zachodni WBK S.A. Debowe Tarasy Sp. z o.o. II sp.k. PLN 43,400.0 2,777.7 variable<br />
Bank Zachodni WBK S.A. Debowe Tarasy Sp. z o.o. II sp.k. PLN 6,300.0 77.3 variable<br />
Erste Bank der oesterreichischen Sparkassen AG Atlantis Invest Sp. z o.o. USD 805.1 731.9 variable<br />
Erste Bank der oesterreichischen Sparkassen AG Omega Invest Sp. z o.o. USD 15,284.1 12,309.4 variable<br />
Erste Bank der oesterreichischen Sparkassen AG ARE 4 Sp. z o.o. EUR 10,400.0 9,148.3 variable<br />
Erste Bank der oesterreichischen Sparkassen AG Central Bud Sp. z o. o. EUR 9,800.0 8,861.4 variable<br />
Erste Bank der oesterreichischen Sparkassen AG Al Sp. z o.o. EUR 12,950.0 1,491.2 variable<br />
Erste Bank der oesterreichischen Sparkassen AG Atlantis Invest Sp. z o.o. EUR 12,950.0 8,689.3 variable<br />
Erste Bank der oesterreichischen Sparkassen AG Ol Sp. z o.o. EUR 6,739.0 5,645.6 variable<br />
Erste Bank der oesterreichischen Sparkassen AG Omega Invest Sp. z o.o. EUR 3,712.9 2,987.7 variable<br />
Erste Bank der oesterreichischen Sparkassen AG ARE 5 Sp. z o.o. EUR 12,700.0 3,132.6 variable<br />
Erste Bank der oesterreichischen Sparkassen AG Secure Bud Sp. z o.o. EUR 12,700.0 8,505.0 variable<br />
Erste Bank der oesterreichischen Sparkassen AG ARE 8 Sp. z o.o. EUR 7,200.0 6,929.8 variable<br />
Erste Bank der oesterreichischen Sparkassen AG ARE 8 Sp. z o.o. EUR 450.0 450.0 variable<br />
Erste Bank der oesterreichischen Sparkassen AG Equator Real Sp. z o.o. EUR 15,402.0 2,880.8 variable<br />
Erste Bank der oesterreichischen Sparkassen AG Zenith Real Sp. z o.o. EUR 1,275.0 718.9 variable<br />
Erste Bank der oesterreichischen Sparkassen AG Nimbus Real Sp. z o.o. EUR 1,004.5 681.5 variable<br />
Erste Bank der oesterreichischen Sparkassen AG Cirrus Real Sp. z o.o. EUR 1,198.5 684.8 variable<br />
Erste Bank der oesterreichischen Sparkassen AG Immofinanz Polska Sp. z o.o. EUR 9,000.0 7,965.0 variable<br />
Investkredit Bank AG Flex Invest Sp. z o.o. USD 18,388.5 17,728.6 variable<br />
Investkredit Bank AG Flex Invest Sp. z o.o. EUR 1,600.0 1,600.0 variable<br />
Investkredit Bank AG Flex Invest Sp. z o.o. EUR 4,894.5 4,733.2 variable
210 <strong>IMMOEAST</strong> <strong>Annual</strong> <strong>Report</strong> <strong>2006</strong>/<strong>07</strong><br />
Nominal value/ Remaining<br />
original credit liability as of<br />
amount in 30. April 20<strong>07</strong> Interest rate<br />
Bank Company Currency in 1,000 *) in 1,000 *) fixed/variable<br />
Segment: CEE<br />
Country: Slovakia<br />
Weighted average interest rate: 5.28%<br />
MKB Bank Lt. <strong>IMMOEAST</strong> Projekt Jota Holding GmbH EUR 52,000.0 52,000.0 variable<br />
MKB Bank Lt. Polus a.s. EUR 61,000.0 61,000.0 variable<br />
Slovenska sporitelna a.s. Polus Tower 2 a.s. EUR 36,000.0 34,554.6 variable<br />
UniBanka a.s. SCT s.r.o. EUR 4,400.0 4,325.2 variable<br />
Segment: SEE<br />
Country: Romania<br />
Weighted average interest rate: 5.86%<br />
Alpha Bank S.C. Valero Invest s.r.l. RON 3,593.0 3,593.0 variable<br />
Bank Austria Creditanstalt AG S.C. Almera New Capital s.r.l. EUR 618.0 618.0 variable<br />
Bank Austria Creditanstalt AG S.C. Almera New Capital s.r.l. EUR 350.0 350.0 variable<br />
Bank Austria Creditanstalt AG S.C. Almera New Capital s.r.l. EUR 317.1 317.1 variable<br />
Bank Austria Creditanstalt AG S.C. Almera New Capital s.r.l. EUR 1,500.0 181.1 variable<br />
EFG Private Bank SA S.C. Meteo Business Park s.r.l. EUR 2,136.0 2,136.0 variable<br />
EFG Private Bank SA S.C. Meteo Business Park s.r.l. EUR 2,447.5 2,447.5 variable<br />
EFG Private Bank SA S.C. Stupul de Albine s.r.l. EUR 1,468.5 1,468.5 variable<br />
EFG Private Bank SA S.C. Stupul de Albine s.r.l. EUR 2,447.5 2,447.5 variable<br />
Erste Bank der oesterreichischen Sparkassen AG SC EFG Urban Achizitii s.r.l. EUR 20,000.0 20,000.0 variable<br />
Erste Bank der oesterreichischen Sparkassen AG S.C. Baneasa 6981 s.r.l. EUR 6,250.0 6,129.3 variable<br />
Erste Bank der oesterreichischen Sparkassen AG S.C. Baneasa 6981 s.r.l. EUR 2,000.0 1,243.1 variable<br />
Erste Bank der oesterreichischen Sparkassen AG S.C. Baneasa 6981 s.r.l. EUR 10,600.0 3,777.8 variable<br />
European bank for reconstruction and development IRIDE S.A. EUR 17,955.9 15,956.9 variable<br />
European bank for reconstruction and development IRIDE S.A. EUR 22,500.0 21,019.4 variable<br />
European bank for reconstruction and development IRIDE S.A. EUR 14,0<strong>07</strong>.1 8,188.7 variable<br />
Hypo Real Estate Bank International AG Cora GS s.r.l. EUR 19,670.0 19,670.0 variable<br />
*) reflects stake owned<br />
The present value of the loans listed in the above table totals EUR 1,022.8 million. The present value calculation was<br />
based on the following discount rates, which reflect market interest rates as of 30 April 20<strong>07</strong> as well as the weighted<br />
average margins of the loans held by <strong>IMMOEAST</strong> Group companies in the relevant local currencies as of the balance<br />
sheet date.<br />
Discount rates in % RON PLN CZK CHF EUR USD<br />
Up to 30 7.20<strong>07</strong> 3.521% 5.983% 4.285% 4.004% 5.600% 6.914%<br />
Up to 30 4.2008 4.249% 6.303% 4.480% 4.175% 5.892% 6.853%<br />
Up to 30 4.2010 4.475% 6.402% 4.541% 4.228% 5.983% 6.561%<br />
Up to 30 4.2012 4.501% 6.414% 4.547% 4.234% 5.993% 6.599%<br />
Up to 30 4.2014 4.553% 6.437% 4.561% 4.246% 6.014% 6.673%<br />
Up to 30 4.2017 4.709% 6.505% 4.603% 4.283% 6.<strong>07</strong>7% 6.778%<br />
Up to 30 4.2022 4.942% 6.608% 4.666% 4.338% 6.170% 6.883%<br />
As of 1.5.2022 5.046% 6.654% 4.694% 4.362% 6.212% 6.930%
4.11 Trade accounts payable<br />
Thereof remaining<br />
Thereof remaining term between Thereof remaining<br />
All amounts in TEUR 30 April 20<strong>07</strong> term under 1 year 1 and 5 years term over 5 years 30 April <strong>2006</strong><br />
Trade accounts payable 106,981.1 105,086.3 1,736.5 158.3 48,693.4<br />
Total 106,981.1 105,086.3 1,736.5 158.3 48,693.4<br />
4.12 Provisions<br />
Additional information on this balance sheet position is provided under point 3.14.<br />
Other provisions were created primarily for taxes as well as auditing, consulting and expert opinion costs. These<br />
items developed as follows during the reporting year:<br />
Other provisions<br />
All amounts in TEUR <strong>2006</strong>/<strong>07</strong> 2005/06<br />
Balance on 1 May 11,206.6 2,190.4<br />
Use -7,986.3 -1,562.6<br />
Reversal -853.6 -1,095.1<br />
Addition 8,990.1 8,980.8<br />
Currency translation adjustments 286.1 310.1<br />
Change in consolidation method 1,877.6 66.6<br />
Change in consolidation range 630.0 2,316.4<br />
Balance on 30 April 14,150.5 11,206.6<br />
Thereof current 12,255.7 9,609.1<br />
Other provisions include TEUR 3,217.7 (2005/6: TEUR 3,121.3) of provisions for taxes.<br />
4.13 Other liabilities<br />
Additional information on this balance sheet position is provided under point 3.14.<br />
Thereof remaining<br />
Thereof remaining term between Thereof remaining<br />
All amounts in TEUR 30 April 20<strong>07</strong> term under 1 year 1 and 5 years term over 5 years 30 April <strong>2006</strong><br />
Amounts due to subsidiaries 4,648.8 0.0 0.0 4,648.8 4,528.7<br />
Amounts due to joint ventures 27,303.5 2,345.7 970.7 23,987.0 2,696.9<br />
Outstanding purchase prices (share deals) 38,965.6 37,399.8 1,565.8 0.0 31,332.7<br />
Rental and lease prepayments 29,285.6 20,975.6 4,605.8 3,704.3 13,166.4<br />
Taxation authorities (transaction taxes) 4,<strong>07</strong>9.3 4,<strong>07</strong>9.3 0.0 0.0 2,184.6<br />
Taxation authorities (income taxes) 944.1 944.1 0.0 0.0 152.0<br />
Property management 1,166.7 1,134.9 31.7 0.0 1,702.4<br />
Construction and refurbishment 110.5 110.5 0.0 0.0 206.1<br />
Miscellaneous 30,744.8 18,330.6 3,013.1 9,401.2 20,386.0<br />
Total 137,248.8 85,320.5 10,187.1 41,741.3 76,355.7<br />
Miscellaneous liabilities include TEUR 1,127.9 of liabilities owned by a fully consolidated company to a minority<br />
shareholder as well as TEUR 367.3 of derivative financial instruments. In addition, accrued interest expense on loans<br />
is also included under this item.<br />
Notes<br />
<strong>Report</strong> by the Executive Board 211<br />
Highlights <strong>2006</strong>/<strong>07</strong><br />
Business Model and Strategy<br />
Portfolio Structure<br />
Corporate Governance and Outlook<br />
Property Portfolio<br />
Development of Business<br />
Consolidated Financial Statements<br />
Service and Glossary<br />
IAS 37.84
212 <strong>IMMOEAST</strong> <strong>Annual</strong> <strong>Report</strong> <strong>2006</strong>/<strong>07</strong><br />
IAS 12.81 (g),<br />
IAS 12.82<br />
4.14 Contingent liabilities and guarantees<br />
Additional information on this balance sheet position is provided under point 3.15.<br />
Contingent liabilities are valued in accordance with IAS 37 and IFRS 3.48 (see 3.12). The Group had no outstanding<br />
guarantees as of the balance sheet date.<br />
4.15 Deferred taxes<br />
Additional information on this balance sheet position is provided under point 3.13.<br />
Through an agreement dated 29 April 2005, the major Austrian companies have joined together in a group as defined<br />
in § 9 of the Austrian Corporate Tax Act as set forth in the Austrian Tax Act. The parent company, <strong>IMMOEAST</strong>, serves<br />
as the head of the group. Taxable income earned by the individual members of the group is allocated to the head of<br />
the group after an offset against any (individual company) losses. A tax charge is included in the group contract as<br />
settlement for the transfer of taxable income.<br />
Deferred tax assets and deferred tax liabilities as of 30 April 20<strong>07</strong> and 30 April <strong>2006</strong> are the result of the following<br />
timing differences in valuation or accounting treatment between the carrying values in the consolidated financial<br />
statements under IFRS and the related tax bases. Furthermore, deferred tax assets were created for tax loss carryforwards<br />
in cases where it is probable that sufficient taxable income will be available to utilise these tax loss carryforwards<br />
in the future.<br />
30 April 20<strong>07</strong> 30 April <strong>2006</strong><br />
All amounts in TEUR Assets Liabilities Assets Liabilities<br />
Property 13,761.9 444,419.8 5,105.4 170,880.4<br />
Other financial assets and miscellaneous assets 5,709.6 11,457.8 4,142.5 6,541.7<br />
Total 19,471.5 455,877.6 9,247.9 177,422.1<br />
Other liabilities and provisions 1,961.0 1,803.0 1,128.2 1,158.4<br />
Financial liabilities 1,018.4 15,418.5 755.2 8,366.2<br />
Total 2,979.4 17,221.5 1,883.4 9,524.6<br />
Tax loss carryforwards 38,638.1 0.0 11,911.2 0.0<br />
Net sum of deferred tax assets and deferred tax liabilities 61,089.0 473,099.1 23,042.5 186,946.7<br />
The tax rates in the individual countries are listed below:<br />
Country Applicable tax rate<br />
Austria 25.00%<br />
Bosnia and Herzegovina 10.00% *)<br />
Bulgaria 10.00%<br />
Croatia 20.00%<br />
Cyprus 10.00%<br />
Czech Republic 24.00%<br />
Estonia 28.21% **)<br />
Germany 26.38%-40.86% ***)<br />
Hungary 16.00%<br />
Luxembourg 29.63%<br />
Malta 35.00%<br />
Netherlands 25.50%<br />
Country Applicable tax rate<br />
Poland 19.00%<br />
Romania 16.00%<br />
Russia 24.00%<br />
Serbia 10.00%<br />
Slovakia 19.00%<br />
Slovenia 25.00%<br />
Sweden 28.00%<br />
Ukraine 25.00%<br />
*) Republika Srpska **) Applies only to distributions, retained earnings are not taxed<br />
***) The tax rate in Germany can vary, depending on whether the company is subject to trade tax
The corporate income tax rate in Bulgaria was reduced from 15% to 10% as of 1 January 20<strong>07</strong> following a change in<br />
the relevant law.<br />
In Estonia, corporate profits are only taxed if they are distributed. Retained earnings are not taxed. A change in the<br />
corporate income tax act during June 2005 will lead to a gradual reduction of 1% per year in the Estonian corporate<br />
tax rate by 2009 and result in the following tax rates:<br />
20<strong>07</strong>: 22/78 = 28.21%<br />
2008: 21/79 = 26.58%<br />
2009: 20/80 = 25%<br />
In the Netherlands an amendment to the corporate income tax act took effect on 1 January 20<strong>07</strong> and reduced the<br />
corporate income tax rate to 25.5%.<br />
A tax reform was approved in the Czech Republic, which will lower the corporate income tax rate from 24% to 22% in<br />
2008, 20% in 2009 and 19% in 2010.<br />
5. Notes to the Income Statement<br />
5.1 Revenues<br />
Additional information on this balance sheet position is provided under point 3.16.<br />
Detailed information on revenues is presented by region (primary segmentation) and sector (secondary segmentation)<br />
under segment reporting, which forms an integral part of these consolidated financial statements.<br />
In accordance with IFRS 8, the management approach must be used to define the segments of business. The key<br />
element of this approach is the identification of operating segments based on internal management processes.<br />
The classification of rental income by sector is shown in the following table:<br />
All amounts in TEUR <strong>2006</strong>/<strong>07</strong> % 2005/06 %<br />
Offices 74,054.4 50.67% 35,122.1 59.20%<br />
Logistics/commercial 68,544.1 46.90% 22,765.3 38.37%<br />
Residential 55.4 0.04% 55.2 0.09%<br />
Car parks and parking spaces 3,497.3 2.39% 1,381.0 2.33%<br />
Rental income 146,151.2 100.00% 59,323.6 100.00%<br />
Sale of inventories 818.2 277.0<br />
Operating costs charged on to tenants 40,830.1 18,596.5<br />
Other revenues 5,120.9 1,817.4<br />
Total 192,920.4 80,014.5<br />
Notes<br />
<strong>Report</strong> by the Executive Board 213<br />
Highlights <strong>2006</strong>/<strong>07</strong><br />
Business Model and Strategy<br />
Portfolio Structure<br />
Corporate Governance and Outlook<br />
Property Portfolio<br />
Development of Business<br />
Consolidated Financial Statements<br />
Service and Glossary
214 <strong>IMMOEAST</strong> <strong>Annual</strong> <strong>Report</strong> <strong>2006</strong>/<strong>07</strong><br />
5.2 Revaluation<br />
Additional information on this balance sheet position is provided under point 3.14.<br />
The revaluation of investment properties is based primarily on the principles described in point 3.4.<br />
All amounts in TEUR <strong>2006</strong>/<strong>07</strong> 2005/06<br />
Revaluation 567,003.6 133,463.8<br />
Impairment charges -73,908.5 -16,477.7<br />
Total 493,095.1 116,986.1<br />
Impairment charges were recognised to the following properties during <strong>2006</strong>/<strong>07</strong>:<br />
All amounts in TEUR<br />
Object Country Segment Impairment charge<br />
BBC Centrum Building B CZ CEE -10,202.58<br />
Jungmannova CZ CEE -2,983.23<br />
Valdek Jugoslavka 29 CZ CEE -1,040.78<br />
Prague Office Park CZ CEE -580.20<br />
Anglicka CZ CEE -577.03<br />
Prokopova CZ CEE -568.67<br />
ARBES Stafnikova 32+34 CZ CEE -562.63<br />
Impairment charges – Czech Republic -16,515.12<br />
Dunaharaszti H CEE -5,533.81<br />
Arpad Center H CEE -5,447.73<br />
Budapest, Green Point 7 H CEE -4,402.94<br />
Globe 3 H CEE -3,046.98<br />
Camel Park (Euro Business Park) H CEE -1,469.69<br />
Central Business Centre H CEE -905.38<br />
Shark Park H CEE -577.42<br />
Budapest Pharma Park H CEE -283.55<br />
Szepvölgyi Business Park H CEE -191.52<br />
Impairment charges – Hungary -21,859.02<br />
Crown Tower PL CEE -8,411.90<br />
Cybernetyki Office Center PL CEE -6,702.06<br />
Crown Point PL CEE -5,492.94<br />
Bokserska Office Center PL CEE -4,276.28<br />
Bokserska Distribution Park PL CEE -2,616.98<br />
Lopuszanska PL CEE -1,530.14<br />
Silesia Logistik Center (ARE 8) PL CEE -1,453.48<br />
MBP Vega (Land ) PL CEE -981.82<br />
“real”- Markt Wloclawek PL CEE -680.75<br />
Impairment charges – Poland -32,146.37<br />
Millenium Tower I SK CEE -3,3<strong>07</strong>.52<br />
Impairment charges – Slovakia -3,3<strong>07</strong>.52<br />
Global Business Center RO SEE -80.47<br />
Impairment charges – Romania -80.47<br />
Total impairment charges -73,908.50
The impairment charges to the following properties resulted solely from an increase in the value of the local currency<br />
against the Euro. The Euro fair values of these objects as of 30 April 20<strong>07</strong> exceed the Euro fair values as of 30 April<br />
<strong>2006</strong> at these exchange rates, and an impairment charge was required because the carrying value exceeded the fair<br />
value that resulted from the translation from local currency into the Group currency:<br />
• Global Business Center • Szepvölgi Business Park<br />
• Pharma Park • Camel Park<br />
• Shark Park • Millenium Tower I<br />
An impairment charge was recognised for the Arpad Centre because of the high vacancy rate, which exceeds 50% of<br />
the available office space. In addition, the valuation return was raised to better reflect the increased rental risk.<br />
The loss of the tenant for the Dunaharaszti logistics hall was reflected in an appropriate impairment charge. The<br />
discount factor was also increased to adequately reflect the risk associated with a new rental.<br />
An impairment charge was recognised for the Globe 3 office property due to the vacancy rate, which equals roughly<br />
20% of the available space. The rental risk was reflected through an increase in the valuation return.<br />
The property valuation experts have classified the following objects as “over-rented”, which means the market rents<br />
realisable after the end of the current contracts will be less than the rents currently paid by tenants:<br />
• Bokserska Distribution Park • Bokserska Office Center<br />
• Crown Point • Crown Tower<br />
• Cybernetiki Office Center • Lopuszanska<br />
• Green Point 7 • Silesia Logistik Center<br />
The other impairment charges were generally based on an increase in foreign exchange rates against the Euro as well<br />
as investments that did not lead to an increase in the value of the objects.<br />
In <strong>2006</strong>/<strong>07</strong> revaluations were recognised for the following sites, which are recognised and measured in accordance<br />
with IAS 40:<br />
All amounts in TEUR<br />
Object Country Segment Revaluation<br />
Kalisz PL CEE 412.66<br />
Equator PL CEE 1,574.04<br />
Cirrus PL CEE 2,232.00<br />
Zenith PL CEE 2,360.65<br />
Nimbus PL CEE 5,126.45<br />
Revaluation to land – Poland 11,705.79<br />
Jandarmeriei Office RO SEE 19,084.72<br />
Harbourside Constanta RO SEE 21,466.40<br />
Craiova RO SEE 32,543.68<br />
Revaluation to land – Romania 73,094.80<br />
Antim Tower (land) BG SEE 78,740.42<br />
Revaluation to land – Bulgaria 78,740.42<br />
Total revaluations to land 163,541.01<br />
Notes<br />
As explained under point 3.4, this land was purchased to provide sites for the construction of investment properties.<br />
The other revaluations are related to investment properties.<br />
<strong>Report</strong> by the Executive Board 215<br />
Highlights <strong>2006</strong>/<strong>07</strong><br />
Business Model and Strategy<br />
Portfolio Structure<br />
Corporate Governance and Outlook<br />
Property Portfolio<br />
Development of Business<br />
Consolidated Financial Statements<br />
Service and Glossary
216 <strong>IMMOEAST</strong> <strong>Annual</strong> <strong>Report</strong> <strong>2006</strong>/<strong>07</strong><br />
IAS1.34(a)<br />
IFRS 3.56 (b)<br />
The following properties were recognised in accordance with IAS 40 and are classified as redevelopment objects.<br />
They include revaluation gains that were determined on the basis of the residual value method:<br />
Object Country Segment Revaluation<br />
Perlova 5 (Perl Invest) CZ CEE 4,944.9<br />
Na Prikope (NP Investment) CZ CEE 21,981.6<br />
Jungmannova (Jungmannova Estates) CZ CEE 3,347.4<br />
Jindirska (J.H.Prague) CZ CEE 4,786.7<br />
Panska (PAN Development) CZ CEE 5,349.8<br />
Total revaluation 40,410.5<br />
The valuation procedure follows the principles described under point 3.4.<br />
5.3 Other operating income<br />
All amounts in TEUR <strong>2006</strong>/<strong>07</strong> 2005/06<br />
Income from the disposal of properties 14,053.1 0.0<br />
Reversal of negative goodwill 5,015.2 43,951.0<br />
Reversal of provisions 1,054.9 589.3<br />
Insurance compensation 36.5 3.8<br />
Currency translation adjustments 15,411.4 1,199.6<br />
Miscellaneous 10,153.5 5,590.8<br />
Total 45,724.6 51,334.4<br />
In accordance with IAS 1.34 (a), income from the sale of properties is presented net of the book value of the disposal.<br />
The amount shown above represents the sale of the Europe Tower in Budapest.<br />
Miscellaneous other operating income includes subsequent reductions in the purchase price of properties. Of this<br />
total, TEUR 2,678.5 are related to acquisitions in Hungary and TEUR 3,142.4 to acquisitions in Slovakia. A further<br />
TEUR 892.8 represent expenses charged to other parties.<br />
5.4 Depreciation and amortisation<br />
Information on depreciation and amortisation is included in the notes on property under construction (4.1.2), tangible<br />
assets (4.2), intangible assets (4.3.1) and goodwill (4.3.2).<br />
5.5 Expenses related to properties<br />
All amounts in TEUR <strong>2006</strong>/<strong>07</strong> 2005/06<br />
Operating costs charged on 41,031.0 17,999.0<br />
Bad debt allowances 2,451.0 1,602.4<br />
Vacancies 1,705.5 819.2<br />
Commissions 1,339.6 330.8<br />
Maintenance 747.1 12.3<br />
Other current expenses 1,576.7 6.1<br />
Other directly allocated expenses 5,421.8 2,258.1<br />
Total 54,272.7 23,027.9<br />
Other directly allocated expenses are comprised entirely of costs associated with property ownership.
5.6 Other operating expenses<br />
All amounts in TEUR <strong>2006</strong>/<strong>07</strong> 2005/06<br />
Administration 50,366.4 17,427.5<br />
Legal, auditing and consulting fees 8,312.4 6,028.8<br />
Taxes and duties 4,666.7 1,915.1<br />
Commissions 3,408.5 2,998.5<br />
Penalties 4,134.8 1,669.1<br />
Advertising 1,914.1 1,544.3<br />
Rental and leasing expenses 215.3 230.9<br />
Remuneration for Supervisory Board 97.5 195.0<br />
Expert opinions 2,254.9 446.1<br />
Translations 32.3 16.8<br />
Miscellaneous 15,811.5 4,372.1<br />
Total 91,214.4 36,844.1<br />
Miscellaneous other operating expenses include TEUR 269.4 of expenses charged on and TEUR 9,748.3 of currency<br />
translation adjustments that were allocated to the operating area.<br />
Point 4.3.4 provides information on differences, which arose during the consolidation of liabilities and are related to<br />
puttable instruments.<br />
Information on closely related parties and persons (management fees) is provided under point 8.4.1.1.<br />
5.7 Personnel expenses<br />
The average workforce employed by companies included in the consolidated financial statements developed as<br />
follows:<br />
<strong>2006</strong>/<strong>07</strong> 2005/06<br />
Wage employees 0 0<br />
Salaried employees 16 4<br />
Total 16 4<br />
Five persons were employed by Mester Park Kft. and four persons by ELCO Sp.z.o.o., an energy supply company that<br />
is owned by Nowe Centrum Sp.z o.o; three persons were employed by Alacor project companies which, in turn, are<br />
owned by Roches Ventures Ltd., a Cypriote holding company. Three employees work for each of the following: the<br />
Russian OOO Torgoviy Dom Na Khodinke; Krona Design LLC; and Wakelin Promotions Ltd. One employee works for<br />
the Romanian IRIDE S.A.<br />
All amounts in TEUR <strong>2006</strong>/<strong>07</strong> 2005/06<br />
Wages 37.5 2.8<br />
Salaries 205.4 18.1<br />
Expenses for pensions 19.6 3.1<br />
Other personnel expenses 67.3 0.4<br />
Total 329.8 24.4<br />
Notes<br />
5.8Costofgoodssold<br />
The cost of goods sold totalled TEUR 818.2 (2005/06: TEUR 301.2) and is related to inventories (see point 4.8).<br />
<strong>Report</strong> by the Executive Board 217<br />
Highlights <strong>2006</strong>/<strong>07</strong><br />
Business Model and Strategy<br />
Portfolio Structure<br />
Corporate Governance and Outlook<br />
Property Portfolio<br />
Development of Business<br />
Consolidated Financial Statements<br />
Service and Glossary
218 <strong>IMMOEAST</strong> <strong>Annual</strong> <strong>Report</strong> <strong>2006</strong>/<strong>07</strong><br />
IFRS 7.20 (a)<br />
5.9 Financial results<br />
All amounts in TEUR <strong>2006</strong>/<strong>07</strong> 2005/06<br />
Interest and similar income 56,573.3 15,465.7<br />
Interest and similar expenses -42,441.5 -17,<strong>07</strong>8.6<br />
Net financing costs 14,131.8 -1,612.9<br />
Profit/(loss) on financial instruments and proceeds on the disposal of financial instruments 36,015.1 7,850.9<br />
Currency translation adjustments 34,356.6 11,141.5<br />
Profit/(loss) on financial instruments at fair value through profit or loss 12,414.6 6,829.4<br />
Income from distributions 5,422.2 3,670.5<br />
Share of profit/(loss) from investments in other companies 1,122.7 0.0<br />
Profit/(loss) on financial instruments 89,331.2 29,492.3<br />
Share of profit/(loss) from associated companies 700.6 -1,203.1<br />
Financial results 104,163.5 26,676.3<br />
The valuation of financial instruments at fair value through profit or loss comprises a revaluation of TEUR 13.872,1<br />
and an impairment charge of TEUR 1,457.5. The impairment consists of a TEUR 947.1 charge to the investment in<br />
FF&P Russia Real Estate Ltd. and a TEUR 510.4 charge to the investment in Prime Property BG Reit. These impairment<br />
charges resulted from start-up losses and founding costs.<br />
The share of profit/(loss) from associated companies includes distributions of TEUR 3,777.8 (2005/06: TEUR 3,009.8)<br />
from Heitman Central Europe Property Partners II, TEUR 216.0 from Eastern Property Holdings Ltd and TEUR 597.7<br />
(2005/06: TEUR 657.8) from FF&P Russia Real Estate Limited.<br />
IFRS 7.20 (a) requires the disclosure of net gains and losses for each category of financial instrument defined in<br />
IAS 39.9. This information is presented in the following table:<br />
Designated at fair value through profit and loss Held for trading<br />
All amounts in TEUR Investments in other companies Derivatives<br />
Revaluation 13,872.1 1,446.5<br />
Impairment charge -1,457.5 -364.5<br />
Net gains/(losses) 12,414.6 1,082.0<br />
Currency translation adjustments are immaterial, and are therefore not shown separately.<br />
5.10 Income taxes<br />
Additional information on this balance sheet position is provided under point 3.13.<br />
This item includes income taxes paid or owed by Group companies as well as provisions for deferred taxes.<br />
All amounts in TEUR <strong>2006</strong>/<strong>07</strong> 2005/06<br />
Income tax expense -11,926.1 -2,900.2<br />
Deferred taxes -97,343.0 -34,754.1<br />
Total -109,269.1 -37,654.3<br />
The difference between calculated income tax expense and actual income expense for <strong>2006</strong>/<strong>07</strong> as shown on the<br />
income statement is due to the following factors:
All amounts in TEUR <strong>2006</strong>/<strong>07</strong> 2005/06<br />
Earnings before tax 645,452.2 182,945.6<br />
Income tax expense at tax rate of 25% -161,363.0 25.0% -45,736.4 25.0%<br />
Different tax rates 39,005.6 -6.0% 8,548.5 -4.7%<br />
Changes in tax rates 0.0 0.0% 0.0 0.0%<br />
Amortisation of goodwill/reversal of negative goodwill -9,557.2 1.5% 3,305.3 -1.8%<br />
Balance sheet recognition of losses, not through profit or loss 23,206.8 -3.6% 0.0 0.0%<br />
Non-deductible expenses -5,237.3 0.8% -2,485.6 1.4%<br />
Tax-free income 7,728.0 -1.2% 2,592.4 -1.4%<br />
Valuation adjustments to deferred taxes -2,370.3 0.4% -2,671.0 1.5%<br />
Effects related to other periods and other non-temporary differences -681.7 0.1% -1,2<strong>07</strong>.6 0.7%<br />
Effective tax rate -109,269.1 16.9% -37,654.3 20.6%<br />
6. Notes to the Cash Flow Statement<br />
The Cash Flow Statement for the <strong>IMMOEAST</strong> Group shows the changes in cash and cash equivalents resulting from<br />
the inflow and outflow of funds during the reporting year. The Cash Flow Statement distinguishes between cash flows<br />
from operating activities, investing activities, and financing activities. Cash flow from operating activities is calculated<br />
using the indirect method in accordance with IAS 7.18 (b). Cash and cash equivalents of TEUR 22,529.2 (2005/06:<br />
TEUR 14,129.0) are attributable to companies consolidated on a proportionate basis. All information required by<br />
IAS 7 is provided in the statement of cash flows. The following assets and liabilities, which were acquired through<br />
the purchase of property companies, are stated at present value:<br />
All amounts in TEUR <strong>2006</strong>/<strong>07</strong> 2005/06<br />
Cash and cash equivalents 47,614.9 19,143.2<br />
Intangible assets (excluding goodwill) 4.1 99.6<br />
Receivables and other assets 93,608.3 22,445.2<br />
Deferred tax assets 4,292.9 7,265.1<br />
Property 968,167.5 889,706.1<br />
Tangible assets 702.2 1,292.7<br />
Financial liabilities -190,057.1 -329,662.4<br />
Trade accounts payables -18,253.7 -16,578.4<br />
Other liabilities -195,361.9 -153,736.4<br />
Provisions -630.0 -2,316.4<br />
Deferred tax liabilities -149,694.4 -94,217.2<br />
Minority interests -7,399.5 -0.1<br />
Currency translation adjustment -2,451.0 886.2<br />
Acquired net assets 550,542.3 344,327.2<br />
(Negative) goodwill 200,655.1 -13,974.7<br />
Outstanding purchase prices -50,857.4 -50,681.7<br />
Purchase prices paid in cash 700,340.0 279,670.9<br />
Less cash and cash equivalents acquired -47,614.9 -19,143.2<br />
Net purchase price for property companies 652,725.1 260,527.6<br />
Notes<br />
<strong>Report</strong> by the Executive Board 219<br />
Highlights <strong>2006</strong>/<strong>07</strong><br />
Business Model and Strategy<br />
Portfolio Structure<br />
Corporate Governance and Outlook<br />
Property Portfolio<br />
Development of Business<br />
Consolidated Financial Statements<br />
Service and Glossary<br />
IAS7.18(b)
220 <strong>IMMOEAST</strong> <strong>Annual</strong> <strong>Report</strong> <strong>2006</strong>/<strong>07</strong><br />
IAS 7.7<br />
Purchase prices totalling TEUR 700,340.0 (2005/06: TEUR 279,670.9) for property companies were paid in cash.<br />
The following assets and liabilities at fair value were taken over following the acquisition of additional shares in companies<br />
(transition consolidation). These transactions led to a change in the consolidation method (also see point 2.3):<br />
All amounts in TEUR <strong>2006</strong>/<strong>07</strong> 2005/06<br />
Cash and cash equivalents 3,776.6 1,737.6<br />
Intangible assets (excluding goodwill) 0.0 12.6<br />
Receivables and other assets 2,692.3 3,040.8<br />
Deferred tax assets 1,683.9 1,211.1<br />
Property 162,833.7 42,<strong>07</strong>3.1<br />
Tangible assets 45.2 9.0<br />
Financial liabilities -76,301.9 -19,550.9<br />
Trade accounts payable -1,634.6 -383.7<br />
Provisions -1,877.6 -66.6<br />
Other liabilities -1,921.8 -2,344.3<br />
Deferred tax liabilities -19,957.8 -3,129.2<br />
Currency translation adjustment -1,121.9 -2,156.3<br />
Acquired net assets 68,215.9 20,453.1<br />
(Negative) goodwill 18,445.9 -406.9<br />
Outstanding purchase prices -3,475.2 0.0<br />
Total purchase prices 83,186.6 20,046.1<br />
Less cash and cash equivalents acquired -3,776.5 -1,737.6<br />
Net purchase price for property companies 79,410.1 18,308.6<br />
Purchase prices totalling TEUR 83,186.6 (2005/06: TEUR 20,046.1) for the acquisition of additional shares were paid<br />
in cash.<br />
Cash and cash equivalents are comprised of the following:<br />
All amounts in TEUR <strong>2006</strong>/<strong>07</strong> 2005/06<br />
Current securities 300,000.0 101,966.0<br />
Cash and cash equivalents 402,146.3 215,762.7<br />
Total 702,146.3 317,728.7<br />
Cash and cash equivalents include EUR 285.4 million in EUR, EUR 13.4 million in CZK, EUR 13.1 million in HUF,<br />
EUR 46.6 million in PLN, EUR 14.9 million in RON, EUR 13.1 million in SKK and EUR 15.6 million in other currencies.<br />
Liquidity as shown on the Cash Flow Statement is comprised of cash and cash equivalents and current securities. In<br />
accordance with IAS 7.7, current securities are classified as cash and cash equivalents if their remaining term is less<br />
than three months. All assets included under cash and cash equivalents meet this criterion as of the balance sheet<br />
date.
7. Segment <strong>Report</strong>ing<br />
IFRS 8 Operating Segments (convergence standard for segment reporting)<br />
The IASB issued International Financial <strong>Report</strong>ing Standard 8 Operating Segments as part of a joint project with<br />
the US Financial Accounting Standards Board (FASB) to reduce the differences between IFRS and US GAAP. IFRS 8<br />
replaces IAS 14 and achieves convergence with the requirements of SFAS 131. IFRS 8 requires companies to provide<br />
financial and descriptive information on their reportable segments, whereby this standard calls for the identification<br />
of operating segments based on the internal management focus of the company (management approach). In keeping<br />
with this approach, the presentation of the segments must reflect the same basis used for internal reporting. IFRS 8<br />
applies to annual periods beginning on or after 1 January 2009. The early application of IFRS 8 to these consolidated<br />
financial statements leads, above all, to additional disclosures in the notes and provide a more detailed insight into<br />
segment financial position and performance.<br />
IFRS 8 is applicable to financial years beginning after 31 December 2008. Earlier application of this standard is permitted<br />
and recommended, and the consolidated financial statements for <strong>2006</strong>/<strong>07</strong> make use of this option.<br />
The requirements for segment reporting were previously part of external reporting, a subject area where the international<br />
standards – IFRS and US-GAAP – differed. The requirements of SFAS 131 are based above all on internal<br />
reporting, while IAS 14 – the previous standard for segment reporting – calls for the derivation of disaggregated<br />
information according to independent principles that are anchored in external reporting. In particular, IFRS 8 calls for<br />
the application of the management approach for reporting on the economic development of the individual segments.<br />
The management approach assumes that the units defined for internal reporting and decision-making as well as the<br />
operating management of a company are also relevant for external segment reporting since the best information for<br />
segmentation is available to management. IAS 14 calls for the use of the risk and reward approach for segmentation.<br />
This approach requires the definition of segments on the basis of homogeneous risks and opportunities, which<br />
means the segments should represent separate components of the company that are differentiated in a way that the<br />
scope of their activities differs substantially with respect to risks and rewards.<br />
IAS 14 requires the disclosure of information according to a more detailed primary and a less detailed secondary<br />
format.<br />
In accordance with IFRS 8.5 ff., a component of an entity is an operating segment<br />
• if it engages in activities from which it may earn revenues and incur expenses, including revenues and expenses<br />
relating to transactions with other components of the same entity<br />
• if its operating results are regularly reviewed by the entity’s decision-makers and used to assess performance and<br />
allocate resources, and<br />
• discrete financial information is available on the component.<br />
IFRS 8.13 includes quantitative thresholds for the identification of reportable operating segments. The reporting<br />
obligation is triggered by three alternative criteria:<br />
• Revenue, including both sales to external customers and intersegment sales, equals at least 10% of the combined<br />
external and intersegment revenue of all operating segments, or<br />
• The reported segment profit or loss equals at least 10% of the greater of the combined reported profit of all operating<br />
segments that did not report a loss, and the combined reported loss of all operating segments that reported a<br />
loss, or<br />
• Segment assets equal at least 10% of the combined assets of all operating segments.<br />
Notes<br />
<strong>Report</strong> by the Executive Board 221<br />
Highlights <strong>2006</strong>/<strong>07</strong><br />
Business Model and Strategy<br />
Portfolio Structure<br />
Corporate Governance and Outlook<br />
Property Portfolio<br />
Development of Business<br />
Consolidated Financial Statements<br />
Service and Glossary<br />
IFRS 8.35<br />
IFRS 8.5<br />
IFRS 8.13
222 <strong>IMMOEAST</strong> <strong>Annual</strong> <strong>Report</strong> <strong>2006</strong>/<strong>07</strong><br />
IFRS 8.14<br />
IFRS 8.15<br />
IFRS 8.19<br />
IFRS 8.23<br />
IFRS 8.27<br />
IFRS 8.22<br />
Two or more operating segments may be aggregated into a single operating segment if they have similar economic<br />
characteristics that lead to expectations of comparable long-term development and if they meet the aggregation<br />
criteria defined in IFRS 8.12.<br />
These rules largely reflect the provisions of IAS 14. However in contrast to IAS 14.35, the segment is no longer<br />
required to earn the majority of its revenues from sales to external customers.<br />
Additional operating segments must be defined until at least 75% of the total segment revenue is generated by sales<br />
to external customers. There is no predefined order for this selection.<br />
Segments that were classified as significant in the previous year must still be presented separately if they are of<br />
continuing significance. Segments that are considered to have a special relevance are also designated as reportable,<br />
e.g. rapidly growing fields of business or high-risk areas.<br />
In agreement with SFAS 131.24, IFRS 8.19 recommends limiting the number of reportable segments to ten so as not<br />
to endanger relevance and understandability. However, there is no limit on the number of reportable segments and<br />
this recommendation is solely related to voluntary segment disclosures.<br />
In accordance with the management approach, the entity must disclose the measure of segment profit or loss that is<br />
used for internal management and reporting purposes. The following amounts must also be disclosed if they are<br />
included in reported profit or loss, or are regularly provided to management:<br />
• segment revenues from external customers;<br />
• intersegment revenues;<br />
• interest expense and income (not netted out, unless this figure is used for internal management purposes);<br />
• material items of income and expense as defined in IAS 1.86;<br />
• the entity’s interest in investments consolidated at equity;<br />
• income tax expense or income;<br />
• material non-cash items other than depreciation, amortisation and impairment charges.<br />
• segment liabilities must also be disclosed if these figures are used for internal management purposes.<br />
Additional information must also be provided on assets if the relevant amounts are included in segment assets or<br />
are otherwise regularly provided to management:<br />
• the carrying values of investments consolidated at equity;<br />
• additions to non-current assets.<br />
In accordance with IFRS 8.27, the quantitative data provided on the segments should be accompanied by explanations<br />
covering – as a minimum – the accounting and valuation methods applied. In addition, general information<br />
should be disclosed to provide insight into the nature of business activities and internal reporting. This information<br />
is designed to support an understanding of the presentation of data and identification of segments in accordance<br />
with the management approach. IFRS 8.22 requires the disclosure of:<br />
• the factors used to identify the reportable segments, including the internal organisational structure, and<br />
• the products and services from which the individual segments derive their revenues.<br />
The central decision-maker of <strong>IMMOEAST</strong> is the Executive Board as a collegial body. Internal reporting to the Executive<br />
Board is based on country information that comprises the income statements from the individual countries<br />
including the related elimination of income, expenses and interim profits as well as the holding companies that are<br />
allocated to the relevant country operating organisations. The Executive Board is also provided with information on<br />
country-specific cash flows.
<strong>IMMOEAST</strong> is a property company that invests exclusively in properties located on markets in Eastern Europe. The<br />
core market of <strong>IMMOEAST</strong> AG covers three regions: Central and Eastern Europe (CEE) with investments in the Czech<br />
Republic, Poland, Slovakia, Hungary and Estonia; South-eastern Europe (SEE) with investments in Croatia, Romania,<br />
Bulgaria, Slovenia and Serbia; as well as the Community of Independent States (CIS) with investments in Russia<br />
and Ukraine. The identification of segments by <strong>IMMOEAST</strong> AG follows the internal reporting structure and meets<br />
the materiality criteria defined in IFRS 8.13 (see following table). The property portfolio of <strong>IMMOEAST</strong> is diversified<br />
through two types of segments: regional segments (primary segments) Central and Eastern Europe (CEE: subdivided<br />
into Hungary, the Czech Republic, Poland and Slovakia), South-eastern Europe (SEE: subdivided into Romania, Slovenia,<br />
Serbia, Bulgaria and Croatia) and the Community of Independent States (CIS: Russia and Ukraine) as well as<br />
sector segments that reflect the type of property (secondary segments) such as office, logistics, commercial, hotel<br />
and residential. The activities of the Group are concentrated primarily on the purchase and rental of properties as<br />
well as the widely diversified investment in properties with various types of use – ranging from apartments, offices,<br />
hotels, logistics and commercial space up to garages in Central and South-eastern Europe. According to IFRS 8.13,<br />
an operating segment qualified as reportable if it generates at least 10% of the combined segment revenue, segment<br />
profit or segment assets.<br />
The following table explains the materiality criterion for the identification of segments:<br />
Segment CEE SEE CIS <strong>IMMOEAST</strong> Group<br />
Values in million<br />
Segment revenue<br />
<strong>2006</strong>/<strong>07</strong> 2005/06 <strong>2006</strong>/<strong>07</strong> 2005/06 <strong>2006</strong>/<strong>07</strong> 2005/06 <strong>2006</strong>/<strong>07</strong> 2005/06<br />
Absolute amount 142.2 65.9 26.0 14.1 24.7 0.0 193.0 80.0<br />
Relative amount<br />
Segment profit<br />
73.7% 82.4% 13.5% 17.6% 12.8% 0.0%<br />
Absolute amount 224.4 92.2 189.9 25.6 30.8 0.0 536.2 145.3<br />
Relative amount<br />
Segment assets<br />
41.9% 63.5% 35.4% 17.6% 5.7% 0.0%<br />
Absolute amount 2,960.8 1,642.0 869.1 255.7 464.6 0.0 6,728.2 2,687.5<br />
Relative amount 44.0% 61.1% 12.9% 9.5% 6.9% 0.0%<br />
Revenues<br />
<strong>IMMOEAST</strong> recorded revenues of TEUR 192,920.4 in <strong>2006</strong>/<strong>07</strong>. Of this total, 23.8% were generated in Poland, the<br />
largest regional segment of the Group. Revenues in Poland more than tripled from TEUR 14,692.3 in 2005/06 to<br />
TEUR 45,845.3 for the reporting year. This growth was supported not only by acquisitions, but also by the excellent<br />
level of occupancy in the properties owned in this country. Investments in Poland are focused primarily on office,<br />
logistics and commercial space. The Czech Republic, the second largest regional segment of <strong>IMMOEAST</strong>, generated<br />
20.8% of Group revenues in <strong>2006</strong>/<strong>07</strong>. Revenues in this segment rose by 76.9% over the previous financial year, from<br />
TEUR 22,703.6 to TEUR 40,153.3. Hungary, with a 16.9% share of Group revenues, recorded an increase of 54.9%<br />
over the previous year to TEUR 32,568.4. In Romania, revenues rose significantly from TEUR 14,115.6 in 2005/06<br />
to TEUR 22,806.3 for the reporting year. Slovakia contributed 12.3% or TEUR 23,633.9 to Group revenues. During<br />
<strong>2006</strong>/<strong>07</strong> <strong>IMMOEAST</strong> was able to expand its property portfolio in a further six countries, including four countries<br />
in South-eastern Europe (SEE): Croatia with revenues of TEUR 1,589.7, Slovenia with TEUR 1,113.1, Bulgaria with<br />
TEUR 482.5 and Serbia with TEUR 1.2. The regional segment Russia realised revenues of TEUR 24,726.6, which represents<br />
a share of 12.8%.<br />
Notes<br />
<strong>Report</strong> by the Executive Board 223<br />
Highlights <strong>2006</strong>/<strong>07</strong><br />
Business Model and Strategy<br />
Portfolio Structure<br />
Corporate Governance and Outlook<br />
Property Portfolio<br />
Development of Business<br />
Consolidated Financial Statements<br />
Service and Glossary
224 <strong>IMMOEAST</strong> <strong>Annual</strong> <strong>Report</strong> <strong>2006</strong>/<strong>07</strong><br />
Operating profit (EBIT)<br />
<strong>IMMOEAST</strong> recorded an improvement in operating profit from TEUR 156,269.4 in the previous year to TEUR 541,288.7<br />
for <strong>2006</strong>/<strong>07</strong>. The Czech Republic made the highest contribution to EBIT at 29%. This increase was supported above<br />
all by the positive development of the fair value of properties, which led to revaluation income of TEUR 146,145.4.<br />
Romania reported EBIT of TEUR 128,009.7 for <strong>2006</strong>/<strong>07</strong>, which represents an increase of 302.5% over the previous<br />
year as well as 23.7% of total EBIT recorded by <strong>IMMOEAST</strong>. This development was driven by two main factors: the<br />
sound increase in the fair value of the properties, which generated revaluation income of TEUR 117,134.2, and strong<br />
revenue growth in this segment.<br />
Business activities in Poland also showed very positive development, with EBIT reaching TEUR 81,234.3 in comparison<br />
to TEUR 56,023.5 in the previous year. The major component of the earnings improvement in this segment was<br />
also provided by the revaluation of properties.<br />
The new segment Bulgaria registered EBIT of 78,643.7 in <strong>2006</strong>/<strong>07</strong>, which represents 14.5% of operating profit for the<br />
Group. The largest contribution to earnings in this segment was generated by the revaluation of properties.<br />
Slovakia reported sound growth in EBIT. In comparison to the negative EBIT of TEUR 21,420.8 recorded in the previous<br />
year, the favourable development in the fair value of properties supported an increase in operating profit to<br />
TEUR 23,816.6.<br />
Financial results<br />
Financial results recorded by <strong>IMMOEAST</strong> rose from TEUR 26,676.3 in 2005/06 to TEUR 104,163.5 for the reporting<br />
year. This development resulted above all from profit on financial investments. Currency translation adjustments in<br />
the individual countries made a positive contribution of TEUR 15,411.4 (2005/06: TEUR 1,199.6) to financial results.<br />
The increasing strength of the HUF and RON led to currency translation gains in Hungary und Romania geführt. With<br />
a share of 10%, the Slovakia segment made the highest contribution to financial results recorded by <strong>IMMOEAST</strong> for<br />
the reporting year.<br />
Investments<br />
<strong>IMMOEAST</strong> invested a total of TEUR 1,480,861.7 during <strong>2006</strong>/<strong>07</strong>, which was allocated as follows: 26.7% in the Czech<br />
Republic, 23.7% in Russia, 23.4% in Poland, 12.1% in Romania and 7.2% in Hungary. These investments focused<br />
primarily on office, logistics and commercial properties.<br />
Cash EBIT margin<br />
The segment Poland made the highest cash contribution to profit recorded by <strong>IMMOEAST</strong> in <strong>2006</strong>/<strong>07</strong>. The segment<br />
Hungary fell slightly behind the average cash EBIT margin of 34%, but increased project investments led to impressive<br />
growth in this indicator over the previous year. Only Serbia and Bulgaria remained significantly below the Group<br />
average of 34%, but this situation is related to the higher costs incurred for the development projects that are currently<br />
underway in these countries.<br />
Transition from segment to Group data<br />
The transition column includes the effects resulting from consolidation procedures as well as the amounts relating<br />
to other non-reportable segments.<br />
The amounts in the transition column “Group net profit for the period” are related above all to other operating income<br />
and expenses as well as other financial items from the non-reportable segments, which represent a component of<br />
segment profit but not of operating profit for the Group.<br />
Segment assets are comprised chiefly of investment property (IAS 40), property under construction (IAS 16) and<br />
intangible assets as well as investments carried at equity, inventories and receivables.
Segment liabilities consist of financial liabilities, trade accounts payable, provisions and tax liabilities.<br />
The transition column for segment assets and liabilities is comprised chiefly of eliminated receivables and liabilities<br />
for regions that are not allocated to a specific segment.<br />
Segment investments include additions to property, tangible assets and investments in financial assets carried at<br />
equity as well as intangible assets (excluding goodwill).<br />
8. Other information<br />
8.1 <strong>Report</strong>ing on financial instruments and risk report<br />
8.1.1 General information<br />
IFRS 7.31 requires the disclosure of information that enables the users of financial statements to evaluate the nature<br />
and extent of risks arising from financial instruments to which the entity is exposed as of the balance sheet date.<br />
IFRS 7.32 in connection with IFRS 7.34 emphasise that the information to be disclosed should focus exclusively on<br />
the risks arising from financial instruments as well as the manner in which these risks are managed.<br />
As an internationally active company, <strong>IMMOEAST</strong> is exposed to various financial risks. The most important financial<br />
risks for the Group are associated with possible changes in foreign exchange rates, interest rates, and stock prices as<br />
well as the creditworthiness and liquidity of customers and business partners. The goal of <strong>IMMOEAST</strong> is to actively<br />
control these risks through systematic risk management.<br />
In accordance with IAS 32 and IAS 39, a distinction is made between primary and derivative financial instruments.<br />
Primary financial instruments include investments in other companies that are reported under financial assets as<br />
well as securities and loans granted, trade accounts receivable, available-for-sale securities and deposits with financial<br />
institutions. Available-for-sale financial assets are carried at fair value; all other financial assets are shown at<br />
amortised cost. The determination of fair value is based on market prices or calculated in accordance with recognised<br />
valuation methods. Primary financial instruments recorded under liabilities are comprised primarily of financial<br />
liabilities and trade accounts payable, which are shown at amortised cost.<br />
Derivative financial instruments are used to hedge the risk associated with fluctuations in foreign exchange rates<br />
and interest rates arising from business operations as well as risk associated with monetary investments and financing<br />
(see point 8.1.3).<br />
Notes<br />
<strong>Report</strong> by the Executive Board 225<br />
Highlights <strong>2006</strong>/<strong>07</strong><br />
Business Model and Strategy<br />
Portfolio Structure<br />
Corporate Governance and Outlook<br />
Property Portfolio<br />
Development of Business<br />
Consolidated Financial Statements<br />
Service and Glossary
226 <strong>IMMOEAST</strong> <strong>Annual</strong> <strong>Report</strong> <strong>2006</strong>/<strong>07</strong><br />
8.1.2 Risk report<br />
8.1.2.1 Default/credit risk<br />
Credit risk (default risk) is understood to represent the risk that one party to a financial instrument causes the other<br />
party to incur a financial loss by failing to meet a financial obligation. In accordance with IFRS 7.36, an entity must<br />
disclose – for each class of financial instrument – information on the maximum exposure to credit risk as of the<br />
balance sheet date without taking account of any collateral held or other enhancements and also provide a description<br />
of collateral received and any credit enhancements as well as information on the carrying value of the financial<br />
assets whose contract terms were amended and which would have been classified as past due or impaired under<br />
the previous contract terms. In accordance with IFRS 7.B9, the amounts offset in keeping with IAS 32.42 ff. and<br />
impairment charges as defined in IAS 39 should be deducted from the gross carrying value of financial assets. The<br />
remaining amount represents the maximum credit risk. Collateral held in security and other credit enhancements are<br />
not included in this calculation, but only disclosed separately (IFRS 7.36(b)).<br />
Credit risks arise from the possibility that the counterparty to a transaction fails to meet his/her obligations, and the<br />
Group incurs financial damages as a result. The maximum credit risk for assets is represented by the amounts shown<br />
on the balance sheet. The risk of default associated with financial assets is reflected in impairment charges. The risk<br />
of default for <strong>IMMOEAST</strong> is low because the credit standing of customers is reviewed on a regular basis, and no single<br />
tenant is responsible for more than 5% of total outstanding receivables.<br />
The volume of primary financing instruments held by the Group is shown on the balance sheet, whereby the value of<br />
financial assets represents the maximum risk of default. The risk of default associated with other primary financing<br />
instruments and derivative financial instruments is also low because all financing transactions are concluded with<br />
financial institutions that have excellent credit ratings.<br />
The most important instrument for the management and control of default risk is the diversity of the property portfolio<br />
and the selection of a suitable tenant structure for each property. The risk of default on receivables due from<br />
tenants is low because tenants are generally required to provide collateral (for residential properties: cash deposits,<br />
for commercial properties: bank guarantees or cash deposits) and the credit standing of tenants is monitored on a<br />
regular basis.<br />
8.1.2.2Marketrisk<br />
Market risk is the risk that the fair value or future cash flows of a financial instrument may fluctuate due to a change<br />
in market prices. There are three types of market risk: foreign exchange risk, interest rate risk and other price risks.<br />
8.1.2.2.1 Foreign exchange risk<br />
Foreign exchange risks can affect <strong>IMMOEAST</strong> AG in two forms: fluctuation in foreign exchange rates can influence the<br />
results of valuations, and also have an impact on the asset position of the company.<br />
8.1.2.2.1.1 Impact on valuation<br />
The results from companies located outside the Euro zone, which are included using full or proportionate consolidation,<br />
are translated based on the functional currency of the local company in accordance with the modified current<br />
rate method. The expert opinions on properties are prepared in Euros and fluctuations in exchange rates will influence<br />
the results from the revaluation of properties.<br />
An increase in foreign exchange rates compared to the Euro will lead to higher Euro amounts in the fair values of<br />
investment properties than the amounts reflected in the expert opinions from the prior year. When the latest value is<br />
compared with the unchanged amount from a prior year expert opinion in Euro, the translation of the prior year Euro<br />
amount back into the functional currency (local currency) leads to a lower value – because of the higher exchange<br />
rate – and therefore to a write-down. If the value in the expert opinion rises, this foreign exchange effect reduces the
upward potential for the valuation of the property; if the value in the expert opinion is lower, this effect increases<br />
the write-down.<br />
A decline in foreign exchange rates compared to the Euro lead to lower Euro amounts in the fair values than the<br />
amounts shown in prior years when the fair values of properties are translated. When the latest value is compared<br />
with the unchanged amount from a prior year expert opinion in Euro, the translation of the prior year Euro amount<br />
back into the functional currency (local currency) leads to a higher value – because of the lower exchange rate – and<br />
therefore to a write-up. If the value in the expert opinion rises, this foreign exchange effect increases the upward for<br />
the valuation of the property; if the value in the expert opinion is lower, this effect reduces the write-down.<br />
As of 30 April 20<strong>07</strong>, the net revaluation income recognised by <strong>IMMOEAST</strong> totalled TEUR 493,095.1. This figure comprises<br />
revaluation income of TEUR 567,003.6 and impairment charges of TEUR 73,908.5. Part of the impairment<br />
charges resulted exclusively from an increase in the value of the local currency compared with the Euro. This effect<br />
involved properties in Hungary, Poland, Slovakia and Romania.<br />
The following Group exchange rates were used for foreign currency translation as of 30 April 20<strong>07</strong>:<br />
HUF PLN CZK ROL<br />
Closing rate on 30 April 20<strong>07</strong> 247.180000 3.781000 28.123000 33293.000000<br />
Average rate 255.630000 3.827850 28.271500 34021.500000<br />
RON CYP SKK EEK<br />
Closing rate on 30 April 20<strong>07</strong> 3.329300 0.582600 33.72700 15.64660<br />
Average rate 3.402150 0.579300 35.561000 15.646600<br />
BGN USD CHF RUB<br />
Closing rate on 30 April 20<strong>07</strong> 1.955800 1.360500 1.645800 35.01000<br />
Average rate 1.955800 1.3<strong>07</strong>100 1.608550 34.570000<br />
HRK UAH BAM<br />
Closing rate on 30 April 20<strong>07</strong> 7.36150 6.81810 1.95910<br />
Average rate 7.361500 6.688975 1.951550<br />
<strong>Report</strong> by the Executive Board 227<br />
Highlights <strong>2006</strong>/<strong>07</strong><br />
Business Model and Strategy<br />
Portfolio Structure<br />
Corporate Governance and Outlook<br />
Property Portfolio<br />
Development of Business<br />
Consolidated Financial Statements<br />
Service and Glossary<br />
CSD SEK<br />
Closing rate on 30 April 20<strong>07</strong> 81.30900 9.15230<br />
Average rate 83.460000 9.177000<br />
A theoretical increase of 2.5% in exchange rates in Hungary, Poland, Slovakia and Romania against the Euro as of the<br />
balance sheet date would have resulted in a negative impact of TEUR 49,632.4 on revaluation results.<br />
A theoretical increase of 2.0% in the exchange rates of all countries against the Euro as of the balance sheet date<br />
would have resulted in a net positive impact of TEUR 424,705.2 on revaluation results. This would reflect a revaluation<br />
of TEUR 603,494.3 and impairment charges of TEUR 178,789.1.<br />
A theoretical decrease of 2.0% in the exchange rates of all countries against the Euro as of the balance sheet date<br />
would have resulted in a net positive impact of TEUR 561,485.0 on revaluation results. This would reflect a revaluation<br />
of TEUR 714,741.3 and impairment charges of TEUR 153,256.3.<br />
Notes
228 <strong>IMMOEAST</strong> <strong>Annual</strong> <strong>Report</strong> <strong>2006</strong>/<strong>07</strong><br />
8.1.2.2.1.2 Impact on the asset position<br />
IAS 21 calls for the translation of monetary assets and liabilities at the average exchange rate in effect on the balance<br />
sheet date as well as the recognition of any gains or losses to the income statement. For this reason, fluctuations in<br />
exchange rates can have a direct impact on the asset position of the group.<br />
The risk of devaluation associated with cash balances in foreign currencies is offset by the rapid conversion of these<br />
funds into euros or through investments in these currencies. In addition, the low USD cash balances are used for<br />
investments in USD to which the group is committed.<br />
Another management instrument to minimise foreign exchange risk is the restrictive use of foreign currency credits<br />
in Europe. In this region, the risk arising from adverse foreign exchange effects is outweighed by the advantages of<br />
low interest rates.<br />
In order to limit the foreign exchange risk associated with rental income, contractual agreements with tenants in<br />
countries where the functional currency is not the Euro generally call for the payment of rents in Euro or link the rental<br />
payments to the Euro exchange rate on particular dates.<br />
Derivative financial instruments are also used to manage foreign exchange risk. The derivative financial instruments<br />
used by <strong>IMMOEAST</strong> to hedge foreign exchange risk are recorded as independent transactions and not as hedge<br />
transactions. Hedge accounting as defined in IAS 39.85 – IAS 39.102 is not applied because the requirements stated<br />
in these regulations are not met.<br />
Derivative financial instruments are stated at market value. Derivatives with a positive market value are included<br />
under the balance sheet position “other financial instruments”, while derivatives with a negative market value are<br />
shown under “other liabilities“.<br />
Any changes in this market value are recognised as income or expenses under financial results.<br />
The following table shows the market values and conditions of all derivative financial instruments that were purchased<br />
to hedge foreign exchange risk.<br />
Reference Market<br />
Fixed interest Reference value as of value as of<br />
rate/ex- interest 30.4.20<strong>07</strong> 30.4.20<strong>07</strong><br />
Company Derivative Currency Beginning End Financial institution change rate rate Hedge Currency in 1,000 in 1,000<br />
MBP I Sp. z o.o. FX FORWARD USD/EUR 4.12.<strong>2006</strong> 29.6.20<strong>07</strong> Aareal Bank AG 1.3344 n.a. Foreign currency (USD) USD 2,536.3 46.3<br />
MBP I Sp. z o.o. FX FORWARD USD/EUR 4.12.<strong>2006</strong> 28.9.20<strong>07</strong> Aareal Bank AG 1.3383 n.a. Foreign currency (USD) USD 2,4<strong>07</strong>.7 43.3<br />
MBP I Sp. z o.o. FX FORWARD USD/EUR 4.12.<strong>2006</strong> 28.12.20<strong>07</strong> Aareal Bank AG 1.3417 n.a. Foreign currency (USD) USD 2,336.1 41.1<br />
MBP I Sp. z o.o. FX FORWARD USD/EUR 4.12.<strong>2006</strong> 31.3.2008 Aareal Bank AG 1.3448 n.a. Foreign currency (USD) USD 2,185.1 37.0<br />
MBP I Sp. z o.o. FX FORWARD USD/EUR 4.12.<strong>2006</strong> 30.6.2008 Aareal Bank AG 1.3477 n.a. Foreign currency (USD) USD 2,126.1 34.2<br />
MBP I Sp. z o.o. FX FORWARD USD/EUR 4.12.<strong>2006</strong> 30.9.2008 Aareal Bank AG 1.35<strong>07</strong> n.a. Foreign currency (USD) USD 1,975.8 29.8<br />
MBP I Sp. z o.o. FX FORWARD USD/EUR 4.12.<strong>2006</strong> 30.12.2008 Aareal Bank AG 1.3539 n.a. Foreign currency (USD) USD 1,808.1 25.4<br />
MBP I Sp. z o.o. FX FORWARD USD/EUR 4.12.<strong>2006</strong> 31.3.2009 Aareal Bank AG 1.3571 n.a. Foreign currency (USD) USD 1,581.9 20.6<br />
MBP I Sp. z o.o. FX FORWARD USD/EUR 4.12.<strong>2006</strong> 30.6.2009 Aareal Bank AG 1.3602 n.a. Foreign currency (USD) USD 1,482.8 18.0<br />
MBP I Sp. z o.o. FX FORWARD USD/EUR 4.12.<strong>2006</strong> 30.9.2009 Aareal Bank AG 1.3633 n.a. Foreign currency (USD) USD 939.3 10.7<br />
MBP I Sp. z o.o. FX FORWARD USD/EUR 4.12.<strong>2006</strong> 30.12.2009 Aareal Bank AG 1.3668 n.a. Foreign currency (USD) USD 643.6 6.7<br />
MBP I Sp. z o.o. FX FORWARD USD/EUR 4.12.<strong>2006</strong> 31.3.2010 Aareal Bank AG 1.3708 n.a. Foreign currency (USD) USD 570.1 5.3<br />
MBP I Sp. z o.o. FX FORWARD USD/EUR 4.12.<strong>2006</strong> 30.6.2010 Aareal Bank AG 1.3744 n.a. Foreign currency (USD) USD 567.7 4.9<br />
MBP I Sp. z o.o. FX FORWARD USD/EUR 4.12.<strong>2006</strong> 30.9.2010 Aareal Bank AG 1.3779 n.a. Foreign currency (USD) USD 567.7 4.5<br />
MBP I Sp. z o.o. FX FORWARD USD/EUR 4.12.<strong>2006</strong> 30.12.2010 Aareal Bank AG 1.3814 n.a. Foreign currency (USD) USD 378.5 2.8<br />
The reference value forms the basis value for derivatives outstanding as of the balance sheet date.
The market value represents the amount that the relevant company would receive or be required to pay if the transaction<br />
were terminated as of the balance sheet date. The market values do not reflect the proportionate consolidation<br />
of the company in the consolidated financial statements.<br />
8.1.2.2.2 Interest rate risk<br />
As an international company, <strong>IMMOEAST</strong> is exposed to the risk of interest rate fluctuations on various property submarkets.<br />
Changes in interest rates can influence the earnings recorded by the Group through higher interest costs for<br />
existing variable rate financing, and can also have a reflex effect on the valuation of properties.<br />
Changes in interest rates have a direct influence on the financial results recorded by the Group in that they increase<br />
the cost of variable rate financing. <strong>IMMOEAST</strong> manages the risk associated with rising interest rates, which would<br />
lead to an increase in interest expense and a decline in financial results, through the use of derivative financial<br />
instruments. The derivative financial instruments used by <strong>IMMOEAST</strong> to hedge interest rate risk are recorded as<br />
independent transactions and not as hedge transactions. Hedge accounting as defined in IAS 39.85 – IAS 39.102 is<br />
not applied because the requirements stated in these regulations are not met.<br />
Derivative financial instruments are stated at market value. Derivatives with a positive market value are included<br />
under the balance sheet position “other financial instruments”, while derivatives with a negative market value are<br />
shown under “other liabilities“.<br />
Any changes in this market value are recognised as income or expenses under financial results. In addition, the Group<br />
has concluded financing contracts that carry fixed interest rates.<br />
The following table shows the market values and conditions of all derivative financial instruments that were purchased<br />
to hedge interest rate risk.<br />
The reference value forms the basis value for derivatives outstanding as of the balance sheet date.<br />
The market value represents the amount that the relevant company would receive or be required to pay if the transaction<br />
were terminated as of the balance sheet date. The market values do not reflect the proportionate consolidation<br />
of the company in the consolidated financial statements.<br />
<strong>Report</strong> by the Executive Board 229<br />
Highlights <strong>2006</strong>/<strong>07</strong><br />
Business Model and Strategy<br />
Portfolio Structure<br />
Corporate Governance and Outlook<br />
Property Portfolio<br />
Development of Business<br />
Consolidated Financial Statements<br />
Service and Glossary<br />
Reference Market<br />
Fixed interest Reference value as of value as of<br />
rate/ex- interest 30.4.20<strong>07</strong> 30.4.20<strong>07</strong><br />
Company Derivative Currency Beginning End Financial institution change rate rate Hedge Currency in 1,000 in 1,000<br />
Atom Centrum a.s.<br />
Centrum Olympia<br />
CAP EUR 31.3.<strong>2006</strong> 31.3.2011 HVB Bank Czech Republic a.s. 4.00% 3M-EURIBOR Interest rate EUR 14,418.8 184.1<br />
Olomouc a.s. CAP EUR 31.8.2005 30.9.2010 HVB Bank Czech Republic a.s. 3.00% 3M-EURIBOR Interest rate EUR 36,115.2 1,390.3<br />
PERL INVEST a.s. CAP EUR 31.1.<strong>2006</strong> 27.9.20<strong>07</strong> Bank Austria Creditanstalt AG 3.50% 3M-EURIBOR Interest rate EUR 4,920.1 6.3<br />
Prokopova Development a.s. CAP EUR 31.1.<strong>2006</strong> 27.9.20<strong>07</strong> Bank Austria Creditanstalt AG 3.50% 3M-EURIBOR Interest rate EUR 787.2 1.0<br />
E.N.G. Property a.s. CAP EUR 31.1.<strong>2006</strong> 27.9.20<strong>07</strong> Bank Austria Creditanstalt AG 3.50% 3M-EURIBOR Interest rate EUR 4,100.1 5.2<br />
JUNGMANNOVA ESTATES a.s. CAP EUR 31.1.<strong>2006</strong> 27.9.20<strong>07</strong> Bank Austria Creditanstalt AG 3.50% 3M-EURIBOR Interest rate EUR 10,660.2 13.6<br />
NP Investments a.s. CAP EUR 31.1.<strong>2006</strong> 27.9.20<strong>07</strong> Bank Austria Creditanstalt AG 3.50% 3M-EURIBOR Interest rate EUR 25,355.0 32.4<br />
J.H.Prague a.s. CAP EUR 31.1.<strong>2006</strong> 27.9.20<strong>07</strong> Bank Austria Creditanstalt AG 3.50% 3M-EURIBOR Interest rate EUR 9,512.2 12.2<br />
PAN Development a.s. CAP EUR 31.1.<strong>2006</strong> 27.9.20<strong>07</strong> Bank Austria Creditanstalt AG 3.50% 3M-EURIBOR Interest rate EUR 2,904.1 6.7<br />
IRIDE S.A. CAP EUR 7.8.<strong>2006</strong> 28.7.2011 Raiffeisen Zentralbank Österreich AG 5.00% 3M-EURIBOR Interest rate EUR 46,069.9 72.0<br />
Globe 13 Kft. CAP EUR 31.10.<strong>2006</strong> 31.10.2011 Bank Austria Creditanstalt AG 5.00% 3M-EURIBOR Interest rate EUR 17,450.0 -75.6<br />
Lentia Real (1) Kft. CAP EUR 31.10.<strong>2006</strong> 31.10.2011 Bank Austria Creditanstalt AG 5.00% 3M-EURIBOR Interest rate EUR 9,018.0 -40.4<br />
Szepvölgyi Businesspark Kft. CAP EUR 31.10.<strong>2006</strong> 31.10.2011 Bank Austria Creditanstalt AG 5.00% 3M-EURIBOR Interest rate EUR 9,700.0 -43.1<br />
Arpad Center Kft. CAP EUR 31.10.<strong>2006</strong> 31.10.2011 Bank Austria Creditanstalt AG 5.00% 3M-EURIBOR Interest rate EUR 5,420.0 -23.4<br />
MBP I Sp. z o.o. SWAP EUR 30.11.<strong>2006</strong> 30.12.2010 Aareal Bank AG 3.83% 3M-EURIBOR Interest rate EUR 141,661.7 1,833.5<br />
Notes
230 <strong>IMMOEAST</strong> <strong>Annual</strong> <strong>Report</strong> <strong>2006</strong>/<strong>07</strong><br />
IAS 24.12<br />
Changes in interest rates have an influence on the valuation of property. As part of the discounted cash flow method<br />
(DCF) that is used to value office and commercial properties, the present value of future cash flows from a property<br />
is determined by discounting these amounts based on the applicable interest rate. This interest rate is generally comprised<br />
of a risk-free basic interest rate and a risk premium that reflects the property category and sub-market. Rising<br />
interest rates lead to an increase in the risk-free basic interest rate, and thereby result in a higher discount factor. This<br />
reduces the present value of cash flows and, in turn, reduces the fair value of the property.<br />
The risk associated with changes in interest rates is determined by sensitivity analyses. A sensitivity analysis presents<br />
the effects of changes in market interest rates on interest payments, interest income and expense, other components of<br />
earnings and, possibly, also on equity. The following sensitivity analysis shows the influence of variable market interest<br />
rates on the interest expense associated with financial liabilities. This analysis presents the impact of an assumed average<br />
increase/decrease of 30, 75 and 135 basis points in interest rates on interest expense recognised during <strong>2006</strong>/<strong>07</strong>:<br />
Interest expense Interest rate scenarios<br />
All amounts in TEUR <strong>2006</strong>/20<strong>07</strong> +/- 0.30% +/- 0.75% +/- 1.35%<br />
Increase in variable interest rate -45,017.8 -45,150.9 -45,350.6 -45,616.9<br />
Decrease in variable interest rate -45,017.8 -44,884.7 -44,685.0 -44,418.8<br />
8.1.2.2.3 Other price risks<br />
As an international company, <strong>IMMOEAST</strong> is also exposed to price risks. Price risks are understood to mean the<br />
possible fluctuation in fair value or future cash flows as a result of changes in market prices.<br />
<strong>IMMOEAST</strong> would be exposed to price risk if the development of the property market in a region leads to increasing<br />
yields and property acquisitions were concluded at fixed yields that are below these market figures.<br />
8.2 Earnings per share<br />
In accordance with IAS 33, earnings per share are calculated<br />
by dividing net profit for the period by the weighted<br />
average number of issued shares.<br />
Diluted earnings per share are not reported separately<br />
because the company has no potential diluting shares of<br />
common stock.<br />
8.3 Information on the company<br />
The members of the Executive Board and Supervisory Board of <strong>IMMOEAST</strong> AG are as follows:<br />
Executive Board<br />
Karl Petrikovics – Chairman<br />
Norbert Gertner – Member<br />
Christian Thornton – Member (since 1 May 20<strong>07</strong>)<br />
Edgar Rosenmayr – Deputy member (since 1 May 20<strong>07</strong>)<br />
Supervisory Board<br />
Helmut Schwager – Chairman<br />
Wolfgang Reithofer – Vice-Chairman<br />
Christian Böhm<br />
Herbert Kofler<br />
Erhard Schaschl – up to 27 February 20<strong>07</strong><br />
<strong>2006</strong>/<strong>07</strong> 2005/06<br />
Total number of shares<br />
Weighted average number<br />
555,882,750 222,353,100<br />
of shares 515,676,436 191,040,910<br />
Net profit for the period in EUR 528,172,708 145,308,333<br />
Earnings per share in EUR 1.02 0.76
8.4 Transactions with related parties<br />
<strong>IMMOEAST</strong> is a subsidiary of IMMOFINANZ AG, which holds 50.46% of the shares and voting rights.<br />
Constantia Privatbank Aktiengesellschaft (CPB) as well as its corporate bodies and subsidiaries are considered related<br />
parties in the sense of IAS 24. The following subsidiaries of CPB are classified as related parties in accordance<br />
with the provisions of IAS 24: CPB Immobilientreuhand GmbH, IMV Immobilien Management und Verwaltung GmbH,<br />
Immoeast Corporate Finance Consulting GmbH, CPB Corporate Finance Consulting GmbH and its subsidiaries.<br />
8.4.1 Constantia Privatbank Aktiengesellschaft<br />
8.4.1.1 Management contracts<br />
Constantia Privatbank Aktiengesellschaft and <strong>IMMOEAST</strong> have concluded a management contract.<br />
This management contract obliges Constantia Privatbank to provide the following services to <strong>IMMOEAST</strong> and its<br />
subsidiaries:<br />
• Provision of corporate bodies and proxies,<br />
• Support for corporate bodies in connection with the annual general meetings,<br />
• Controlling, financial and accounting services (including the preparation of quarterly and annual reports, financial<br />
planning, treasury and group financing),<br />
• Selection of properties (feasibility studies, acquisition and sale negotiations),<br />
• Asset management (representation of owner interests, management of maintenance, contact office for brokers<br />
etc.) and<br />
• Provision of infrastructure.<br />
The management contracts do not cover following services:<br />
• Broker services,<br />
• Property management,<br />
• Consulting that can only be provided by specific professional groups,<br />
• Market-making,<br />
• Consulting in connection with capital increases and<br />
• Banking services.<br />
Payment for the calendar year was set at 1% of new investments and commissioned projects plus 0.60% of properties<br />
owned by <strong>IMMOEAST</strong> at the beginning of the year. This second component is linked to the consumer price<br />
index. The same principles apply to financial instruments held by <strong>IMMOEAST</strong> that are classified as investments in<br />
other companies, whereby there is no 1% fee and the paid commitment forms the basis for calculation. In <strong>2006</strong>/<strong>07</strong><br />
Constantia Privatbank Aktiengesellschaft charged administrative fees of TEUR 47,163.6 (2005/06: TEUR 15,544.2)<br />
to <strong>IMMOEAST</strong>.<br />
Furthermore, the Constantia Privatbank Group and IMMOFINANZ AG carry out investment and service transactions<br />
at arm’s length.<br />
8.4.1.2 Other services<br />
Constantia Privatbank Aktiengesellschaft also provides other banking services for <strong>IMMOEAST</strong>. The most important<br />
services are related to the securities issued by company. The fees for these services totalled TEUR 53,931.7<br />
in <strong>2006</strong>/<strong>07</strong> (2005/06: TEUR 27,366.9) for the part of the <strong>IMMOEAST</strong> capital increase that was not subscribed by<br />
IMMOFINANZ AG.<br />
Notes<br />
<strong>Report</strong> by the Executive Board 231<br />
Highlights <strong>2006</strong>/<strong>07</strong><br />
Business Model and Strategy<br />
Portfolio Structure<br />
Corporate Governance and Outlook<br />
Property Portfolio<br />
Development of Business<br />
Consolidated Financial Statements<br />
Service and Glossary<br />
IAS 1.126c
232 <strong>IMMOEAST</strong> <strong>Annual</strong> <strong>Report</strong> <strong>2006</strong>/<strong>07</strong><br />
Constantia Privatbank serves as the primary commercial bank for the majority of the Austrian subsidiaries and a number<br />
of the foreign subsidiaries. Normal market rates and interest rates are charged for these account management<br />
services. The interest rate on credit balances was 3.61% as of 28 April 20<strong>07</strong> (28 April <strong>2006</strong>: 2.37%) and the interest<br />
rate on debit balances was 4.36% as of this date (28 April <strong>2006</strong>: 3.17%).<br />
8.4.2 Immofinanz Corporate Finance Consulting GmbH<br />
Immofinanz Corporate Finance Consulting GmbH serves as a trust company for group financing. The contract partners<br />
are <strong>IMMOEAST</strong> as well as the majority of companies included under full or proportionate consolidation. For these services,<br />
Immofinanz Corporate Finance Consulting GmbH receives fees totalling TEUR 10 per calendar year (2005/06:<br />
TEUR 10).<br />
8.4.3 Immoeast Corporate Finance Consulting GmbH<br />
Immoeast Corporate Finance Consulting GmbH provides the majority of management resources for <strong>IMMOEAST</strong> in<br />
accordance with the management contract concluded with Constantia Privatbank AG. In addition, Immoeast Corporate<br />
Finance Consulting GmbH provided brokerage services for TEUR 0 in <strong>2006</strong>/<strong>07</strong> (2005/06: TEUR 2,321.1).<br />
Furthermore, cash outlays by Immoeast Corporate Finance Consulting GmbH of TEUR 0 were reimbursed in <strong>2006</strong>/<strong>07</strong><br />
(2005/06: TEUR 7.1).<br />
8.4.4 CPB Corporate Finance Consulting GmbH<br />
CPB Corporate Finance Consulting GmbH provided brokerage services in connection with the acquisition of companies<br />
for fees totalling TEUR 6,825.0 (2005/06: TEUR 4,696.4).<br />
8.4.5 IMV Immobilien Management und Verwaltung GmbH<br />
IMV Immobilien Management und Verwaltung GmbH is the largest property management company in Austria and<br />
– together with its subsidiaries in Hungary, the Czech Republic, Poland, Slovakia and Romania – provides property<br />
management services for the majority of <strong>IMMOEAST</strong> objects. These companies handle the invoices for subsidiary<br />
operating costs and receive no additional fees from <strong>IMMOEAST</strong>.<br />
8.4.6 CPB Immobilientreuhand GmbH<br />
CPB Immobilientreuhand GmbH and its subsidiaries in Hungary, the Czech Republic and Poland provide broker services<br />
at arm’s length for the rental of properties. The charges to <strong>IMMOEAST</strong> for broker services in <strong>2006</strong>/<strong>07</strong> comprise<br />
TEUR 41.1 from CPB Praha, TEUR 22.4 from CPB Polska and TEUR 609.3 from CPB Hungaria (2005/06: TEUR 1,221.8).<br />
8.4.7 CPB Management Czech Republic s.r.o.<br />
CPB Management Czech Republic s.r.o. has rented 261.19 sqm of office space from VALDEK Praha s.r.o. for TEUR 43.9<br />
per year.
8.4.8 Remuneration of corporate bodies<br />
The members of the Executive Board receive no separate<br />
remuneration from the company. The remuneration for<br />
the members of the Supervisory Board is as follows:<br />
The members of the Executive Board and Supervisory<br />
Board hold 244,143 shares of stock. There are no options<br />
outstanding on <strong>IMMOEAST</strong> shares.<br />
8.4.8 Trust loan<br />
The internal financing for the <strong>IMMOEAST</strong> subsidiaries is handled in part by IMMOFINANZ Corporate Finance Consulting<br />
GmbH at arm’s length interest rate conditions. In addition, the IMMOFINANZ Group provided financing of<br />
TEUR 993,142.2 at arm’s length conditions.<br />
8.4.9 Constantia Immobilien Development GmbH<br />
<strong>IMMOEAST</strong> granted a loan of TEUR 10,000.0 to Constantia Immobilien Development GmbH during the reporting year.<br />
The interest rate equals 8% and the term is unlimited. The outstanding amount as of the balance sheet date, including<br />
interest, was TEUR 6,898.7.<br />
8.5 Subsequent events<br />
All amounts in TEUR <strong>2006</strong>/<strong>07</strong> 2005/06<br />
Helmut Schwager 30.0 30.0<br />
Wolfgang Reithofer 22.5 22.5<br />
Erhard Schaschl 15.0 15.0<br />
Christian Böhm 15.0 15.0<br />
Herbert Kofler 15.0 15.0<br />
Total 97.5 97.5<br />
8.5.1 Capital transactions<br />
<strong>IMMOEAST</strong> carried out another largest capital increase in May 20<strong>07</strong>, which involved the issue of 277,941,375 shares<br />
of bearer stock at a price of EUR 10.20 per share. IMMOFINANZ AG subscribed to 50.46% of this issue and thereby<br />
retained its holding as of 30 April 20<strong>07</strong>.<br />
8.5.2 Acquisitions<br />
Romania<br />
After the balance sheet date <strong>IMMOEAST</strong> acquired a 75% stake in Harborside Hotel s.r.l. This project involves the<br />
development and construction of an annex to the Harborside Constanta Phase 1, with a further 15,600 sqm of retail<br />
space and a hotel tower with 12,100 sqm of space. <strong>IMMOEAST</strong> will initially hold 75% of the shares, and the remaining<br />
25% will be owned by the project developer and site owners. Plans call for <strong>IMMOEAST</strong> to acquire this minority stake<br />
after the project is completed.<br />
Development also started on the Baia Mare Mall in the north-western region of Romania after 30 April 20<strong>07</strong>. This<br />
project represents a shopping and entertainment centre with approx. 43.000 sqm of space on two levels. The start<br />
of construction is scheduled for the fourth quarter of 20<strong>07</strong> and completion is expected during the fourth quarter of<br />
2008. This development project will be realised through a cooperation between <strong>IMMOEAST</strong> and a large Hungarian<br />
property company at a total investment volume of EUR 97 million.<br />
<strong>IMMOEAST</strong> acquired 100% of the shares in S.C. Flash Consult Invest s.r.l. after the end of the <strong>2006</strong>/<strong>07</strong> financial year.<br />
This company is the owner of the Euromall Shopping Center in Pitesti, Romania, which has roughly 32,000 sqm of<br />
letable space. This facility was completed and opened in May 20<strong>07</strong>.<br />
Notes<br />
<strong>Report</strong> by the Executive Board 233<br />
Highlights <strong>2006</strong>/<strong>07</strong><br />
Business Model and Strategy<br />
Portfolio Structure<br />
Corporate Governance and Outlook<br />
Property Portfolio<br />
Development of Business<br />
Consolidated Financial Statements<br />
Service and Glossary
234 <strong>IMMOEAST</strong> <strong>Annual</strong> <strong>Report</strong> <strong>2006</strong>/<strong>07</strong><br />
A further investment on the Romanian market was the acquisition of the shares in S.C. Dacian Second s.r.l. This project<br />
involves the development of the Pantelimon Warehouse logistics centre with more than 50,000 sqm of letable<br />
space in the Romanian capital, and is under realisation together with the European Future Group.<br />
<strong>IMMOEAST</strong> also acquired a 75% stake in S.C. Red Project Two s.r.l. shortly after the balance sheet date. This company<br />
is developing a specialty shopping centre and shopping gallery with approx. 43,000 sqm of letable space and a corresponding<br />
parking facilities. The building permit should be granted at the end of 20<strong>07</strong> and construction is scheduled<br />
to start in spring 2008, with completion following roughly 18 months later.<br />
Through the acquisition of the Cypriote Gendana Ventures Ltd. in June 20<strong>07</strong>, <strong>IMMOEAST</strong> took over 100% of the shares<br />
in the Romanian Real Habitation s.r.l. This company owns a site adjoining the location for the IRIDE Business Park,<br />
which will be used for a 63,000 sqm expansion to this complex.<br />
In addition, <strong>IMMOEAST</strong> concluded a cooperation agreement with Eyemaxx for the development of a retail portfolio in<br />
Romania. This portfolio will comprise specialty shopping centres and shopping malls in mid-sized Romanian cities.<br />
Czech Republic<br />
On 3 May 20<strong>07</strong> <strong>IMMOEAST</strong> acquired a 5% stake in UTILITY PARK WEST s.r.o. This project will develop the Utility and<br />
Office Park West in Prague in four stages. The total investment is estimated at EUR 39 million, and <strong>IMMOEAST</strong> will<br />
provide mezzanine capital.<br />
Slovakia<br />
<strong>IMMOEAST</strong> acquired 10% of the shares in BIG BOX LEVICE s.r.o. and BIG BOX LIPTOVSKÝ MIKULÁŠ s.r.o. after the<br />
balance sheet date. Plans are in preparation for the construction of specialty shopping centres with approx. 5,500<br />
sqm of letable space as part of the Big Box Phase 2. <strong>IMMOEAST</strong> will purchase the remaining 90% of shares in these<br />
companies after the projects are completed and profitable rental contracts have been signed for at least 80% of the<br />
space.<br />
The Trencín and Nové Zámky locations opened in <strong>2006</strong>. The other specialty shopping centres are planned to open in<br />
autumn 20<strong>07</strong> and during 2008.
Group companies of <strong>IMMOEAST</strong> AG<br />
Nominal Initial<br />
Company Country Headquarters capital consolidation<br />
<strong>IMMOEAST</strong> AG A Vienna 555,882,750<br />
Mester Park Kft. H Budapest 626,000,000 HUF 75.00% 31.12.2000 1.11.<strong>2006</strong> V<br />
<strong>IMMOEAST</strong> Beteiligungs GmbH A Vienna 35,000 EUR 100.00% 22.8.2001 V<br />
European Property Group Ltd. BVI Tortula 133,902,000 CHF 25.00% 31.12.2001 E<br />
Arpad Center Kft. H Budapest 31,000,000 HUF 100.00% 1.8.2002 V<br />
Globe 13 Kft. H Budapest 50,000,000 HUF 100.00% 1.8.2002 V<br />
Mester Park Ost Bt. H Budapest 1,403,000,000 HUF 75.00% 31.12.2002 1.11.<strong>2006</strong> V<br />
S+B CEE Beteiligungsverwaltungs GmbH A Vienna 35,000 EUR 50.00% 1.1.2003 Q<br />
SBF Development Praha spol.s.r.o. CZ Prague 30,600,000 CZK 100.00% 1.1.2003 31.10.2005 V<br />
ODP Office Development Praha spol.s.r.o. CZ Prague 10,700,000 CZK 100.00% 1.1.2003 21.7.2005 V<br />
WEGE spol.s.r.o. CZ Prague 100,000 CZK 100.00% 1.1.2003 21.7.2005 V<br />
S B Praha 4 spol.s.r.o. CZ Prague 26,532,000 CZK 100.00% 1.1.2003 21.7.2005 V<br />
RHP Development spol.s.r.o. CZ Prague 200,000 CZK 50.00% 8.1.2003 Q<br />
VALDEK Praha spol.s.r.o. CZ Prague 100,000 CZK 100.00% 16.10.2003 21.7.2005<br />
and 1.11.2005 V<br />
IMMOFINANZ Hungária Harmadik Kft. H Budapest 3,000,000 HUF 100.00% 20.2.2004 V<br />
Lentia Real (1) Kft. H Budapest 227,000,000 HUF 100.00% 24.2.2004 V<br />
Immofinanz Polska Sp. z o.o. PL Warsaw 50,000 PLN 100.00% 31.3.2004 V<br />
ATLAS 2001 CR s.r.o. CZ Prague 200,000 CZK 100.00% 20.4.2004 V<br />
I-E Immoeast Real Estate GmbH A Vienna 35,000 EUR 100.00% 30.4.2004 V<br />
IRIDE S.A. RO Bucharest 16,683,215 RON 100.00% 13.5.2004 V<br />
KIP Development spol.s.r.o. CZ Prague 200,000 CZK 50.00% 20.5.2004 Q<br />
West Gate Üzleti Park Fejlesztö Kft. H Budapest 3,180,000 HUF 100.00% 2.7.2004 V<br />
Globe 3 Ingatlanfejlesztö Kft. H Budapest 561,000,000 HUF 100.00% 13.7.2004 V<br />
S+B CEE ACP Cyprus Ltd. CY Nicosia 1,000 CYP 50.00% 1.8.2004 Q<br />
Szepvölgyi Business Park Kft. H Budapest 601,000,000 HUF 100.00% 5.8.2004 V<br />
Gordon Invest Kft. H Budapest 583,000,000 HUF 100.00% 6.8.2004 V<br />
AC Parc Invest s.r.l. RO Bucharest 4,000,000 RON 50.00% 16.8.2004 Q<br />
I-E-H Immoeast Holding GmbH A Vienna 35,000 EUR 100.00% 18.9.2004 V<br />
<strong>IMMOEAST</strong> Silesia Holding Ltd. CY Nicosia 1,000 CYP 100.00% 29.10.2004 V<br />
Zitna Building s.r.o. CZ Prague 7,000,000 CZK 100.00% 24.11.2004 V<br />
ABLO Property s.r.o. CZ Prague 100,000 CZK 100.00% 3.12.2004 1.6.2005 V<br />
ARE 4 Sp. z o.o. PL Warsaw 50,000 PLN 100.00% 7.12.2004 4.5.<strong>2006</strong> V<br />
Central Bud Sp. z o. o. PL Warsaw 50,000 PLN 100.00% 9.12.2004 4.5.<strong>2006</strong> V<br />
IO-1 Building Sp. z o.o. PL Warsaw 50,000 PLN 100.00% 9.12.2004 V<br />
Global Trust s.r.l. RO Bucharest 2,030 RON 100.00% 1.1.2005 V<br />
Atom Centrum a.s. CZ Prague 1,000,000 CZK 100.00% 20.1.2005 27.6.<strong>2006</strong> V<br />
ImmoPoland Sp. z o.o. PL Warsaw 50,000 PLN 100.00% 20.1.2005 V<br />
Immoeast Real Estate Holding Ltd. CY Nicosia 1,000 CYP 100.00% 31.1.2005 V<br />
ARE 3 Sp. z o.o. PL Warsaw 50,000 PLN 100.00% 31.1.2005 4.5.<strong>2006</strong> V<br />
ImmoPoland Residential I Sp. z o.o. PL Warsaw 50,000 PLN 47.50% 3.2.2005 Q<br />
I-E-H Holding GmbH A Vienna 35,000 EUR 100.00% 15.2.2005 V<br />
IMAK CEE B.V. NL Amsterdam 45,000 EUR 100.00% 18.2.2005 4.5.<strong>2006</strong> V<br />
ProEast Holding GmbH A Vienna 35,000 EUR 100.00% 16.4.2005 V<br />
<strong>IMMOEAST</strong> Acquisition & Management GmbH A Vienna 35,000 EUR 100.00% 21.4.2005 V<br />
UKS GmbH A Vienna 35,000 EUR 100.00% 30.4.2005 4.5.<strong>2006</strong> V<br />
SAS Inter Kft. H Budapest 258,690,000 HUF 100.00% 30.4.2005 4.5.<strong>2006</strong> V<br />
Currency<br />
Group companies<br />
Stake<br />
<strong>Report</strong> by the Executive Board 235<br />
Highlights <strong>2006</strong>/<strong>07</strong><br />
Business Model and Strategy<br />
Portfolio Structure<br />
Corporate Governance and Outlook<br />
Property Portfolio<br />
Development of Business<br />
Consolidated Financial Statements<br />
Service and Glossary<br />
Transition consolidation<br />
increase in investment or<br />
structural change<br />
Type of consolidation
236 <strong>IMMOEAST</strong> <strong>Annual</strong> <strong>Report</strong> <strong>2006</strong>/<strong>07</strong><br />
Nominal Initial<br />
Company Country Headquarters capital consolidation<br />
Transition consolidation<br />
increase in investment or<br />
structural change<br />
UKS Finance Kft. H Budapest 3,000,000 HUF 100.00% 30.4.2005 4.5.<strong>2006</strong> V<br />
IMAK Finance B.V. NL Amsterdam 18,000 EUR 100.00% 30.4.2005 4.5.<strong>2006</strong> V<br />
ARE 1 Sp. z o.o. PL Warsaw 50,000 PLN 100.00% 30.4.2005 4.5.<strong>2006</strong> V<br />
ARE 2 Sp. z o.o. PL Warsaw 50,000 PLN 100.00% 30.4.2005 4.5.<strong>2006</strong> V<br />
ARE 5 Sp. z o.o. PL Warsaw 50,000 PLN 100.00% 30.4.2005 4.5.<strong>2006</strong> V<br />
ARE 7 Sp. z o.o. PL Warsaw 50,000 PLN 100.00% 30.4.2005 4.5.<strong>2006</strong> V<br />
Flex Invest Sp. z o.o. PL Warsaw 51,000 PLN 100.00% 30.4.2005 4.5.<strong>2006</strong> V<br />
Secure Bud Sp. z o.o. PL Warsaw 50,000 PLN 100.00% 30.4.2005 4.5.<strong>2006</strong> V<br />
Al Sp. z o.o. PL Warsaw 50,000 PLN 100.00% 30.4.2005 4.5.<strong>2006</strong> V<br />
Atlantis Invest Sp. z o.o. PL Warsaw 51,000 PLN 100.00% 30.4.2005 4.5.<strong>2006</strong> V<br />
Ol Sp. z o.o. PL Warsaw 50,000 PLN 100.00% 30.4.2005 4.5.<strong>2006</strong> V<br />
Omega Invest Sp. z o.o. PL Warsaw 50,000 PLN 100.00% 30.4.2005 4.5.<strong>2006</strong> V<br />
Centrum Olympia Olomuc a.s. CZ Prague 103,000,000 CZK 45.00% 10.5.2005 Q<br />
Harborside Imobiliara s.r.l. RO Bucharest 1,000 RON 75.00% 11.5.2005 V<br />
OÜ Robbins EST Tallinn 2,556 EEK 45.00% 27.5.2005 Q<br />
Stop.Shop Holding GmbH A Vienna 35,000 EUR 100.00% 31.5.2005 V<br />
<strong>IMMOEAST</strong> Projekt Alpha Holding GmbH A Vienna 35,000 EUR 100.00% 31.5.2005 V<br />
Center Invest Kft. H Budapest 3,000,000 HUF 100.00% 2.6.2005 V<br />
<strong>IMMOEAST</strong> Projekt Beta Holding GmbH A Vienna 35,000 EUR 100.00% 4.6.2005 V<br />
ARE 8 Sp. z o.o. PL Warsaw 50,000 PLN 100.00% 15.6.2005 4.5.<strong>2006</strong> V<br />
ARE 9 Sp. z o.o. PL Warsaw 50,000 PLN 100.00% 15.6.2005 4.5.<strong>2006</strong> V<br />
<strong>IMMOEAST</strong> ALLEGRO Beteiligungs GmbH A Vienna 35,000 EUR 100.00% 28.6.2005 V<br />
Airport Property Development a.s. CZ Prague 1,000,000 CZK 100.00% 29.6.2005 V<br />
<strong>IMMOEAST</strong> Projekt Gamma Holding GmbH A Vienna 35,000 EUR 100.00% 2.7.2005 V<br />
<strong>IMMOEAST</strong> Projekt Delta Holding GmbH A Vienna 35,000 EUR 100.00% 8.7.2005 V<br />
<strong>IMMOEAST</strong> Projekt Epsilon Holding GmbH A Vienna 35,000 EUR 100.00% 8.7.2005 V<br />
Netlu spol.s.r.o. CZ Prague 200,000 CZK 50.00% 13.7.2005 Q<br />
IA Holding 1 Kft. H Budapest 2,183,000,000 HUF 100.00% 13.7.2005 4.5.<strong>2006</strong> V<br />
<strong>IMMOEAST</strong> Slovakia s.r.o. SK Bratislava 200,000 SKK 100.00% 21.7.2005 V<br />
Cora GS s.r.l. RO Bucharest 300 RON 100.00% 25.7.2005 V<br />
NF 23 spol.s.r.o. CZ Prague 200,000 CZK 50.00% 10.8.2005 Q<br />
C.E.P.D. Kft. H Budapest 3,000,000 HUF 100.00% 31.8.2005 4.5.<strong>2006</strong> V<br />
Optima A Kft. H Budapest 3,000,000 HUF 100.00% 1.9.2005 V<br />
Akvamarin Beta s.r.o. CZ Prague 200,000 CZK 100.00% 30.9.2005 V<br />
Pipera Office Project Ltd. CY Nicosia 1,000 CYP 50.00% 21.10.2005 Q<br />
PBT Invest s.r.l. RO Bucharest 400 RON 50.00% 21.10.2005 Q<br />
DH Logistik Kft. H Budapest 3,000,000 HUF 100.00% 1.11.2005 V<br />
Multi-ImmoEast Asset Management GmbH D Munich 25,000 EUR 45.00% 3.11.2005 Q<br />
A-I Investments Management Europe GmbH D Munich 25,000 EUR 50.00% 3.11.2005 Q<br />
Shark Park Holding Kft. H Budapest 2,320,000,000 HUF 100.00% 8.11.2005 4.5.<strong>2006</strong> V<br />
Euro Businesspark Kft. H Budapest 372,970,000 HUF 100.00% 14.11.2005 4.5.<strong>2006</strong> V<br />
<strong>IMMOEAST</strong> Projekt Lambda Holding GmbH A Vienna 35,000 EUR 100.00% 16.11.2005 V<br />
PERL INVEST a.s. CZ Prague 2,000,000 CZK 50.00% 9.12.2005 Q<br />
NP Investment a.s. CZ Prague 2,000,000 CZK 50.00% 9.12.2005 Q<br />
Prokopova Development a.s. CZ Prague 2,000,000 CZK 50.00% 9.12.2005 Q<br />
E.N.G. Property a.s. CZ Prague 2,000,000 CZK 50.00% 9.12.2005 Q<br />
JUNGMANNOVA ESTATES a.s. CZ Prague 2,000,000 CZK 50.00% 9.12.2005 Q<br />
Stetkova Property Invest a.s. CZ Prague 2,000,000 CZK 50.00% 9.12.2005 Q<br />
Currency<br />
Stake<br />
Type of consolidation
Nominal Initial<br />
Company Country Headquarters capital consolidation<br />
J.H. Prague a.s. CZ Prague 2,000,000 CZK 50.00% 9.12.2005 Q<br />
PAN Development a.s. CZ Prague 2,000,000 CZK 50.00% 9.12.2005 Q<br />
<strong>IMMOEAST</strong> Projekt Kappa Holding GmbH A Vienna 35,000 EUR 100.00% 20.12.2005 V<br />
<strong>IMMOEAST</strong> Projekt Jota Holding GmbH A Vienna 35,000 EUR 100.00% 20.12.2005 V<br />
<strong>IMMOEAST</strong> HRE Investment jeden Sp. z o.o. PL Warsaw 50,000 PLN 100.00% 28.12.2005 V<br />
<strong>IMMOEAST</strong> HRE Investment dwa Sp. z o.o. PL Warsaw 50,000 PLN 100.00% 28.12.2005 V<br />
<strong>IMMOEAST</strong> HRE Investment trzy Sp. z o.o. PL Warsaw 50,000 PLN 100.00% 28.12.2005 V<br />
<strong>IMMOEAST</strong> HRE Investment cztery Sp. z o.o. PL Warsaw 50,000 PLN 100.00% 28.12.2005 V<br />
<strong>IMMOEAST</strong> HRE Investment piec Sp. z o.o. PL Warsaw 50,000 PLN 100.00% 28.12.2005 V<br />
<strong>IMMOEAST</strong> Projekt Investment jeden Sp.z o.o. PL Warsaw 50,000 PLN 100.00% 28.12.2005 V<br />
Nowe Centrum Sp. z o.o. PL Katowice 63,636,000 PLN 100.00% 31.12.2005 V<br />
ELCO Sp. z o.o. PL Katowice 50,000 PLN 100.00% 31.12.2005 V<br />
Polus Tower 2 a.s. SK Bratislava 75,213,900 SKK 100.00% 31.12.2005 V<br />
Polus Tower 3 a.s. SK Bratislava 13,100,000 SKK 100.00% 31.12.2005 V<br />
Polus a.s. SK Bratislava 222,767,000 SKK 100.00% 31.12.2005 V<br />
BA Energetika s.r.o. SK Bratislava 200,000 SKK 100.00% 31.12.2005 V<br />
<strong>IMMOEAST</strong> Projekt Sita Holding GmbH A Vienna 35,000 EUR 100.00% 4.1.<strong>2006</strong> V<br />
Stavební a inzenýrská spol.s.r.o. CZ Prague 270,000 CZK 50.00% 4.1.<strong>2006</strong> Q<br />
<strong>IMMOEAST</strong> Projekt Omega Holding GmbH<br />
Multi-ImmoEast Central European<br />
A Vienna 35,000 EUR 100.00% 5.1.<strong>2006</strong> V<br />
Property Fund C.V. LU Luxembourg EUR 45.00% 24.1.<strong>2006</strong> Q<br />
<strong>IMMOEAST</strong> Projekt Aries Holding GmbH A Vienna 35,000 EUR 100.00% 31.1.<strong>2006</strong> V<br />
Blizzard Real Sp. z o.o. PL Warsaw 50,000 PLN 100.00% 31.1.<strong>2006</strong> V<br />
Capri Trade s.r.l. RO Bucharest 200 RON 100.00% 10.2.<strong>2006</strong> V<br />
<strong>IMMOEAST</strong> Projekt Capricornus Holding GmbH A Vienna 35,000 EUR 100.00% 17.2.<strong>2006</strong> V<br />
<strong>IMMOEAST</strong> Projekt Caelum Holding GmbH A Vienna 35,000 EUR 80.00% 17.2.<strong>2006</strong> V<br />
<strong>IMMOEAST</strong> Projekt Cassiopeia Holding GmbH A Vienna 35,000 EUR 100.00% 9.3.<strong>2006</strong> V<br />
<strong>IMMOEAST</strong> Projekt Cepheus Holding GmbH A Vienna 35,000 EUR 100.00% 9.3.<strong>2006</strong> V<br />
<strong>IMMOEAST</strong> Projekt Circinus Holding GmbH A Vienna 35,000 EUR 100.00% 9.3.<strong>2006</strong> V<br />
S+B CEE ALPHA CYPRUS Ltd. CY Nicosia 10,000 CYP 50.00% 10.3.<strong>2006</strong> Q<br />
MY BOX Uherske Hradiste s.r.o. CZ Prague 200,000 CZK 50.50% 10.3.<strong>2006</strong> Q<br />
Bucharest Corporate Center s.r.l. RO Bucharest 8,068,929 RON 100.00% 22.3.<strong>2006</strong> V<br />
Multi-<strong>IMMOEAST</strong> Master Luxembourg Otarfi s.r.l. LU Luxembourg EUR 45.00% 24.3.<strong>2006</strong> Q<br />
Holtera Property a.s. CZ Prague 2,000,000 CZK 45.00% 30.3.<strong>2006</strong> Q<br />
VALUEROI GRUP s.r.l. RO Bucharest 37,000 RON 75.00% 30.3.<strong>2006</strong> V<br />
<strong>IMMOEAST</strong> Presto Beteiligungs GmbH A Vienna 35,000 EUR 100.00% 31.3.<strong>2006</strong> V<br />
Prague Office Park I s.r.o. CZ Prague 38,600,000 CZK 100.00% 5.4.<strong>2006</strong> V<br />
<strong>IMMOEAST</strong> Projekt Idamantes Holding GmbH A Vienna 35,000 EUR 100.00% 8.4.<strong>2006</strong> V<br />
<strong>IMMOEAST</strong> Projekt Zerlina Holding GmbH A Vienna 35,000 EUR 100.00% 8.4.<strong>2006</strong> V<br />
<strong>IMMOEAST</strong> Projekt Dorabella Holding GmbH A Vienna 35,000 EUR 100.00% 8.4.<strong>2006</strong> V<br />
<strong>IMMOEAST</strong> Projekt Arbaces Holding GmbH A Vienna 35,000 EUR 100.00% 11.4.<strong>2006</strong> V<br />
<strong>IMMOEAST</strong> Projekt Masetto Holding GmbH A Vienna 35,000 EUR 100.00% 11.4.<strong>2006</strong> V<br />
<strong>IMMOEAST</strong> Projekt Equuleus Holding GmbH A Vienna 35,000 EUR 100.00% 12.4.<strong>2006</strong> V<br />
<strong>IMMOEAST</strong> Projekt Eridanus Holding GmbH A Vienna 35,000 EUR 100.00% 12.4.<strong>2006</strong> V<br />
<strong>IMMOEAST</strong> Projekt Cygnus Holding GmbH A Vienna 35,000 EUR 100.00% 13.4.<strong>2006</strong> V<br />
<strong>IMMOEAST</strong> Projekt Hydrus Holding GmbH A Vienna 35,000 EUR 100.00% 13.4.<strong>2006</strong> V<br />
<strong>IMMOEAST</strong> Projekt Ducentesimus Holding GmbH A Vienna 35,000 EUR 100.00% 13.4.<strong>2006</strong> V<br />
<strong>IMMOEAST</strong> Projekt Secundus Holding GmbH A Vienna 35,000 EUR 100.00% 13.4.<strong>2006</strong> V<br />
Currency<br />
Group companies<br />
Stake<br />
<strong>Report</strong> by the Executive Board 237<br />
Highlights <strong>2006</strong>/<strong>07</strong><br />
Business Model and Strategy<br />
Portfolio Structure<br />
Corporate Governance and Outlook<br />
Property Portfolio<br />
Development of Business<br />
Consolidated Financial Statements<br />
Service and Glossary<br />
Transition consolidation<br />
increase in investment or<br />
structural change<br />
Type of consolidation
238 <strong>IMMOEAST</strong> <strong>Annual</strong> <strong>Report</strong> <strong>2006</strong>/<strong>07</strong><br />
Nominal Initial<br />
Company Country Headquarters capital consolidation<br />
Transition consolidation<br />
increase in investment or<br />
structural change<br />
<strong>IMMOEAST</strong> Projekt Tertius Holding GmbH A Vienna 35,000 EUR 100.00% 13.4.<strong>2006</strong> V<br />
<strong>IMMOEAST</strong> Projekt Quartus Holding GmbH A Vienna 35,000 EUR 100.00% 13.4.<strong>2006</strong> V<br />
<strong>IMMOEAST</strong> Projekt Trecenti Holding GmbH A Vienna 35,000 EUR 100.00% 13.4.<strong>2006</strong> V<br />
<strong>IMMOEAST</strong> Projekt Sextus Holding GmbH A Vienna 35,000 EUR 100.00% 13.4.<strong>2006</strong> V<br />
<strong>IMMOEAST</strong> Projekt Septimus Holding GmbH A Vienna 35,000 EUR 100.00% 13.4.<strong>2006</strong> V<br />
<strong>IMMOEAST</strong> Projekt Octavus Holding GmbH A Vienna 35,000 EUR 100.00% 13.4.<strong>2006</strong> V<br />
<strong>IMMOEAST</strong> Projekt Nonus Holding GmbH A Vienna 35,000 EUR 100.00% 13.4.<strong>2006</strong> V<br />
<strong>IMMOEAST</strong> Projekt Decimus Holding GmbH A Vienna 35,000 EUR 100.00% 13.4.<strong>2006</strong> V<br />
<strong>IMMOEAST</strong> Projekt Duodecimus Holding GmbH A Vienna 35,000 EUR 100.00% 13.4.<strong>2006</strong> V<br />
<strong>IMMOEAST</strong> Bulgaria 1 EOOD BG Sofia 5,000 BGN 100.00% 17.4.<strong>2006</strong> V<br />
MY BOX Strakonice s.r.o. CZ Prague 200,000 CZK 50.50% 30.5.<strong>2006</strong> 15.12.<strong>2006</strong> Q<br />
STOP.SHOP. TB Kft. H Budapest 1,530,000 HUF 51.00% 8.6.<strong>2006</strong> Q<br />
STOP.SHOP. Gyöngy Kft. H Budapest 1,530,000 HUF 51.00% 8.6.<strong>2006</strong> Q<br />
STOP.SHOP. BCS Kft. H Budapest 1,530,000 HUF 51.00% 8.6.<strong>2006</strong> Q<br />
Immoeast Dunaj s.r.o. SK Bratislava 200,000 SKK 100.00% 14.6.<strong>2006</strong> V<br />
TriGránit Centrum a.s. SK Bratislava 1,000,000 SKK 25.00% 19.6.<strong>2006</strong> E<br />
<strong>IMMOEAST</strong> Projekt Tredecimus Holding GmbH A Vienna 35,000 EUR 100.00% 21.6.<strong>2006</strong> V<br />
<strong>IMMOEAST</strong> Projekt Quindecimus Holding GmbH A Vienna 35,000 EUR 100.00% 21.6.<strong>2006</strong> V<br />
<strong>IMMOEAST</strong> Projekt Septendecimus Holding GmbH A Vienna 35,000 EUR 100.00% 21.6.<strong>2006</strong> V<br />
<strong>IMMOEAST</strong> Projekt Quadragesimus Holding GmbH A Vienna 35,000 EUR 100.00% 21.6.<strong>2006</strong> V<br />
<strong>IMMOEAST</strong> Projekt Vicesimus Holding GmbH A Vienna 35,000 EUR 100.00% 21.6.<strong>2006</strong> V<br />
<strong>IMMOEAST</strong> Projekt Sexagesimus Holding GmbH A Vienna 35,000 EUR 100.00% 21.6.<strong>2006</strong> V<br />
<strong>IMMOEAST</strong> Projekt Octogesimus Holding GmbH A Vienna 35,000 EUR 100.00% 21.6.<strong>2006</strong> V<br />
<strong>IMMOEAST</strong> Projekt Nonagesimus Holding GmbH A Vienna 35,000 EUR 100.00% 21.6.<strong>2006</strong> V<br />
<strong>IMMOEAST</strong> Projekt Centesimus Holding GmbH A Vienna 35,000 EUR 100.00% 21.6.<strong>2006</strong> V<br />
Wakelin Promotions Limited CY Nicosia 59,327 RUB 100.00% 21.6.<strong>2006</strong> V<br />
Krona Design LLC RU Moscow 8,000,000 RUB 100.00% 21.6.<strong>2006</strong> V<br />
Koral Residence EAD BG Sofia 400,000 BGN 100.00% 23.6.<strong>2006</strong> V<br />
Aragonit s.r.o. CZ Prague 100,000 CZK 100.00% 1.7.<strong>2006</strong> V<br />
S.C. Almera New Capital s.r.l. RO Bucharest 200 RON 50.00% 13.7.<strong>2006</strong> 1.2.20<strong>07</strong> Q<br />
S.C. Meteo Business Park s.r.l. RO Bucharest 1,000 RON 89.00% 27.7.<strong>2006</strong> Q<br />
S.C. Stupul de Albine s.r.l. RO Bucharest 1,000 RON 89.00% 27.7.<strong>2006</strong> Q<br />
TriGránit Holding Ltd. CY Nicosia 150,000 CYP 25.00% 31.7.<strong>2006</strong> E<br />
Salzburg Center Development S.A PL Warsaw 3,650,000 PLN 100.00% 31.7.<strong>2006</strong> V<br />
<strong>IMMOEAST</strong> Projekt Babekan Holding GmbH A Vienna 35,000 EUR 100.00% 1.8.<strong>2006</strong> V<br />
<strong>IMMOEAST</strong> Projekt Despina Holding GmbH A Vienna 35,000 EUR 100.00% 1.8.<strong>2006</strong> V<br />
<strong>IMMOEAST</strong> Projekt Curzio Holding GmbH A Vienna 35,000 EUR 100.00% 1.8.<strong>2006</strong> V<br />
<strong>IMMOEAST</strong> Projekt Almaria Holding GmbH A Vienna 35,000 EUR 100.00% 1.8.<strong>2006</strong> V<br />
<strong>IMMOEAST</strong> Projekt Sarastro Holding GmbH A Vienna 35,000 EUR 100.00% 1.8.<strong>2006</strong> V<br />
<strong>IMMOEAST</strong> Projekt Barbarina Holding GmbH A Vienna 35,000 EUR 100.00% 1.8.<strong>2006</strong> V<br />
<strong>IMMOEAST</strong> Projekt Cherubino Holding GmbH A Vienna 35,000 EUR 100.00% 1.8.<strong>2006</strong> V<br />
<strong>IMMOEAST</strong> Projekt Marcellina Holding GmbH A Vienna 35,000 EUR 100.00% 1.8.<strong>2006</strong> V<br />
<strong>IMMOEAST</strong> Projekt Cimarosa Holding GmbH A Vienna 35,000 EUR 100.00% 1.8.<strong>2006</strong> V<br />
<strong>IMMOEAST</strong> Projekt Fenena Holding GmbH A Vienna 35,000 EUR 100.00% 1.8.<strong>2006</strong> V<br />
<strong>IMMOEAST</strong> Projekt Almansor Holding GmbH A Vienna 35,000 EUR 100.00% 1.8.<strong>2006</strong> V<br />
<strong>IMMOEAST</strong> Projekt Roschana Holding GmbH A Vienna 35,000 EUR 100.00% 1.8.<strong>2006</strong> V<br />
<strong>IMMOEAST</strong> Projekt Cinna Holding GmbH A Vienna 35,000 EUR 100.00% 1.8.<strong>2006</strong> V<br />
<strong>IMMOEAST</strong> Projekt Annius Holding GmbH A Vienna 35,000 EUR 100.00% 1.8.<strong>2006</strong> V<br />
Currency<br />
Stake<br />
Type of consolidation
Nominal Initial<br />
Company Country Headquarters capital consolidation<br />
<strong>IMMOEAST</strong> Projekt Semos Holding GmbH A Vienna 35,000 EUR 100.00% 1.8.<strong>2006</strong> V<br />
<strong>IMMOEAST</strong> Projekt Titurel Holding GmbH A Vienna 35,000 EUR 100.00% 1.8.<strong>2006</strong> V<br />
<strong>IMMOEAST</strong> Projekt Radames Holding GmbH A Vienna 35,000 EUR 100.00% 1.8.<strong>2006</strong> V<br />
<strong>IMMOEAST</strong> Projekt Montano Holding GmbH A Vienna 35,000 EUR 100.00% 1.8.<strong>2006</strong> V<br />
<strong>IMMOEAST</strong> Projekt Amfortas Holding GmbH A Vienna 35,000 EUR 100.00% 1.8.<strong>2006</strong> V<br />
<strong>IMMOEAST</strong> Projekt Abdallo Holding GmbH A Vienna 35,000 EUR 100.00% 1.8.<strong>2006</strong> V<br />
<strong>IMMOEAST</strong> Projekt Rezia Holding GmbH A Vienna 35,000 EUR 100.00% 1.8.<strong>2006</strong> V<br />
<strong>IMMOEAST</strong> Projekt Hüon Holding GmbH A Vienna 35,000 EUR 100.00% 1.8.<strong>2006</strong> V<br />
<strong>IMMOEAST</strong> Projekt Titania Holding GmbH A Vienna 35,000 EUR 100.00% 1.8.<strong>2006</strong> V<br />
<strong>IMMOEAST</strong> Projekt Andromache Holding GmbH A Vienna 35,000 EUR 100.00% 1.8.<strong>2006</strong> V<br />
<strong>IMMOEAST</strong> Projekt Polyxene Holding GmbH A Vienna 35,000 EUR 100.00% 1.8.<strong>2006</strong> V<br />
<strong>IMMOEAST</strong> Projekt Hylas Holding GmbH A Vienna 35,000 EUR 100.00% 1.8.<strong>2006</strong> V<br />
<strong>IMMOEAST</strong> Projekt Hekuba Holding GmbH A Vienna 35,000 EUR 100.00% 1.8.<strong>2006</strong> V<br />
<strong>IMMOEAST</strong> Projekt Pantheus Holding GmbH A Vienna 35,000 EUR 100.00% 1.8.<strong>2006</strong> V<br />
<strong>IMMOEAST</strong> Projekt Chorebe Holding GmbH A Vienna 35,000 EUR 100.00% 1.8.<strong>2006</strong> V<br />
<strong>IMMOEAST</strong> Projekt Narbal Holding GmbH A Vienna 35,000 EUR 100.00% 1.8.<strong>2006</strong> V<br />
Xantium Sp. z o.o. PL Warsaw 50,000 PLN 100.00% 4.8.<strong>2006</strong> V<br />
Klyos Media s.r.l. RO Bucharest 200 RON 90.00% 4.8.<strong>2006</strong> 1.3.20<strong>07</strong> V<br />
OCEAN ATLANTIC DORCOL DOO SRB Belgrade 48,510 CSD 80.00% 24.8.<strong>2006</strong> V<br />
Equator Real Sp. z o.o. PL Warsaw 50,000 PLN 51.00% 28.8.<strong>2006</strong> Q<br />
Zenith Real Sp. z o.o. PL Warsaw 50,000 PLN 51.00% 28.8.<strong>2006</strong> Q<br />
Nimbus Real Sp. z o.o. PL Warsaw 50,000 PLN 51.00% 28.8.<strong>2006</strong> Q<br />
Cirrus Real Sp. z o.o. PL Warsaw 50,000 PLN 51.00% 28.8.<strong>2006</strong> Q<br />
Nakupni Centrum Trebic s.r.o. CZ Znoimo 200,000 CZK 50.50% 30.8.<strong>2006</strong> Q<br />
<strong>IMMOEAST</strong> Polonia Sp. z o.o. PL Warsaw 50,000 PLN 100.00% 6.9.<strong>2006</strong> V<br />
<strong>IMMOEAST</strong> Projekt Moskau Holding GmbH A Vienna 35,000 EUR 100.00% 8.12.2004 V<br />
Nakupni Centrum AVENTIN Tabor s.r.o. CZ Znoimo 200,000 CZK 50.50% 18.9.<strong>2006</strong> Q<br />
Centrum Opatov a.s. CZ Prague 2,000,000 CZK 100.00% 22.9.<strong>2006</strong> V<br />
Alpha real d.o.o. SLO Ljubljana 8,763 EUR 100.00% 30.9.<strong>2006</strong> V<br />
Beta real d.o.o. SLO Ljubljana 8,763 EUR 100.00% 30.9.<strong>2006</strong> V<br />
Silesia Residential Holding Limited CY Nicosia 2,000 CYP 70.00% 9.10.<strong>2006</strong> Q<br />
<strong>IMMOEAST</strong> Despina III B.V. NL Amsterdam 18,000 EUR 100.00% 9.10.<strong>2006</strong> V<br />
<strong>IMMOEAST</strong> Despina II B.V. NL Amsterdam 18,000 EUR 100.00% 9.10.<strong>2006</strong> V<br />
<strong>IMMOEAST</strong> Despina V B.V. NL Amsterdam 31,765 EUR 100.00% 9.10.<strong>2006</strong> V<br />
<strong>IMMOEAST</strong> Despina IV B.V. NL Amsterdam 31,765 EUR 100.00% 9.10.<strong>2006</strong> V<br />
<strong>IMMOEAST</strong> Despina I B.V. NL Amsterdam 18,000 EUR 100.00% 9.10.<strong>2006</strong> V<br />
Silesia Residential Project Sp. z o.o. PL Katowice 9,321,000 PLN 70.00% 9.10.<strong>2006</strong> Q<br />
Veronia Shelf s.r.o. CZ Prague 200,000 CZK 51.00% 18.10.<strong>2006</strong> Q<br />
MY BOX Kolin s.r.o. CZ Prague 200,000 CZK 50.50% 27.10.<strong>2006</strong> Q<br />
Gangaw Investments Limited CY Nicosia 1,000 CYP 50.00% 30.10.<strong>2006</strong> Q<br />
OAO Kashirskij Dvor-Severyanin RU Moscow 500,000 RUB 50.00% 30.10.<strong>2006</strong> Q<br />
Diamant Real s.r.o. CZ Prague 100,000 CZK 51.00% 31.10.<strong>2006</strong> Q<br />
HEPP III Luxembourg MBP SARL LU Luxembourg 1,000,000 EUR 50.00% 1.11.<strong>2006</strong> Q<br />
MBP I Sp. z o.o. PL Warsaw 50,000 PLN 50.00% 1.11.<strong>2006</strong> Q<br />
MBP II Sp. z o.o. PL Warsaw 50,000 PLN 50.00% 1.11.<strong>2006</strong> Q<br />
HEPP III Sweden Finance AB SWE Stockholm 100,000 SEK 50.00% 1.11.<strong>2006</strong> Q<br />
WINNIPEGIA SHELF s.r.o. CZ Prague 200,000 CZK 100.00% 13.11.<strong>2006</strong> V<br />
BEWO International Kft. H Budapest 3,000,000 HUF 50.00% 14.11.<strong>2006</strong> Q<br />
Currency<br />
Group companies<br />
Stake<br />
<strong>Report</strong> by the Executive Board 239<br />
Highlights <strong>2006</strong>/<strong>07</strong><br />
Business Model and Strategy<br />
Portfolio Structure<br />
Corporate Governance and Outlook<br />
Property Portfolio<br />
Development of Business<br />
Consolidated Financial Statements<br />
Service and Glossary<br />
Transition consolidation<br />
increase in investment or<br />
structural change<br />
Type of consolidation
240 <strong>IMMOEAST</strong> <strong>Annual</strong> <strong>Report</strong> <strong>2006</strong>/<strong>07</strong><br />
Nominal Initial<br />
Company Country Headquarters capital consolidation<br />
Transition consolidation<br />
increase in investment or<br />
structural change<br />
MY BOX Rakovnik s.r.o. CZ Prague 200,000 CZK 50.00% 20.11.<strong>2006</strong> Q<br />
MY BOX Sokolov s.r.o. CZ Prague 200,000 CZK 50.00% 20.11.<strong>2006</strong> Q<br />
MY BOX Hranice s.r.o. CZ Prague 200,000 CZK 50.00% 20.11.<strong>2006</strong> Q<br />
Debowe Tarasy Sp. z o.o. PL Warsaw 50,000 PLN 70.00% 21.11.<strong>2006</strong> Q<br />
Grand Zagreb d.o.o. CRO Zagreb 20,000 HRK 80.00% 30.11.<strong>2006</strong> V<br />
Grand Centar d.o.o. CRO Zagreb 20,000 HRK 80.00% 30.11.<strong>2006</strong> V<br />
Trevima Ltd. CY Limassol 10,000 CYP 100.00% 30.11.<strong>2006</strong> V<br />
OOO Torgoviy Dom Na Khodinke RU Moscow 7,285 RUB 100.00% 30.11.<strong>2006</strong> V<br />
Business Park West-Sofia EAD BG Sofia 500,000 BGN 100.00% 12.12.<strong>2006</strong> V<br />
Blue Danube Holding Ltd. M Floriana 1,500 EUR 100.00% 12.12.<strong>2006</strong> V<br />
BB C - Building A, k.s. CZ Prague 20,000 CZK 100.00% 13.12.<strong>2006</strong> V<br />
BB C - Building B, k.s. CZ Prague 20,000 CZK 100.00% 13.12.<strong>2006</strong> V<br />
BB C - Building C, k.s. CZ Prague 90,000 CZK 100.00% 13.12.<strong>2006</strong> V<br />
Fobos Investment Sp. z o.o. PL Warsaw 50,000 PLN 50.00% 14.12.<strong>2006</strong> Q<br />
SC EFG Urban Achizitii s.r.l. RO Bucharest 1,000 RON 89.00% 14.12.<strong>2006</strong> V<br />
MY BOX Pribram s.r.o. CZ Prague 200,000 CZK 50.00% 15.12.<strong>2006</strong> Q<br />
SBACARO s.r.l. RO Cluj 4,000 RON 50.00% 15.12.<strong>2006</strong> Q<br />
Logistic Contractor s.r.l. RO Ilfov 200 RON 100.00% 18.12.<strong>2006</strong> V<br />
SCT s.r.o. SK Bratislava 52,916,000 SKK 100.00% 21.12.<strong>2006</strong> V<br />
FMZ TM s.r.l. RO Cluj 4,000 RON 50.00% 22.12.<strong>2006</strong> Q<br />
S+B CEE BETA CYPRUS LIMITED CY Nicosia 10,000 CYP 50.00% 29.12.<strong>2006</strong> Q<br />
S+B CEE GAMMA CYPRUS LIMITED CY Nicosia 10,000 CYP 50.00% 29.12.<strong>2006</strong> Q<br />
S+B CEE DELTA CYPRUS LIMITED CY Nicosia 10.000 CYP 50.00% 29.12.<strong>2006</strong> Q<br />
Debowe Tarasy Sp. z o.o. II sp.k. PL Katowice 1,860,239 PLN 70.00% 5.1.20<strong>07</strong> Q<br />
Debowe Tarasy Sp. z o.o. III sp.k. PL Katowice 1,861,085 PLN 70.00% 5.1.20<strong>07</strong> Q<br />
Debowe Tarasy Sp. z o.o. IV sp.k. PL Katowice 1,900,535 PLN 70.00% 5.1.20<strong>07</strong> Q<br />
Loberta Holdings Ltd. CY Nicosia 1,000 CYP 51.00% 10.1.20<strong>07</strong> 1.3.20<strong>07</strong> Q<br />
Roches Ventures Ltd. CY Nicosia 1,000 CYP 41.00% 10.1.20<strong>07</strong> 1.3.20<strong>07</strong> Q<br />
Alacor Construction LLC UA Kiev 50,000 UAH 41.00% 10.1.20<strong>07</strong> Q<br />
Alacor Scorta LLC UA Kiev 50,000 UAH 41.00% 10.1.20<strong>07</strong> Q<br />
Alacor City LLC UA Kiev 100,000 UAH 41.00% 10.1.20<strong>07</strong> Q<br />
Central Business Center Rt. H Budapest 172,042,584 HUF 100.00% 15.1.20<strong>07</strong> V<br />
S.C. Arbor Corporation s.r.l. RO Bucharest 13,500 RON 90.00% 29.1.20<strong>07</strong> V<br />
S.C. IE Baneasa Project s.r.l. RO Bucharest 200 RON 100.00% 1.2.20<strong>07</strong> V<br />
MY BOX Breclav s.r.o. CZ Prague 200,000 CZK 50.00% 12.2.20<strong>07</strong> Q<br />
MY BOX Jablonec nad Nisou s.r.o. CZ Prague 200,000 CZK 50.00% 12.2.20<strong>07</strong> Q<br />
Eye Shop Targu Jiu s.r.l. RO Bucharest 200 RON 50.00% 19.2.20<strong>07</strong> Q<br />
Log Center Ploiesti s.r.l. RO Bucharest 200 RON 50.00% 19.2.20<strong>07</strong> Q<br />
Log Center Brasov s.r.l. RO Bucharest 200 RON 50.00% 19.2.20<strong>07</strong> Q<br />
STOP.SHOP.Lucenec s.r.o. SK Bratislava 200,000 SKK 50.00% 19.2.20<strong>07</strong> Q<br />
STOP.SHOP.Ruzomberok s.r.o. SK Bratislava 200,000 SKK 50.00% 19.2.20<strong>07</strong> Q<br />
STOP.SHOP.Zvolen s.r.o. SK Bratislava 200,000 SKK 50.00% 19.2.20<strong>07</strong> Q<br />
Gordon Invest Netherlands B.V. NL Amsterdam 18,000 EUR 100.00% 22.2.20<strong>07</strong> V<br />
Centre Investments s.r.o. CZ Brno 100,000 CZK 100.00% 28.2.20<strong>07</strong> V<br />
Brno Estates a.s. CZ Brno 2,000,000 CZK 100.00% 28.2.20<strong>07</strong> V<br />
Delta Park a.s. CZ Prague 1,000,000 CZK 100.00% 1.3.20<strong>07</strong> V<br />
<strong>IMMOEAST</strong> Iride IV Project s.r.l. RO Bucharest 200 RON 100.00% 1.3.20<strong>07</strong> V<br />
BEWO d.o.o. Banja Luka BIH Banjaluka 2,000 BAM 50.00% 5.3.20<strong>07</strong> Q<br />
Currency<br />
Stake<br />
Type of consolidation
Nominal Initial<br />
Company Country Headquarters capital consolidation<br />
Currency<br />
Stake<br />
<strong>Report</strong> by the Executive Board 241<br />
Highlights <strong>2006</strong>/<strong>07</strong><br />
Business Model and Strategy<br />
Portfolio Structure<br />
Corporate Governance and Outlook<br />
Property Portfolio<br />
Development of Business<br />
Consolidated Financial Statements<br />
Service and Glossary<br />
Transition consolidation<br />
increase in investment or<br />
structural change<br />
Lasuvu Consultants Ltd. CY Nicosia 1,000 CYP 100.00% 6.3.20<strong>07</strong> V<br />
S.C. Union Investitii S.r.l. RO Bucharest 2,000 RON 25.00% 7.3.20<strong>07</strong> Q<br />
SCP s.r.o. SK Bratislava 200,000 SKK 50.00% 19.3.20<strong>07</strong> Q<br />
S.C. Valero Invest s.r.l. RO Bucharest 1,760,000 RON 100.00% 20.3.20<strong>07</strong> V<br />
Immoeast Luxembourg 1 SARL LU Luxembourg 12,500 EUR 100.00% 22.3.20<strong>07</strong> V<br />
Immoeast Luxembourg 2 SARL LU Luxembourg 12,500 EUR 100.00% 22.3.20<strong>07</strong> V<br />
Passat Real Sp. z o.o. PL Warsaw 50,000 PLN 100.00% 27.3.20<strong>07</strong> V<br />
Hekuba SARL LU Luxembourg 12,500 EUR 100.00% 28.3.20<strong>07</strong> V<br />
Log Center Iasi s.r.l. RO Bucharest 200 RON 50.00% 29.3.20<strong>07</strong> Q<br />
Eye Shop Hunedoara s.r.l. RO Bucharest 200 RON 50.00% 29.3.20<strong>07</strong> Q<br />
S.C. Baneasa 6981 s.r.l. RO Bucharest 5,550,000 RON 100.00% 5.4.20<strong>07</strong> V<br />
Bewo International d.o.o. Beograd SRB Belgrade 500 EUR 50.00% 13.4.20<strong>07</strong> Q<br />
S+B CEE ZETA CYPRUS LIMITED CY Nicosia 10,000 CYP 50.00% 18.4.20<strong>07</strong> Q<br />
S+B CEE EPSILON CYPRUS LIMITED CY Nicosia 10,000 CYP 50.00% 20.4.20<strong>07</strong> Q<br />
S+B CEE ETA CYPRUS LIMITED CY Nicosia 10,000 CYP 50.00% 20.4.20<strong>07</strong> Q<br />
*) Owner as of 7.9.<strong>2006</strong> (IE instead of IW).<br />
**) Merged with Immoeast Cora Holding s.r.l. as of 21.9.<strong>2006</strong>.<br />
***) IE Projekt Caelum: 20% stake sold to Generali.<br />
****) Merged with Mistral Real Sp.z o.o. as of 29.1.20<strong>07</strong>.<br />
V = Full consolidation, Q = Proportionate consolidation, E = Equity method<br />
These consolidated financial statements were completed and signed by the Executive Board of <strong>IMMOEAST</strong> AG on<br />
5July 20<strong>07</strong>.<br />
Vienna, 5 July 20<strong>07</strong><br />
THE EXECUTIVE BOARD OF <strong>IMMOEAST</strong> AG<br />
Group companies<br />
Norbert Gertner Karl Petrikovics<br />
Member Chairman<br />
Christian Thornton Edgar Rosenmayr<br />
Member Deputy Member<br />
The consolidated financial statements of <strong>IMMOEAST</strong> AG and all relevant documents were filed with the Company<br />
Register of the Commercial Court of Vienna under Registry Number 189637d.<br />
Type of consolidation
242 <strong>IMMOEAST</strong> <strong>Annual</strong> <strong>Report</strong> <strong>2006</strong>/<strong>07</strong><br />
Auditor’s <strong>Report</strong><br />
(<strong>Report</strong> of the independent auditor)<br />
We have audited the consolidated financial statements of <strong>IMMOEAST</strong> AG, Vienna,<br />
for the financial year from 1 May <strong>2006</strong> to 30 April 20<strong>07</strong>. These consolidated financial statements comprise the balance<br />
sheet as of 30 April 20<strong>07</strong> and the income statement, cash flow statement and statement of changes in equity<br />
for the financial year ending on 30 April 20<strong>07</strong> as well as a summary of significant accounting policies and other<br />
explanatory notes.<br />
Management’s responsibility for the consolidated financial statements<br />
Management is responsible for the preparation and fair presentation of these consolidated financial statements in<br />
accordance with International Financial <strong>Report</strong>ing Standards (IFRS) as adopted by the EU. This responsibility includes:<br />
designing, implementing and maintaining internal control relevant to the preparation and fair presentation of financial<br />
statements that are free of material misstatement, whether due to fraud or error; selecting and applying appropriate<br />
accounting policies; and making accounting estimates that are reasonable under the given circumstances.<br />
Auditor’s responsibility<br />
Our responsibility is to express an opinion on these consolidated financial statements based on our audit. We conducted<br />
our audit in accordance with laws and regulations applicable in Austria and in accordance with the International<br />
Standards on Auditing (ISAs) that were issued by the International Auditing and Assurance Standards Board<br />
(IAASB) of the International Federation of Accountants (IFAC). These standards require that we comply with ethical<br />
requirements and plan and perform the audit to obtain reasonable assurance whether the financial statements are<br />
free of material misstatement.<br />
An audit involves performing procedures to obtain audit evidence about the amounts and disclosures in the consolidated<br />
financial statements. The procedures selected depend on the auditor’s judgment, including an assessment of<br />
the risks of material misstatement of the financial statements, whether due to fraud or error. In making those risk<br />
assessments, the auditor considers internal control relevant to the entity’s preparation and fair presentation of the<br />
consolidated financial statements in order to design audit procedures that are appropriate under the circumstances,<br />
but not for the purpose of expressing an opinion on the effectiveness of the entity’s internal control. An audit also<br />
includes evaluating the appropriateness of accounting policies used and the reasonableness of accounting estimates<br />
made by management as well as evaluating the overall presentation of the consolidated financial statements.<br />
We believe that the audit evidence we have obtained is sufficient and appropriate to provide a basis for our audit<br />
opinion.
Opinion<br />
Our audit did not give rise to any objections. Based on the results of our audit and in our opinion, the consolidated<br />
financial statements present fairly, in all material respects, the financial position of the group as of 30 April 20<strong>07</strong> and<br />
its financial performance and cash flows for the financial year from 1 May <strong>2006</strong> to 30 April 20<strong>07</strong> in accordance with<br />
International Financial <strong>Report</strong>ing Standards (IFRS) as adopted by the EU.<br />
<strong>Report</strong> on other legal and regulatory requirements<br />
Laws and regulations applicable in Austria require us to perform audit procedures to determine whether the consolidated<br />
management report is consistent with the consolidated financial statements and to also determine whether<br />
the other disclosures in the consolidated management report do not give rise to misconceptions of the position of<br />
the group.<br />
In our opinion, the consolidated management report is consistent with the consolidated financial statements.<br />
Vienna, 5 July 20<strong>07</strong><br />
KPMG Austria GmbH<br />
Wirtschaftsprüfungs- und Steuerberatungsgesellschaft<br />
Auditor’s report<br />
Yann-Georg Hansa Günther Hirschböck<br />
Certified Public Accountant Certified Public Accountant<br />
<strong>Report</strong> by the Executive Board 243<br />
Highlights <strong>2006</strong>/<strong>07</strong><br />
Business Model and Strategy<br />
Portfolio Structure<br />
Corporate Governance and Outlook<br />
Property Portfolio<br />
Development of Business<br />
Consolidated Financial Statements<br />
Service and Glossary
244 <strong>IMMOEAST</strong> <strong>Annual</strong> <strong>Report</strong> <strong>2006</strong>/<strong>07</strong><br />
Analysis of Results<br />
A. General information<br />
<strong>IMMOEAST</strong> AG serves as the holding company for business activities in Central and Eastern Europe within the IMMO-<br />
FINANZ Group. The primary activity of the company is the acquisition and management of investments in other enterprises.<br />
Therefore, the development of business in these investments and the earnings they generate are of significant<br />
importance for an evaluation of <strong>IMMOEAST</strong> AG. For this reason, additional details on the development of business and<br />
the results of the group are provided in the following sections in accordance with § 267 (3) of the Austrian Commercial<br />
Code and in connection with § 251 (3) of the Austrian Commercial Code. The same applies to the description of events<br />
that occurred after the balance sheet date as well as the use of financial instruments and the related risks.<br />
B. Financial and non-financial performance indicators (§ 267 (2) 2 of the Austrian Commercial Code)<br />
The development of business at <strong>IMMOEAST</strong> AG was excellent during <strong>2006</strong>/<strong>07</strong>, not only reflecting successful performance<br />
but also confirming the company’s growth strategy. Consolidated revenues reached EUR 192.9 million, for an<br />
increase of 141.1% over the 2005/06 financial year. EBIT rose from EUR 156.3 million to EUR 541.3 million. The largest<br />
component of earnings was provided by revaluation gains of EUR 493.1 million. Net profit for the <strong>2006</strong>/<strong>07</strong> financial<br />
year totalled EUR 536.2 million, for an increase of more than 269%. Gross cash flow rose by 154.9% to EUR 63.4 million<br />
and led to a cash flow margin of 43.4%, which represents an excellent level in branch comparison.<br />
<strong>IMMOEAST</strong> AG endeavours to construct and manage its buildings in accordance with the latest technical standards<br />
and the most recent environmental protection regulations.<br />
During the reporting year <strong>IMMOEAST</strong> AG employed 16 persons in Poland through an energy supply company.<br />
C. New investments completed during the <strong>2006</strong>/<strong>07</strong> financial year<br />
The consolidation range increased from 154 in 2005/06 to 300 during the <strong>2006</strong>/<strong>07</strong> financial year. The following major<br />
acquisitions were made during the reporting period:<br />
Segment CEE (Central and Eastern Europe)<br />
During the first quarter of <strong>2006</strong>/<strong>07</strong> <strong>IMMOEAST</strong> AG acquired a 25% stake in the TriGránit Group, the leading property<br />
developer in Central and Eastern Europe, through TriGránit Holding Limited. This investment gives <strong>IMMOEAST</strong> AG a<br />
holding in the TriGránit portfolio as well as pre-emptive rights to all TriGránit projects at market prices.<br />
<strong>IMMOEAST</strong> AG acquired 100% of the shares in the Polish Salzburg Center Development S.A. as of 31 July <strong>2006</strong>. This<br />
company owns an office building on the southwest border of the so-called “Central Business District” in Warsaw.<br />
During the second quarter of <strong>2006</strong>/<strong>07</strong> <strong>IMMOEAST</strong> AG acquired 100% of the shares in the Polish Xantium Sp.z o.o.,<br />
which purchased the Brama Zachodnia office building through an asset deal. The project building is situated near<br />
the construction site of the Equator Office in the Jerozolimskie Business Corridor, the most dynamic office district<br />
in Warsaw. A number of shopping centres (Reduta, Blue City) are also located nearby. Brama Zachodnia is a modern<br />
14-storey office complex that includes offices and a conference room as well as a restaurant and building services<br />
rooms. The object is fully let, primarily to well-known international corporations such as Ericsson.<br />
A 51% stake was acquired in each of four Polish companies as of 28 August <strong>2006</strong>: Equator Real Sp.z o.o., Zenith Real<br />
Sp. Z o.o., Nimbus Real Sp. Z o.o. and Cirrus Real Sp.z o.o. This project involves the construction of four office buildings<br />
in the most dynamic commercial district of the Polish capital. It will be managed by a joint venture that includes<br />
a well-known international property developer with significant experience in Warsaw.
Analysis of Results<br />
As of 9 October <strong>2006</strong> <strong>IMMOEAST</strong> AG purchased a 70% stake in the Cypriote Silesia Residential Holding Limited and,<br />
through the transaction, also acquired a 70% stake in this company’s Polish subsidiary Silesia Residential Sp.z.o.o.<br />
The Debowe Tarasy – Silesia City Center Residential development project involves the construction of 980 apartments<br />
in four phases. The site has optimal transport connections and a good infrastructure, which also includes a<br />
recreation area with sports facilities north of the project location. Construction will take 13 months.<br />
During the third quarter of <strong>2006</strong>/<strong>07</strong> <strong>IMMOEAST</strong> AG completed its largest investment in Poland to date in the form of<br />
a joint investment with Heitman European Property Partners. The acquisition of 50% stakes in the Polish MBP I Sp. z<br />
o.o. and MBP II Sp. z o.o. transferred the Mokotow Business Park to the company’s portfolio. The Mokotow Business<br />
Park comprises nine office towers and is one of the most successful office projects in Warsaw.<br />
The Rondo Jazdy Polskiej, a further joint venture project in Warsaw, was acquired by the Polish Fobos Investment<br />
Sp. z o.o as of 29 December <strong>2006</strong>. The company owns an office development project that is located in the centre of<br />
Warsaw.<br />
The Passat Office Building in Warsaw, a standing investment, was acquired as of 29 March 20<strong>07</strong> through the purchase<br />
of 100% of the shares in the Polish Passat Real Sp. z o.o. The Passat Office Building is a modern office property<br />
that is located adjacent to the Mistral Office Building owned by <strong>IMMOEAST</strong> AG. The object has an excellent location,<br />
with easy access via public transportation. Both the city centre of Warsaw and the international airport can be<br />
reached in 10 minutes.<br />
As of 9 June <strong>2006</strong> <strong>IMMOEAST</strong> AG acquired a 25% stake in the Slovakian TriGránit Centrum a.s., which is developing<br />
the Lakeside project in Bratislava. This investment is classified as an associated company.<br />
The Slovakian SCT s.r.o. was fully consolidated by <strong>IMMOEAST</strong> AG as of 21 December <strong>2006</strong>. This company owns the<br />
Arkadia shopping centre, which is located on the eastern border of Trnava near a densely populated residential area.<br />
The Czech Aragonit s.r.o. was acquired in full as of 1 July <strong>2006</strong>, which added the Skofin Office Building in Prague<br />
to the <strong>IMMOEAST</strong> portfolio. As of 30 May <strong>2006</strong> a 50.50% stake was acquired in My Box Straconice s.r.o., a project<br />
company in the Czech Republic.<br />
The Czech Diamant Real s.r.o. was fully consolidated by <strong>IMMOEAST</strong> AG as of 31 October <strong>2006</strong>. This transaction led to<br />
the purchase of one of the larger modern office properties (“Diamond Point”) in the capital city of Prague. In addition,<br />
49% of the shares in Veronia Shelf s.r.o., the parent company of Diamant Real s.r.o., were sold to the joint venture<br />
partner Allianz projštovna, a.s. as of 30 November <strong>2006</strong>.<br />
As of 13 November <strong>2006</strong> <strong>IMMOEAST</strong> AG acquired 100% of the shares in the Czech WINNIPEGIA SHELF s.r.o. and, from<br />
this company, the Grand Pardubice shopping centre. This property is located only several minutes from the historical<br />
old city and castle in Pardubice, and is comprised of two connected building complexes.<br />
During the third quarter of <strong>2006</strong>/<strong>07</strong> <strong>IMMOEAST</strong> AG concluded its largest investment to date on the Czech office<br />
market. As of 13 December <strong>2006</strong> the company acquired 100% of the shares in Building A k.s., Building B k.s. and<br />
Building C k.s., which led to the takeover of three objects in the BB Centrum office park. All three properties are fully<br />
let to well-known companies, in particular subsidiaries of foreign corporations.<br />
<strong>IMMOEAST</strong> AG acquired 100% of the shares in the Czech Centre Investments s.r.o., Delta Park a.s. and Brno Estates<br />
a.s. as part of a uniform transaction during the fourth quarter of <strong>2006</strong>/<strong>07</strong>. This portfolio comprises four standing<br />
investments and two forward purchases: Jungmannova Plaza, a class A office property that is located in the historical<br />
city centre of Prague, is almost fully let and has international tenants; Sylva Taroucca, a historical building on the<br />
Graben in Prague that is fully occupied; OC Petrov: an object located in the centre of Brno that is also almost fully<br />
<strong>Report</strong> by the Executive Board 245<br />
Highlights <strong>2006</strong>/<strong>07</strong><br />
Business Model and Strategy<br />
Portfolio Structure<br />
Corporate Governance and Outlook<br />
Property Portfolio<br />
Development of Business<br />
Consolidated Financial Statements<br />
Service and Glossary
246 <strong>IMMOEAST</strong> <strong>Annual</strong> <strong>Report</strong> <strong>2006</strong>/<strong>07</strong><br />
let; Brno Business Park – Phase 1: an office complex in Brno that is comprised of two buildings; Brno Business Park<br />
– Phase 2: this class A office development project in Brno also comprises two buildings and represents an extension<br />
to the existing Brno Business Park – Phase 1 project; Letna Galeria: this shopping and business centre in Prague 7<br />
is a development project that has received district approval.<br />
Central Business Center Rt., a Hungarian project company, was fully consolidated by <strong>IMMOEAST</strong> AG as of 10 January<br />
20<strong>07</strong>. The company owns the Central Business Center in Budapest, which is located on the Buda-side of the city near<br />
the Margit Bridge.<br />
Segment CIS (Community of Independent States)<br />
As of 21 June <strong>2006</strong> <strong>IMMOEAST</strong> AG acquired 100% of the shares in the Cypriote Wakelin Promotions Limited, which has<br />
an office in Russia, and the Russian Krona Design LLC. These companies own two shopping centres in Moscow: Golden<br />
Babylon I and Golden Babylon II. Golden Babylon I, the larger of the two objects, is fully rented to attractive tenants<br />
from the foodstuffs and electronics branches. Golden Babylon II was completed in August <strong>2006</strong> and is also fully let.<br />
As of 13 November <strong>2006</strong> <strong>IMMOEAST</strong> AG acquired 50% of the shares in the Cypriote Gangaw Investments Limited and<br />
the Russian OAO Kashirskij Dvor-Severyanin. This transaction will lead to the construction of the Rostokino Retail<br />
Park in Moscow through a joint project together with an established Russian property developer. The Rostokino is<br />
scheduled for completion at the end of 2009, and has an excellent location at the intersection of the Mira Prospect<br />
and the future fourth ring road.<br />
<strong>IMMOEAST</strong> AG acquired 100% of the shares in the Cypriote Trevima Ltd. during the third quarter of <strong>2006</strong>/<strong>07</strong>, which<br />
also resulted in the takeover of 100% of the shares in this company’s Russian subsidiary OOO Torgoviy Dom Na<br />
Khodinke. This transaction resulted in the acquisition of the 5th Avenue Shopping Center project, which is a threestorey<br />
shopping centre with two underground garage levels.<br />
During the third quarter of <strong>2006</strong>/<strong>07</strong> <strong>IMMOEAST</strong> AG concluded a broad-based cooperation agreement in Ukraine,<br />
which took the form of a joint investment with the well-known Ukrainian developer Alacor. Through a successive<br />
purchase of shares (from 24.9% to 51% and 41%, respectively) in the Cypriote Loberta Holding Limited and Roches<br />
Ventures Limited, the Alacor Business Park City logistics and office project and the Alacor Logistic Park Obukhov were<br />
acquired. Both the Business Park City and the Park Obukhov are located in the south of Kiev and have excellent traffic<br />
connections. The completion of both projects is scheduled for 2009.<br />
Segment SEE (South-eastern Europe)<br />
<strong>IMMOEAST</strong> AG acquired 100% of the shares in the Bulgarian Koral Residence EAD as of 23 June <strong>2006</strong>. A closed<br />
complex with a 4-star hotel and residential area will be built in Zarevo, 50 km south of the Black Sea resort of Burgas<br />
in Bulgaria, as a joint investment by <strong>IMMOEAST</strong> and Prime Property BG.<br />
As of 12 December <strong>2006</strong> <strong>IMMOEAST</strong> AG acquired all of the shares in the Maltese Blue Danube Holding Ltd. and its<br />
Bulgarian subsidiary Business Park West-Sofia EAD. This project involves the revitalisation of a former light industrial<br />
and administrative complex in four phases to create a business park.<br />
<strong>IMMOEAST</strong> AG purchased 80% of the shares in each of the Croatian companies Grand Centar d.o.o. and Grand Zagreb<br />
d.o.o. as of 30 November <strong>2006</strong>, which resulted in the acquisition of the Grand Center office and retail property in<br />
the capital city of Zagreb. This represents the first direct investment by <strong>IMMOEAST</strong> AG in Croatia, and was realised<br />
together with Generali Immobilien AG. The majority of the space in the Grand Center is used as offices, but retail<br />
space, warehouses and an underground garage are also available. This property has a central location, roughly<br />
800 m from the historical old city.
Analysis of Results<br />
As of 13 July <strong>2006</strong> <strong>IMMOEAST</strong> AG acquired 100% of the shares in S.C. Almera New Capital s.r.l., which owns a property<br />
in Timis¸oara. This transaction will lead to the creation of a logistics centre portfolio of five to seven objects<br />
together with the development partner Eyemaxx. A 50% stake in this company was sold as of 1 February 20<strong>07</strong> and<br />
resulted in a changeover to proportionate consolidation as of 30 April 20<strong>07</strong>. In addition, 89% of the shares in S.C.<br />
Meteo Business Park s.r.l. and S.C. Stupul de Albine s.r.l. were acquired as of 27 July <strong>2006</strong>, resulting in the acquisition<br />
of the Jandarmeriei property. This project comprises the development of an office complex and residential complex<br />
in the north of Bucharest.<br />
On 9 October <strong>2006</strong> <strong>IMMOEAST</strong> AG started the Craiova shopping centre project in Romania based on a joint venture<br />
agreement with an experienced general planner and developer in the CEE region with the purchase of a 90% stake<br />
in the Romanian Klyos Media s.r.l. This shopping centre is located in the north-western section of Craiova, the fifth<br />
largest city in Romania, and has excellent traffic connections.<br />
<strong>IMMOEAST</strong> AG purchased a 15% stake in the Romanian Polus Transilvania Companie de Investitii S.A. as of 2 November<br />
<strong>2006</strong>, and thereby acquired the Polus Center development project. This project involves the construction of a<br />
shopping centre in Cluj, the capital of the booming Romanian province of Transylvania. Completion is scheduled for<br />
November 20<strong>07</strong>.<br />
As of 14 December <strong>2006</strong> <strong>IMMOEAST</strong> AG purchased an 89% stake in the multi-functional project IUS Brasov with<br />
office, retail and residential space as well as a hotel. The property is located several minutes north of the commercial<br />
centre and old city, and offers an attractive infrastructure and good connections to public and private<br />
transportation.<br />
The SIBIU joint venture shopping centre project was acquired as of 15 December <strong>2006</strong> from the Cypriote S+B CEE<br />
Alpha Cyprus Limited (100% subsidiary of S+B CEE) through SBACARO s.r.l., a wholly owned Romanian investment<br />
company. This object is also located in the north-western region of Romania, directly on the outer ring road and close<br />
to the historical city centre. The opening is planned for 2009.<br />
The 100% acquisition of the Romanian Logistic Contractor s.r.l. in December <strong>2006</strong> led to the conclusion of a framework<br />
agreement for the Bucharest Distribution Park project in Romania. This property is located in the north of Bucharest,<br />
close to the beltway that surrounds this city and the autobahn that extends to Ploiesti and Brasov in the north.<br />
The project involves the construction of a modern logistics and distribution park in stages. The realisation of the<br />
entire project is expected to take three years, and numerous forwarding agents have already expressed an interest.<br />
As of 22 December <strong>2006</strong> a 50% stake was acquired in the Romanian TM s.r.l, a 100% subsidiary of the Cypriote<br />
Gesellschaft S+B CEE. This transaction resulted in the acquisition of the Targu Mures specialty shopping centre project.<br />
The property is located in the emerging economic region of Transylvania (in the north-east of Romania), which<br />
has a population of 160,000. This specialty shopping centre is scheduled to open in 2009.<br />
As of 19 February 20<strong>07</strong> a stake in S.C. Arbor Corporation s.r.l. was acquired in connection with the Glina specialty<br />
shopping centre joint venture project, which is being carried out by <strong>IMMOEAST</strong> AG and a German developer. This<br />
project involves the purchase of several sites and construction of a specialty shopping centre. The designated location<br />
is situated on the eastern border of Bucharest, and has an excellent infrastructure as well as ideal transport<br />
connections. Intensive negotiations with potential tenants are currently in progress.<br />
<strong>IMMOEAST</strong> AG and the Euromall developer group concluded an agreement for the construction of a joint venture<br />
project, the Euromall Residential Park, as of 19 February 20<strong>07</strong> through the acquisition of all shares in the Romanian<br />
S.C. IE Baneasa Project s.r.l. The site is located in the north-western part of Bucharest, in an area where a number of<br />
high-quality residential objects are currently under construction. This project involves the construction of residential<br />
space in the middle to upper segment, whereby completion will take place in four phases over a period of four to five<br />
years.<br />
<strong>Report</strong> by the Executive Board 247<br />
Highlights <strong>2006</strong>/<strong>07</strong><br />
Business Model and Strategy<br />
Portfolio Structure<br />
Corporate Governance and Outlook<br />
Property Portfolio<br />
Development of Business<br />
Consolidated Financial Statements<br />
Service and Glossary
248 <strong>IMMOEAST</strong> <strong>Annual</strong> <strong>Report</strong> <strong>2006</strong>/<strong>07</strong><br />
As part of activities carried out through a joint venture between <strong>IMMOEAST</strong> AG and the developer Eyemaxx, 50%<br />
of the shares in each of the two Romanian companies Eye Shop Targu Jiu s.r.l. and Eye Shop Hunedoara s.r.l. were<br />
acquired during the fourth quarter of <strong>2006</strong>/<strong>07</strong>. Plans calls for the construction of specialty shopping centres and<br />
shopping malls in the major economic and industrial cities of Romania.<br />
A further transaction during the fourth quarter involved the purchase of 50% of the shares in the Romanian Log Center<br />
Ploiesti s.r.l., Log Center Iasi s.r.l. and Log Center Brasov s.r.l A logistics portfolio will be compiled through a joint venture<br />
with the developer Eyemaxx. The objects will be situated at major economic and industrial sites in the regional<br />
cities of Romania, which are undersupplied with modern warehouse and logistics facilities at the present time. The<br />
realisation of these projects is planned to take place over the coming three to five years.<br />
The Euromall Galati Shopping Center, a joint venture project in Romania, was started at the end of March 20<strong>07</strong><br />
through the acquisition of the Romanian S.C. Union Investitii s.r.l. This project includes the construction and development<br />
of a modern shopping centre. In addition to shops, the Euromall Galati will also contain an entertainment area<br />
and a food court. The site is located at the centre of Galati near the main Domneasca road; it can be easily reached<br />
by private transportation, and is opposite the bus terminal and also close to the main railway station. The completion<br />
of this project is planned for the end of 20<strong>07</strong>.<br />
At the end of <strong>2006</strong>/<strong>07</strong> <strong>IMMOEAST</strong> AG acquired 100% of the shares in two Romanian companies, S.C Valero invest<br />
s.r.l. and S.C. Baneasa 6981 s.r.l., and thereby took over the Victoria Park office complex, a joint project under development<br />
by these firms in Bucharest. This project involves the construction of a class A office complex, which will<br />
comprise four connected building sections. The site is located in the northern part of Baneasa, only 9 km from the<br />
city centre and 5 km from the airport. The surrounding area is considered to be the political centre of the city because<br />
the Romanian government and numerous embassies are situated here.<br />
<strong>IMMOEAST</strong> AG also completed its first investments in Serbia during the second quarter of the <strong>2006</strong>/<strong>07</strong> Business<br />
Year. An 80% stake in OCEAN ATLANTIC DORCOL DOO, a company with headquarters in Belgrade, was acquired as of<br />
24 August <strong>2006</strong>; this transaction added the Francuska residential project to the <strong>IMMOEAST</strong> portfolio. The project<br />
entails the construction of 130 apartments and 184 underground garage spaces.<br />
During the second quarter of the <strong>2006</strong>/<strong>07</strong> Business Year <strong>IMMOEAST</strong> AG also made its first investments in Slovenia by<br />
acquiring 100% of the shares in Alpha Real d.o.o. and Beta Real d.o.o. as of 30 September <strong>2006</strong>. These transactions<br />
led to the takeover of two specialty shopping centres in Kranj and Nove Mesto. The facilities are located at central<br />
sites in the respective cities and are fully let.<br />
<strong>IMMOEAST</strong> AG has no expenditures for research and development (§ 267 (3) 3 of the Austrian Commercial Code).<br />
D. Financial instruments and risk management (§ 267 (3) 4 of the Austrian Commercial Code<br />
IAs an international company, <strong>IMMOEAST</strong> AG is exposed to various financial risks. The most important financial risks<br />
for the Group are associated with possible changes in foreign exchange rates, interest rates, and stock prices as well<br />
as the creditworthiness and liquidity of customers and business partners. The goal of <strong>IMMOEAST</strong> AG is to actively<br />
control these risks through systematic management.<br />
In accordance with IAS 32 and IAS 39, a distinction is made between primary and derivative financial instruments.<br />
Primary financial instruments include investments in other companies that are reported under financial assets as<br />
well as securities and loans granted, trade accounts receivable, available-for-sale securities and deposits with financial<br />
institutions. Available-for-sale financial assets are carried at fair value; all other financial assets are shown at<br />
amortised cost. The determination of fair value is based on market prices or calculated in accordance with recognised<br />
valuation methods. Primary financial instruments recorded under liabilities are comprised primarily of financial
Analysis of Results<br />
liabilities and trade accounts payable, which are shown at amortised cost. Derivative financial instruments are used<br />
to hedge the risk associated with fluctuations in foreign exchange rates and interest rates arising from business<br />
operations as well as the risk associated with monetary investments and financing.<br />
Default/credit risk<br />
Credit risk (default risk) is understood to represent the risk that one party to a financial instrument causes the other<br />
party to incur a financial loss by failing to meet a financial obligation. In accordance with IFRS 7.36, an entity must disclose<br />
– for each class of financial instrument – information on the maximum exposure to credit risk as of the closing<br />
date without taking account of any collateral held or other enhancements and also provide a description of collateral<br />
received and any credit enhancements as well as information on the carrying value of the financial assets whose<br />
contract terms were amended and which would have been classified as past due or impaired under the previous contract<br />
terms. In accordance with IFRS 7.B9, the amounts offset in keeping with IAS 32.42 ff. and impairment charges<br />
as defined in IAS 39 should be deducted from the gross carrying value of financial assets. The remaining amount<br />
represents the maximum credit risk. Collateral held in security and other credit enhancements are not included in this<br />
calculation, but only disclosed separately (IFRS 7.36(b)).<br />
Credit risks arise from the possibility that the counterparty to a transaction fails to meet his/her obligations, and the<br />
Group incurs financial damages as a result. The maximum credit risk for assets is represented by the amounts shown<br />
on the balance sheet. The risk of default associated with financial assets is reflected in impairment charges. The risk<br />
of default for <strong>IMMOEAST</strong> AG is low because the credit standing of customers is reviewed on a regular basis, and no<br />
single tenant is responsible for more than 5% of total outstanding receivables.<br />
The volume of primary financing instruments held by the Group is shown on the balance sheet, whereby the value of<br />
financial assets represents the maximum risk of default. The risk of default associated with other primary financing<br />
instruments and derivative financial instruments is also low because all financing transactions are concluded with<br />
financial institutions that have excellent credit ratings.<br />
The most important instrument for the management and control of default risk is the diversity of the property portfolio<br />
and the selection of a suitable tenant structure for each property. The risk of default on receivables due from<br />
tenants is low because tenants are generally required to provide collateral (for residential properties: cash deposits,<br />
for commercial properties: bank guarantees or cash deposits) and the credit standing of tenants is monitored on a<br />
regular basis.<br />
Market risk<br />
Market risk is the risk that the fair value or future cash flows of a financial instrument may fluctuate due to a change<br />
in market prices. There are three types of market risk: foreign exchange risk, interest rate risk and other price risks.<br />
Foreign exchange risk<br />
Foreign exchange risks can affect <strong>IMMOEAST</strong> AG in two forms: fluctuation in foreign exchange rates can influence the<br />
results of valuations, and also have an impact on the asset position of the company.<br />
The results from companies located outside the Euro zone, which are included using full or proportionate consolidation,<br />
are translated based on the functional currency of the local company in accordance with the modified current<br />
rate method. The expert opinions on properties are prepared in Euros and fluctuations in exchange rates will influence<br />
the results from the revaluation of properties.<br />
An increase in foreign exchange rates compared to the Euro will lead to higher Euro amounts in the fair values of<br />
investment properties than the amounts reflected in the expert opinions from the prior year. When the latest value is<br />
compared with the unchanged amount from a prior year expert opinion in Euro, the translation of the prior year Euro<br />
amount back into the functional currency (local currency) leads to a lower value – because of the higher exchange<br />
rate – and therefore to a write-down. If the value in the expert opinion rises, this foreign exchange effect reduces the<br />
<strong>Report</strong> by the Executive Board 249<br />
Highlights <strong>2006</strong>/<strong>07</strong><br />
Business Model and Strategy<br />
Portfolio Structure<br />
Corporate Governance and Outlook<br />
Property Portfolio<br />
Development of Business<br />
Consolidated Financial Statements<br />
Service and Glossary
250 <strong>IMMOEAST</strong> <strong>Annual</strong> <strong>Report</strong> <strong>2006</strong>/<strong>07</strong><br />
upward potential for the valuation of the property; if the value in the expert opinion is lower, this effect increases<br />
the write-down.<br />
A decrease in foreign exchange rates compared to the Euro lead to lower Euro amounts in the fair values than the<br />
amounts shown in prior years when the fair values of properties are translated. When the latest value is compared<br />
with the unchanged amount from a prior year expert opinion in Euro, the translation of the prior year Euro amount<br />
back into the functional currency (local currency) leads to a higher value – because of the lower exchange rate – and<br />
therefore to a write-up. If the value in the expert opinion rises, this foreign exchange effect increases the upward for<br />
the valuation of the property; if the value in the expert opinion is lower, this effect reduces the write-down.<br />
As of 30 April 20<strong>07</strong>, the net revaluation income recognised by <strong>IMMOEAST</strong> AG totalled TEUR 493,095.1. This figure<br />
comprises revaluation income of TEUR 567,003.6 and impairment charges of TEUR 73,908.5. Part of the impairment<br />
charges resulted from an increase in the value of the local currency compared with the Euro. This effect involved<br />
properties in Hungary, Poland, Slovakia and Romania.<br />
IAS 21 calls for the translation of monetary assets and liabilities at the average exchange rate in effect on the balance<br />
sheet date as well as the recognition of any gains or losses to the income statement. For this reason, fluctuations in<br />
exchange rates can have a direct impact on the asset position of the Group.<br />
The risk of devaluation associated with cash balances in foreign currencies is offset by the rapid conversion of these<br />
funds into euros or through investments in these currencies. In addition, the low USD cash balances are used for<br />
investments in USD to which the group is committed.<br />
Another management instrument to minimise foreign exchange risk is the restrictive use of foreign currency credits<br />
in Europe. In this region, the risk arising from adverse foreign exchange effects is outweighed by the advantages of<br />
low interest rates.<br />
In order to limit the foreign exchange risk associated with rental income, contractual agreements with tenants in<br />
countries where the functional currency is not the Euro generally call for the payment of rents in Euro or link the rental<br />
payments to the Euro exchange rate on particular dates.<br />
Derivative financial instruments are also used to manage foreign exchange risk. The derivative financial instruments<br />
used by <strong>IMMOEAST</strong> AG to hedge foreign exchange risk are recorded as independent transactions and not as hedge<br />
transactions. Hedge accounting as defined in IAS 39.85 – IAS 39.102 is not applied because the requirements stated<br />
in these regulations are not met.<br />
Derivative financial instruments are stated at market value. Derivatives with a positive market value are included<br />
under the balance sheet position “other financial instruments”, while derivatives with a negative market value are<br />
shown under “other liabilities”.<br />
Any changes in this market value are recognised as income or expenses under financial results.
Analysis of Results<br />
The following table shows the market values and conditions of all derivative financial instruments that were purchased<br />
to hedge foreign exchange risk.<br />
The reference value forms the basis value for derivatives outstanding as of the balance sheet date.<br />
The market value represents the amount that the relevant company would receive or be required to pay if the transaction<br />
were terminated as of the balance sheet date. The market values do not reflect the proportionate consolidation<br />
of the company in the consolidated financial statements.<br />
Interest rate risk<br />
As an international company, <strong>IMMOEAST</strong> AG is exposed to the risk of interest rate fluctuations on various property<br />
submarkets. Changes in interest rates can influence the earnings recorded by the Group through higher interest costs<br />
for existing variable rate financing, and can also have a reflex effect on the valuation of properties.<br />
Changes in interest rates have a direct influence on the financial results recorded by the Group in that they increase<br />
the cost of variable rate financing. <strong>IMMOEAST</strong> AG manages the risk associated with rising interest rates, which would<br />
lead to an increase in interest expense and a decline in financial results, through the use of derivative financial<br />
instruments. The derivative financial instruments used by <strong>IMMOEAST</strong> AG to hedge interest rate risk are recorded as<br />
independent transactions and not as hedge transactions. Hedge accounting as defined in IAS 39.85 – IAS 39.102 is<br />
not applied because the requirements stated in these regulations are not met.<br />
Derivative financial instruments are stated at market value. Derivatives with a positive market value are included<br />
under the balance sheet position ”other financial instruments“, while derivatives with a negative market value are<br />
shown under “other liabilities“.<br />
Any changes in this market value are recognised as income or expenses under financial results. In addition, the Group<br />
has concluded financing contracts that carry fixed interest rates.<br />
<strong>Report</strong> by the Executive Board 251<br />
Highlights <strong>2006</strong>/<strong>07</strong><br />
Business Model and Strategy<br />
Portfolio Structure<br />
Corporate Governance and Outlook<br />
Property Portfolio<br />
Development of Business<br />
Consolidated Financial Statements<br />
Service and Glossary<br />
Reference Market<br />
fixed interest Reference value as of value as of<br />
rate/ex- interest 30.4.20<strong>07</strong> 30.4.20<strong>07</strong><br />
Company Derivative Currency Beginning End Financial institution change rate rate Hedge Currency in 1,000 in TEUR<br />
MBP I Sp. z o.o. FX FORWARD USD/EUR 4.12.<strong>2006</strong> 29.6.20<strong>07</strong> Aareal Bank AG 1.3344 n.a. Foreign currency (USD) USD 2,536.3 46.3<br />
MBP I Sp. z o.o. FX FORWARD USD/EUR 4.12.<strong>2006</strong> 28.9.20<strong>07</strong> Aareal Bank AG 1.3383 n.a. Foreign currency (USD) USD 2,4<strong>07</strong>.7 43.3<br />
MBP I Sp. z o.o. FX FORWARD USD/EUR 4.12.<strong>2006</strong> 28.12.20<strong>07</strong> Aareal Bank AG 1.3417 n.a. Foreign currency (USD) USD 2,336.1 41.1<br />
MBP I Sp. z o.o. FX FORWARD USD/EUR 4.12.<strong>2006</strong> 31.3.2008 Aareal Bank AG 1.3448 n.a. Foreign currency (USD) USD 2,185.1 37.0<br />
MBP I Sp. z o.o. FX FORWARD USD/EUR 4.12.<strong>2006</strong> 30.6.2008 Aareal Bank AG 1.3477 n.a. Foreign currency (USD) USD 2,126.1 34.2<br />
MBP I Sp. z o.o. FX FORWARD USD/EUR 4.12.<strong>2006</strong> 30.9.2008 Aareal Bank AG 1.35<strong>07</strong> n.a. Foreign currency (USD) USD 1,975.8 29.8<br />
MBP I Sp. z o.o. FX FORWARD USD/EUR 4.12.<strong>2006</strong> 30.12.2008 Aareal Bank AG 1.3539 n.a. Foreign currency (USD) USD 1,808.1 25.4<br />
MBP I Sp. z o.o. FX FORWARD USD/EUR 4.12.<strong>2006</strong> 31.3.2009 Aareal Bank AG 1.3571 n.a. Foreign currency (USD) USD 1,581.9 20.6<br />
MBP I Sp. z o.o. FX FORWARD USD/EUR 4.12.<strong>2006</strong> 30.6.2009 Aareal Bank AG 1.3602 n.a. Foreign currency (USD) USD 1,482.8 18.0<br />
MBP I Sp. z o.o. FX FORWARD USD/EUR 4.12.<strong>2006</strong> 30.9.2009 Aareal Bank AG 1.3633 n.a. Foreign currency (USD) USD 939.3 10.7<br />
MBP I Sp. z o.o. FX FORWARD USD/EUR 4.12.<strong>2006</strong> 30.12.2009 Aareal Bank AG 1.3668 n.a. Foreign currency (USD) USD 643.6 6.7<br />
MBP I Sp. z o.o. FX FORWARD USD/EUR 4.12.<strong>2006</strong> 31.3.2010 Aareal Bank AG 1.3708 n.a. Foreign currency (USD) USD 570.1 5.3<br />
MBP I Sp. z o.o. FX FORWARD USD/EUR 4.12.<strong>2006</strong> 30.6.2010 Aareal Bank AG 1.3744 n.a. Foreign currency (USD) USD 567.7 4.9<br />
MBP I Sp. z o.o. FX FORWARD USD/EUR 4.12.<strong>2006</strong> 30.9.2010 Aareal Bank AG 1.3779 n.a. Foreign currency (USD) USD 567.7 4.5<br />
MBP I Sp. z o.o. FX FORWARD USD/EUR 4.12.<strong>2006</strong> 30.12.2010 Aareal Bank AG 1.3814 n.a. Foreign currency (USD) USD 378.5 2.8
252 <strong>IMMOEAST</strong> <strong>Annual</strong> <strong>Report</strong> <strong>2006</strong>/<strong>07</strong><br />
The following table shows the market values and conditions of all derivative financial instruments that were purchased<br />
to hedge interest rate risk.<br />
Reference Market<br />
Fixed interest Reference value as of value as of<br />
rate/ex- interest 30.4.20<strong>07</strong> 30.4.20<strong>07</strong><br />
Company Derivative Currency Beginning End Financial institution change rate rate Hedge Currency in 1,000 in 1,000<br />
Atom Centrum a.s.<br />
Centrum Olympia<br />
CAP EUR 31.3.<strong>2006</strong> 31.3.2011 HVB Bank Czech Republic a.s. 4.00% 3M-EURIBOR Interest rate EUR 14,418.8 184.1<br />
Olomouc a.s. CAP EUR 31.8.2005 30.9.2010 HVB Bank Czech Republic a.s. 3.00% 3M-EURIBOR Interest rate EUR 36,115.2 1,390.3<br />
PERL INVEST a.s. CAP EUR 31.1.<strong>2006</strong> 27.9.20<strong>07</strong> Bank Austria Creditanstalt AG 3.50% 3M-EURIBOR Interest rate EUR 4,920.1 6.3<br />
Prokopova Development a.s. CAP EUR 31.1.<strong>2006</strong> 27.9.20<strong>07</strong> Bank Austria Creditanstalt AG 3.50% 3M-EURIBOR Interest rate EUR 787.2 1.0<br />
E.N.G. Property a.s. CAP EUR 31.1.<strong>2006</strong> 27.9.20<strong>07</strong> Bank Austria Creditanstalt AG 3.50% 3M-EURIBOR Interest rate EUR 4,100.1 5.2<br />
JUNGMANNOVA ESTATES a.s. CAP EUR 31.1.<strong>2006</strong> 27.9.20<strong>07</strong> Bank Austria Creditanstalt AG 3.50% 3M-EURIBOR Interest rate EUR 10,660.2 13.6<br />
NP Investments a.s. CAP EUR 31.1.<strong>2006</strong> 27.9.20<strong>07</strong> Bank Austria Creditanstalt AG 3.50% 3M-EURIBOR Interest rate EUR 25,355.0 32.4<br />
J.H.Prague a.s. CAP EUR 31.1.<strong>2006</strong> 27.9.20<strong>07</strong> Bank Austria Creditanstalt AG 3.50% 3M-EURIBOR Interest rate EUR 9,512.2 12.2<br />
PAN Development a.s. CAP EUR 31.1.<strong>2006</strong> 27.9.20<strong>07</strong> Bank Austria Creditanstalt AG 3.50% 3M-EURIBOR Interest rate EUR 2,904.1 6.7<br />
IRIDE S.A. CAP EUR 7.8.<strong>2006</strong> 28.7.2011 Raiffeisen Zentralbank Österreich AG 5.00% 3M-EURIBOR Interest rate EUR 46,069.9 72.0<br />
Globe 13 Kft. CAP EUR 31.10.<strong>2006</strong> 31.10.2011 Bank Austria Creditanstalt AG 5.00% 3M-EURIBOR Interest rate EUR 17,450.0 -75.6<br />
Lentia Real (1) Kft. CAP EUR 31.10.<strong>2006</strong> 31.10.2011 Bank Austria Creditanstalt AG 5.00% 3M-EURIBOR Interest rate EUR 9,018.0 -40.4<br />
Szepvölgyi Businesspark Kft. CAP EUR 31.10.<strong>2006</strong> 31.10.2011 Bank Austria Creditanstalt AG 5.00% 3M-EURIBOR Interest rate EUR 9,700.0 -43.1<br />
Arpad Center Kft. CAP EUR 31.10.<strong>2006</strong> 31.10.2011 Bank Austria Creditanstalt AG 5.00% 3M-EURIBOR Interest rate EUR 5,420.0 -23.4<br />
MBP I Sp. z o.o. SWAP EUR 30.11.<strong>2006</strong> 30.12.2010 Aareal Bank AG 3.83% 3M-EURIBOR Interest rate EUR 141,661.7 1,833.5<br />
The reference value forms the basis value for derivatives outstanding as of the balance sheet date.<br />
The market value represents the amount that the relevant company would receive or be required to pay if the transaction<br />
were terminated as of the balance sheet date. The market values do not reflect the proportionate consolidation<br />
of the company in the consolidated financial statements.<br />
E. Segment reporting<br />
Revenues<br />
<strong>IMMOEAST</strong> AG recorded revenues of TEUR 192,920.4 in <strong>2006</strong>/<strong>07</strong>. Of this total, 23.8% were generated in Poland,<br />
the largest regional segment of the Group. Revenues in Poland more than tripled from TEUR 14,692.3 in 2005/06 to<br />
TEUR 45,845.3 for the reporting year. This growth was supported not only by acquisitions, but also by the excellent<br />
level of occupancy in the properties owned in this country. Investments in Poland are focused primarily on office,<br />
logistics and commercial space. The Czech Republic, the second largest regional segment of <strong>IMMOEAST</strong> AG, generated<br />
20.8% of Group revenues in <strong>2006</strong>/<strong>07</strong>. Revenues in this segment rose by 76.9% over the previous financial<br />
year, from TEUR 22,703.6 to TEUR 40,153.3. Hungary, with a 16.9% share of Group revenues, recorded an increase<br />
of 54.9% over the previous year to TEUR 32,568.4. In Romania, revenues rose significantly from TEUR 14,115.6 in<br />
2005/06 to TEUR 22,806.3 for the reporting year. Slovakia contributed 12.3% or TEUR 23,633.9 to Group revenues.<br />
During <strong>2006</strong>/<strong>07</strong> <strong>IMMOEAST</strong> AG was able to expand its property portfolio in a further six countries, including four<br />
countries in South-eastern Europe (SEE): Croatia with revenues of TEUR 1,589.7, Slovenia with TEUR 1,113.1, Bulgaria<br />
with TEUR 482.5 and Serbia with TEUR 1.2. The regional segment Russia realised revenues of TEUR 24,726.6, which<br />
represents a share of 12.8%.<br />
Operating profit (EBIT)<br />
<strong>IMMOEAST</strong> AG recorded an improvement in operating profit from TEUR 156,269.4 in the previous year to<br />
TEUR 541,288.7 for <strong>2006</strong>/<strong>07</strong>. The Czech Republic made the highest contribution to EBIT at 29%. This increase was<br />
supported above all by the positive development of the fair value of properties, which led to revaluation income of<br />
TEUR 146,145.4.
Analysis of Results<br />
Romania reported EBIT of TEUR 128,009.7 for <strong>2006</strong>/<strong>07</strong>, which represents an increase of 302.5% over the previous<br />
year as well as 23.7% of total EBIT recorded by <strong>IMMOEAST</strong> AG. This development was driven by two main factors: the<br />
sound increase in the fair value of the properties, which generated revaluation income of TEUR 117,134.2, and strong<br />
revenue growth in this segment.<br />
Business activities in Poland also showed very positive development, with EBIT reaching TEUR 81,234.3 in comparison<br />
to TEUR 56,023.5 in the previous year. The major component of the earnings improvement in this segment was<br />
also provided by the revaluation of properties.<br />
The new segment Bulgaria registered EBIT of 78,643.7 in <strong>2006</strong>/<strong>07</strong>, which represents 14.5% of operating profit for the<br />
Group. The largest contribution to earnings in this segment was generated by the revaluation of properties.<br />
Slovakia reported sound growth in EBIT. In comparison to the negative EBIT of TEUR 21,420.8 recorded in the previous<br />
year, the favourable development in the fair value of properties supported an increase in operating profit to<br />
TEUR 23,816.6.<br />
Financial results<br />
Financial results recorded by <strong>IMMOEAST</strong> AG rose from TEUR 26,676.3 in 2005/06 to TEUR 104,163.5 for the reporting<br />
year. This development resulted above all from profit on financial investments. Currency translation adjustments in<br />
the individual countries made a positive contribution of TEUR 15,411.4 (2005/06: TEUR 1,199.6) to financial results.<br />
The increasing strength of the HUF and RON led to currency translation gains in Hungary und Romania.<br />
Investments<br />
<strong>IMMOEAST</strong> AG invested a total of TEUR 1,480,861.7 during <strong>2006</strong>/<strong>07</strong>, which was allocated as follows: 26.7% in the<br />
Czech Republic, 23.7% in Russia, 23.4% in Poland, 12.1% in Romania and 7.2% in Hungary. These investments<br />
focused primarily on office, logistics and commercial properties.<br />
Cash EBIT margin<br />
The segment Poland made the highest cash contribution to profit recorded by <strong>IMMOEAST</strong> AG in <strong>2006</strong>/<strong>07</strong>. The segment<br />
Hungary fell slightly behind the average cash EBIT margin of 34%, but increased project investments led to<br />
impressive growth in this indicator over the previous year. Only Serbia and Bulgaria remained significantly below the<br />
Group average of 34%, but this situation is related to the higher costs incurred for the development projects that are<br />
currently underway in these countries.<br />
<strong>Report</strong> by the Executive Board 253<br />
Highlights <strong>2006</strong>/<strong>07</strong><br />
Business Model and Strategy<br />
Portfolio Structure<br />
Corporate Governance and Outlook<br />
Property Portfolio<br />
Development of Business<br />
Consolidated Financial Statements<br />
Service and Glossary
254 <strong>IMMOEAST</strong> <strong>Annual</strong> <strong>Report</strong> <strong>2006</strong>/<strong>07</strong><br />
F. Subsequent events (§ 267 (3) 1 of the Austrian Commercial Code)<br />
Capital transactions<br />
<strong>IMMOEAST</strong> AG carried out another capital increase in May 20<strong>07</strong>, which involved the issue of 277,941,375 shares<br />
of bearer stock at a price of EUR 10.20 per share. IMMOFINANZ AG subscribed to 50.46% of this issue and thereby<br />
retained its holding as of 30 April 20<strong>07</strong>.<br />
Acquisitions<br />
Romania<br />
After the closing date <strong>IMMOEAST</strong> AG acquired a 75% stake in Harborside Hotel s.r.l. This project involves the development<br />
and construction of an annex to the Harborside Constanta Phase 1, with a further 15,600 sqm of retail space<br />
and a hotel tower with 12,100 sqm of space. <strong>IMMOEAST</strong> AG will initially hold 75% of the shares, and the remaining<br />
25% will be owned by the project developer and site owners. Plans call for <strong>IMMOEAST</strong> AG to acquire this minority<br />
stake after the project is completed.<br />
Development also started on the Baia Mare Mall in the north-western region of Romania after 30 April 20<strong>07</strong>. This<br />
project represents a shopping and entertainment centre with approx. 43.000 sqm of space on two levels. The start<br />
of construction is scheduled for the fourth quarter of 20<strong>07</strong> and completion is expected during the fourth quarter of<br />
2008. This development project will be realised through a cooperation between <strong>IMMOEAST</strong> AG and a large Hungarian<br />
property company at a total investment volume of EUR 97 million.<br />
<strong>IMMOEAST</strong> AG acquired 100% of the shares in S.C. Flash Consult Invest s.r.l. after the end of the <strong>2006</strong>/<strong>07</strong> financial<br />
year. This company is the owner of the Euromall Shopping Center in Pitesti, Romania, which has roughly 32,000 sqm<br />
of letable space. This facility was completed and opened in May 20<strong>07</strong>.<br />
A further investment on the Romanian market was the acquisition of the shares in S.C. Dacian Second s.r.l. This project<br />
involves the development of the Pantelimon Warehouse logistics centre with more than 50,000 sqm of letable<br />
space in the Romanian capital, and is under realisation together with the European Future Group.<br />
<strong>IMMOEAST</strong> AG also acquired a 75% stake in S.C. Red Project Two s.r.l. shortly after the closing date. This company is<br />
developing a specialty shopping centre and shopping gallery with approx. 43,000 sqm of letable space and parking<br />
facilities. The building permit should be granted at the end of 20<strong>07</strong> and construction is scheduled to start in spring<br />
2008, with completion following roughly 18 months later.<br />
Through the acquisition of the Cypriote Gendana Ventures Ltd. in June 20<strong>07</strong>, <strong>IMMOEAST</strong> AG took over 100% of the<br />
shares in the Romanian Real Habitation s.r.l. This company owns a site adjoining the location for the IRIDE Business<br />
Park, which will be used for a 63,000 sqm expansion to this complex.<br />
In addition, <strong>IMMOEAST</strong> AG concluded a cooperation agreement with Eyemaxx for the development of a retail portfolio<br />
in Romania. This portfolio will comprise specialty shopping centres and shopping malls in mid-sized Romanian<br />
cities.<br />
Czech Republic<br />
On 3 May 20<strong>07</strong> <strong>IMMOEAST</strong> AG acquired a 5% stake in UTILITY PARK WEST s.r.o. This project will develop the Utility<br />
and Office Park West in Prague in four stages. The total investment is estimated at EUR 39 million, and <strong>IMMOEAST</strong><br />
AG will provide mezzanine capital.
Slovakia<br />
<strong>IMMOEAST</strong> AG acquired 10% of the shares in BIG BOX LEVICE s.r.o. and BIG BOX LIPTOVSKÝ MIKULÁŠ s.r.o. after the<br />
balance sheet date. Plans are in preparation for the construction of specialty shopping centres with approx. 5,500<br />
sqm of letable space as part of the Big Box Phase 2. <strong>IMMOEAST</strong> AG will purchase the remaining 90% of shares in<br />
these companies after the projects are completed and profitable rental contracts have been signed for at least 80%<br />
of the space.<br />
The Trencín and Nové Zámky locations opened in <strong>2006</strong>. The other specialty shopping centres are planned to open in<br />
autumn 20<strong>07</strong> and during 2008.<br />
G.Informationoncapital(§243a(1)oftheAustrianCommercialCode)<br />
The share capital of <strong>IMMOEAST</strong> AG totalled EUR 555,882,750 as of 30 April 20<strong>07</strong> (2005/06: EUR 222,353,100) and is<br />
divided into 555,882,750 (2005/06: 222,353,100) zero value shares.<br />
The classification of shares as of 30 April 20<strong>07</strong> is as follows:<br />
Number of shares Share capital in EUR Number of shares Share capital in EUR<br />
30 April 20<strong>07</strong> 30 April 20<strong>07</strong> 30 April <strong>2006</strong> 30 April <strong>2006</strong><br />
Registered shares 2 2 2 2<br />
Bearer shares 555,882,748 555,882,748 222,353,098 222,353,098<br />
Total 555,882,750 555,882,750 222,353,100 222,353,100<br />
The share premium in the individual financial statements prepared in accordance with Austrian commercial law<br />
includes appropriated reserves of TEUR 3,613,705,967 (2005/06: TEUR 1,195,616,004) from capital increases made<br />
in accordance with § 229 (2) 1 of the Austrian Commercial Code in conjunction with § 130 (2) of the Austrian Stock<br />
Corporation Act.<br />
The capital increase carried out in <strong>2006</strong>/<strong>07</strong> generated a premium of TEUR 2,418,089,963 (2005/06: TEUR 962,047,746),<br />
which was credited to the share premium account. The equity ratio of <strong>IMMOEAST</strong> AG equalled 97.8% as of 30 April<br />
20<strong>07</strong>.<br />
IMMOFINANZ AG holds 50.46% of the shares in <strong>IMMOEAST</strong> AG.<br />
Analysis of Results<br />
The articles of association do not contain any provisions that extend above and beyond legal requirements governing<br />
the appointment of persons to the Executive Board and Supervisory Board or the amendment of the articles of<br />
association.<br />
There are no agreements that would take effect or be amended or terminated by a change in control.<br />
There are no agreements between the company and the members of its Executive Board or Supervisory Board to pay<br />
compensation in the event of a public offer.<br />
The annual general meeting on 14 September <strong>2006</strong> authorised the Executive Board to increase share capital in<br />
accordance with § 169 of the Austrian Stock Corporation Act. This authorisation is valid until 24 November 2011 and<br />
covers an increase of up to EUR 277,941,375 to a total of EUR 833,824,125. An increase of EUR 277,941,375 in share<br />
capital was approved by the Executive Board through resolutions passed on 30 April 20<strong>07</strong> and 21 May 20<strong>07</strong> and was<br />
subsequently carried out.<br />
<strong>Report</strong> by the Executive Board 255<br />
Highlights <strong>2006</strong>/<strong>07</strong><br />
Business Model and Strategy<br />
Portfolio Structure<br />
Corporate Governance and Outlook<br />
Property Portfolio<br />
Development of Business<br />
Consolidated Financial Statements<br />
Service and Glossary
256 <strong>IMMOEAST</strong> <strong>Annual</strong> <strong>Report</strong> <strong>2006</strong>/<strong>07</strong><br />
H.Outlook(§267(3)2oftheAustrianCommercialCode)<br />
<strong>IMMOEAST</strong> AG operates in a business environment that produces above-average growth compared to other economic<br />
regions in Central Europe. Based on the financial power and well-considered expansion strategy of <strong>IMMOEAST</strong> AG,<br />
the growth of the Group can be expected to reflect the dynamics of this market. <strong>IMMOEAST</strong> AG intends to meet its<br />
objectives by further diversifying the Group’s portfolio by region and sector. Plans also call for the strengthening of<br />
activities in the field of property development. In the CEE region, the Group will continue to expand its market position.<br />
Additional investments will also be made in the SEE and CIS regions, where higher returns can be expected at<br />
the present time. In order to successfully develop these markets, partnerships will be established with local property<br />
developers.<br />
Vienna, 5 July 20<strong>07</strong><br />
THE EXECUTIVE BOARD<br />
Norbert Gertner Karl Petrikovics<br />
Member Chairman<br />
Christian Thornton Edgar Rosenmayr<br />
Member Deputy Member
Valuation Certificates<br />
Romania<br />
Valuation Certificates<br />
<strong>Report</strong> by the Executive Board 257<br />
Highlights <strong>2006</strong>/<strong>07</strong><br />
Business Model and Strategy<br />
Portfolio Structure<br />
Corporate Governance and Outlook<br />
Property Portfolio<br />
Development of Business<br />
Consolidated Financial Statements<br />
Service and Glossary
258 <strong>IMMOEAST</strong> <strong>Annual</strong> <strong>Report</strong> <strong>2006</strong>/<strong>07</strong><br />
Russia
Valuation Certificates<br />
<strong>Report</strong> by the Executive Board 259<br />
Highlights <strong>2006</strong>/<strong>07</strong><br />
Business Model and Strategy<br />
Portfolio Structure<br />
Corporate Governance and Outlook<br />
Property Portfolio<br />
Development of Business<br />
Consolidated Financial Statements<br />
Service and Glossary
260 <strong>IMMOEAST</strong> <strong>Annual</strong> <strong>Report</strong> <strong>2006</strong>/<strong>07</strong><br />
Bulgaria, Croatia, Poland, Serbia, Slovakia, Slovenia, Czech Republic, Hungary
Valuation Certificates<br />
<strong>Report</strong> by the Executive Board 261<br />
Highlights <strong>2006</strong>/<strong>07</strong><br />
Business Model and Strategy<br />
Portfolio Structure<br />
Corporate Governance and Outlook<br />
Property Portfolio<br />
Development of Business<br />
Consolidated Financial Statements<br />
Service and Glossary
262 <strong>IMMOEAST</strong> <strong>Annual</strong> <strong>Report</strong> <strong>2006</strong>/<strong>07</strong>
Valuation Certificates<br />
<strong>Report</strong> by the Executive Board 263<br />
Highlights <strong>2006</strong>/<strong>07</strong><br />
Business Model and Strategy<br />
Portfolio Structure<br />
Corporate Governance and Outlook<br />
Property Portfolio<br />
Development of Business<br />
Consolidated Financial Statements<br />
Service and Glossary
264 <strong>IMMOEAST</strong> <strong>Annual</strong> <strong>Report</strong> <strong>2006</strong>/<strong>07</strong><br />
Glossary<br />
ATX: Austrian Traded Index.<br />
ATX Prime: Includes all shares in the Prime Market segment<br />
of the Vienna Stock Exchange.<br />
Cash EBIT margin: Cash EBIT (=EBIT, depreciation, amortisation,<br />
revaluation of properties and reversal of negative<br />
goodwill).<br />
Cost model: IFRS accounting method for property, which<br />
is similar to the method required by the Austrian Commercial<br />
Code and calls for annual depreciation independent<br />
of fair value.<br />
DAX: German stock index.<br />
Discounted cash flow method: Method used to determine<br />
value through the discounting of payment flows.<br />
Diversification: Distribution of property investments<br />
among various sectors and geographic regions to minimise<br />
risk.<br />
Earnings per share: Net profit divided by the weighted<br />
average number of shares outstanding.<br />
EBIT: Earnings before interest and tax, or operating<br />
profit.<br />
EBT: Earnings before tax.<br />
EPRA: European Public Real Estate Association, an<br />
organisation of listed property companies in Europe.<br />
Fair value model: IFRS accounting method for property,<br />
which is based on actual realisable market value.<br />
Fair value: The market value of property as determined<br />
by the valuation committee.<br />
Gearing: Ratio of net debt to equity.<br />
GPR-15 Real Time Index: Global Property Research (GPR)<br />
prepares a stock index that covers the 15 largest listed<br />
property companies in Europe; of these companies, eight<br />
are located in Continental Europe.<br />
Gross cash flow: Increase or decrease in cash and cash<br />
equivalents arising from cash inflows and outflows during<br />
the business year.<br />
IAS 40: IAS 40 provides enterprises with an option for<br />
recording real estate held as investment property; companies<br />
may choose between a fair value model and a<br />
cost model (also see definitions of fair value model and<br />
cost model).<br />
IATX: Branch index for property stocks in the ATX.<br />
IFRS and IAS: International Financial <strong>Report</strong>ing Standards<br />
and International Accounting Standards.<br />
ISIN: International Security Identification Number (code<br />
number for stocks and bonds).<br />
Market capitalisation: The market value of a stock corporation<br />
(stock price x number of shares).<br />
MSCI World Index: Stock index published by Morgan<br />
Stanley Capital International (MSCI), which is based on<br />
roughly 2,000 stock prices from over 20 countries; in<br />
addition to a global index, MSCI also issues regional<br />
indexes (MSCI Europe Index).<br />
Net operating income (NOI): Direct payment flows allocated<br />
to a property, which are also used in determining<br />
its value.<br />
P/E ratio: Price/earnings ratio, an indicator of the market<br />
valuation of a stock.<br />
Stock performance: Development of the value of a<br />
stock.
Financial Calendar<br />
13 September 20<strong>07</strong><br />
8th <strong>Annual</strong> General Meeting<br />
14 September 20<strong>07</strong><br />
<strong>Report</strong> on the First Quarter as of 31 July 20<strong>07</strong><br />
20 December 20<strong>07</strong><br />
<strong>Report</strong> on the First Six Months as of 31 October 20<strong>07</strong><br />
20 March 2008<br />
<strong>Report</strong> on the First Three Quarters as of 31 January 2008<br />
Investor Relations Contact: Margit Hermentin<br />
Shareholders’ Telephone: +43/1/532 87 60-0<br />
E-Mail: investor@immoeast.com<br />
www.immoeast.com<br />
Imprint<br />
<strong>IMMOEAST</strong> AG<br />
Bankgasse 2<br />
A-1010 Vienna<br />
Phone: +43/1/532 87 60-0<br />
Fax: +43/1/532 87 60-760<br />
E-Mail: investor@immoeast.com<br />
www.immoeast.com<br />
Consulting and Coordination: BCA Mensalia<br />
Design: Büro X<br />
Photos: IMMOFInAnZ archive, Hanna Haböck, Herta Hurnaus<br />
Disclaimer:<br />
This annual report includes assumptions and forecasts that<br />
were based on information available up to the copy deadline on<br />
31 July 20<strong>07</strong>. If the assumptions underlying these forecasts are not<br />
realised or risks as described in the risk report should in fact<br />
occur, actual results may differ from the results expected at this<br />
time. This annual report does not represent a recommendation to<br />
buy or sell shares in <strong>IMMOEAST</strong> AG.
<strong>IMMOEAST</strong> AG<br />
Bankgasse 2<br />
A-1010 Vienna<br />
Phone: +43/1/532 87 60-0<br />
Fax: +43/1/532 87 60-760<br />
marketing@immoeast.com<br />
www.immoeast.com