Global Life Sciences Cluster Report 2011 - Jones Lang LaSalle
Global Life Sciences Cluster Report 2011 - Jones Lang LaSalle
Global Life Sciences Cluster Report 2011 - Jones Lang LaSalle

Create successful ePaper yourself
Turn your PDF publications into a flip-book with our unique Google optimized e-Paper software.
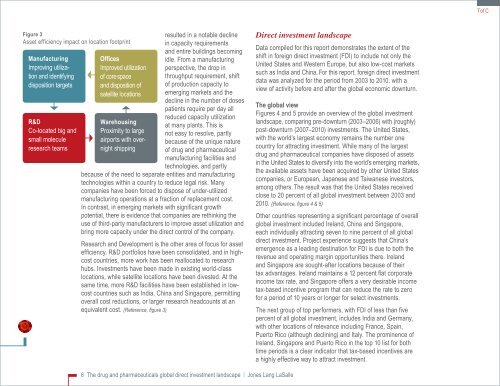
Figure 3<br />
Asset efficiency impact on location footprint<br />
Manufacturing<br />
Improving utilization<br />
and identifying<br />
disposition targets<br />
R&D<br />
Co-located big and<br />
small molecule<br />
research teams<br />
Offices<br />
Improved utilization<br />
of core space<br />
and disposition of<br />
satellite locations<br />
Warehousing<br />
Proximity to large<br />
airports with overnight<br />
shipping<br />
resulted in a notable decline<br />
in capacity requirements<br />
and entire buildings becoming<br />
idle. From a manufacturing<br />
perspective, the drop in<br />
throughput requirement, shift<br />
of production capacity to<br />
emerging markets and the<br />
decline in the number of doses<br />
patients require per day all<br />
reduced capacity utilization<br />
at many plants. This is<br />
not easy to resolve, partly<br />
because of the unique nature<br />
of drug and pharmaceutical<br />
manufacturing facilities and<br />
technologies, and partly<br />
because of the need to separate entities and manufacturing<br />
technologies within a country to reduce legal risk. Many<br />
companies have been forced to dispose of under-utilized<br />
manufacturing operations at a fraction of replacement cost.<br />
In contrast, in emerging markets with significant growth<br />
potential, there is evidence that companies are rethinking the<br />
use of third-party manufacturers to improve asset utilization and<br />
bring more capacity under the direct control of the company.<br />
Research and Development is the other area of focus for asset<br />
efficiency. R&D portfolios have been consolidated, and in highcost<br />
countries, more work has been reallocated to research<br />
hubs. Investments have been made in existing world-class<br />
locations, while satellite locations have been divested. At the<br />
same time, more R&D facilities have been established in lowcost<br />
countries such as India, China and Singapore, permitting<br />
overall cost reductions, or larger research headcounts at an<br />
equivalent cost. (Reference, figure 3)<br />
6 The drug and pharmaceuticals global direct investment landscape | <strong>Jones</strong> <strong>Lang</strong> <strong>LaSalle</strong><br />
Direct investment landscape<br />
Data compiled for this report demonstrates the extent of the<br />
shift in foreign direct investment (FDI) to include not only the<br />
United States and Western Europe, but also low-cost markets<br />
such as India and China. For this report, foreign direct investment<br />
data was analyzed for the period from 2003 to 2010, with a<br />
view of activity before and after the global economic downturn.<br />
The global view<br />
Figures 4 and 5 provide an overview of the global investment<br />
landscape, comparing pre-downturn (2003–2006) with (roughly)<br />
post-downturn (2007–2010) investments. The United States,<br />
with the world’s largest economy remains the number one<br />
country for attracting investment. While many of the largest<br />
drug and pharmaceutical companies have disposed of assets<br />
in the United States to diversify into the world’s emerging markets,<br />
the available assets have been acquired by other United States<br />
companies, or European, Japanese and Taiwanese investors,<br />
among others. The result was that the United States received<br />
close to 20 percent of all global investment between 2003 and<br />
2010. (Reference, figure 4 & 5)<br />
Other countries representing a significant percentage of overall<br />
global investment included Ireland, China and Singapore,<br />
each individually attracting seven to nine percent of all global<br />
direct investment. Project experience suggests that China’s<br />
emergence as a leading destination for FDI is due to both the<br />
revenue and operating margin opportunities there. Ireland<br />
and Singapore are sought-after locations because of their<br />
tax advantages. Ireland maintains a 12 percent flat corporate<br />
income tax rate, and Singapore offers a very desirable income<br />
tax-based incentive program that can reduce the rate to zero<br />
for a period of 10 years or longer for select investments.<br />
The next group of top performers, with FDI of less than five<br />
percent of all global investment, includes India and Germany,<br />
with other locations of relevance including France, Spain,<br />
Puerto Rico (although declining) and Italy. The prominence of<br />
Ireland, Singapore and Puerto Rico in the top 10 list for both<br />
time periods is a clear indicator that tax-based incentives are<br />
a highly effective way to attract investment.<br />
Tof C