QUEENSLAND PERFORMING ARTS CENTRE ANNUAL REPORT ...
QUEENSLAND PERFORMING ARTS CENTRE ANNUAL REPORT ...
QUEENSLAND PERFORMING ARTS CENTRE ANNUAL REPORT ...

You also want an ePaper? Increase the reach of your titles
YUMPU automatically turns print PDFs into web optimized ePapers that Google loves.
2011-2012 <strong>ANNUAL</strong> <strong>REPORT</strong><br />
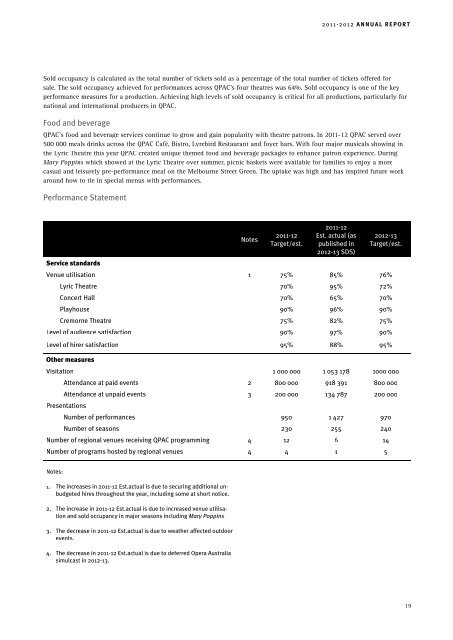
Sold occupancy is calculated as the total number of tickets sold as a percentage of the total number of tickets offered for<br />
sale. The sold occupancy achieved for performances across QPAC’s four theatres was 64%. Sold occupancy is one of the key<br />
performance measures for a production. Achieving high levels of sold occupancy is critical for all productions, particularly for<br />
national and international producers in QPAC.<br />
Food and beverage<br />
QPAC’s food and beverage services continue to grow and gain popularity with theatre patrons. In 2011-12 QPAC served over<br />
500 000 meals drinks across the QPAC Café, Bistro, Lyrebird Restaurant and foyer bars. With four major musicals showing in<br />
the Lyric Theatre this year QPAC created unique themed food and beverage packages to enhance patron experience. During<br />
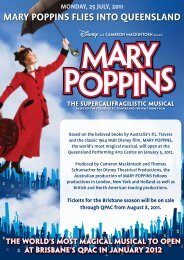
Mary Poppins which showed at the Lyric Theatre over summer, picnic baskets were available for families to enjoy a more<br />
casual and leisurely pre-performance meal on the Melbourne Street Green. The uptake was high and has inspired future work<br />
around how to tie in special menus with performances.<br />
Performance Statement<br />
Service standards<br />
Notes<br />
2011-12<br />
Target/est.<br />
2011-12<br />
Est. actual (as<br />
published in<br />
2012-13 SDS)<br />
2012-13<br />
Target/est.<br />
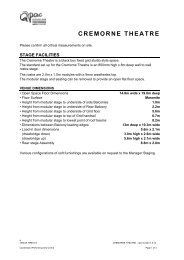
Venue utilisation 1 75% 85% 76%<br />
Lyric Theatre 70% 95% 72%<br />
Concert Hall 70% 65% 70%<br />
Playhouse 90% 96% 90%<br />
Cremorne Theatre 75% 82% 75%<br />
Level of audience satisfaction 90% 97% 90%<br />
Level of hirer satisfaction 95% 88% 95%<br />
Other measures<br />
Visitation 1 000 000 1 053 178 1000 000<br />
Attendance at paid events 2 800 000 918 391 800 000<br />
Attendance at unpaid events 3 200 000 134 787 200 000<br />
Presentations<br />
Number of performances 950 1 427 970<br />
Number of seasons 230 255 240<br />
Number of regional venues receiving QPAC programming 4 12 6 14<br />
Number of programs hosted by regional venues 4 4 1 5<br />
Notes:<br />
1. The increases in 2011-12 Est.actual is due to securing additional unbudgeted<br />
hires throughout the year, including some at short notice.<br />
2. The increase in 2011-12 Est.actual is due to increased venue utilisation<br />
and sold occupancy in major seasons including Mary Poppins.<br />
3. The decrease in 2011-12 Est.actual is due to weather affected outdoor<br />
events.<br />
4. The decrease in 2011-12 Est.actual is due to deferred Opera Australia<br />
simulcast in 2012-13.<br />
19