- Page 1 and 2: Purchasing Intentions and Behavior
- Page 3 and 4: Dedication This work is dedicated t
- Page 5 and 6: Abstract This research is a study o
- Page 7 and 8: List of Acronyms CE - Consumer Ethn
- Page 9 and 10: 2.2.3 The Brand as Providing a Func
- Page 11 and 12: 5.0 Introduction ..................
- Page 13 and 14: 7.5.11 Banks (ATMs) ...............
- Page 15 and 16: A1.9 Summary ......................
- Page 17 and 18: Appendix VII. Main Consumer Survey
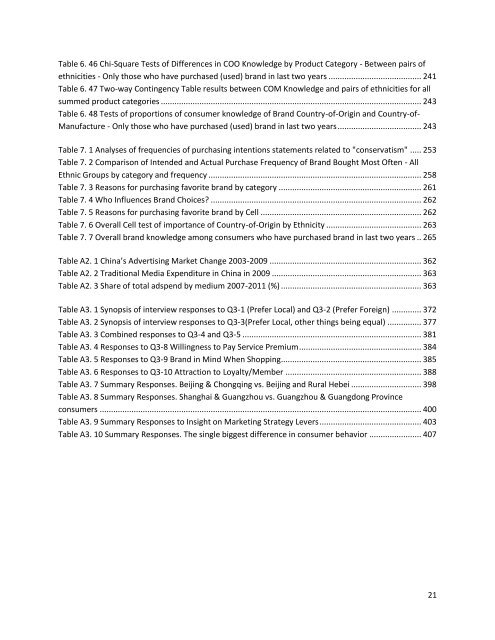
- Page 19: List of Tables Table 5. 1 Pre-teste
- Page 23 and 24: 1.1 Background of Study Once the Ch
- Page 25 and 26: The role that culture plays in gene
- Page 27 and 28: Understanding how to enhance brand
- Page 29 and 30: � Chapter 8 -Summary, Implication
- Page 31 and 32: chips, and ice cream tubs). In Cell
- Page 33 and 34: 2. Managerial and Consumer Perspect
- Page 35 and 36: "non-rational" elements as this alt
- Page 37 and 38: trajectory will angle upward. The l
- Page 39 and 40: determinants of purchase intention,
- Page 41 and 42: line according to a similar taxonom
- Page 43 and 44: objects, or issues (Solomon et al,
- Page 45 and 46: Figure 2. 2 The Tri-components mode
- Page 47 and 48: identifying a set of attributes, we
- Page 49 and 50: them. According to the theory, AACT
- Page 51 and 52: The Theory of Planned Behavior inte
- Page 53 and 54: 2.12 Attitudes toward the advertise
- Page 55 and 56: Figure 2. 5 An adapted multi-attrib
- Page 57 and 58: and (Laurent and Kapferer, 1985). W
- Page 59 and 60: and by consumers’ reactions towar
- Page 61 and 62: 1993). Papadopoulos et al (1993) de
- Page 63 and 64: Figure 2. 8 The Halo Effect of the
- Page 65 and 66: ehavior acted upon perception of br
- Page 67 and 68: However, even though many consumers
- Page 69 and 70: others. This may confuse consumers
- Page 71 and 72:
products (Kaynak and Kara, 2002). A
- Page 73 and 74:
Figure 2. 9 Four broad categories o
- Page 75 and 76:
matrix was presented as the model u
- Page 77 and 78:
aspects, Chinese consumers generall
- Page 79 and 80:
Howard and Sheth (1969) discussed t
- Page 81 and 82:
3.1.3 Hofstede Cultural Dimensions
- Page 83 and 84:
power distant context may be more l
- Page 85 and 86:
tend to be more rational and keep t
- Page 87 and 88:
countries. This has been termed “
- Page 89 and 90:
One of the limitations of Maslow’
- Page 91 and 92:
4. A Framework of brand choice 4.0
- Page 93 and 94:
Figure 4. 1 Engel-Kollat-Blackwell
- Page 95 and 96:
main theoretical foundation for thi
- Page 97 and 98:
The socio-cultural environmental in
- Page 99 and 100:
consists of two parents and one chi
- Page 101 and 102:
ehavior to remain. Yet, with the ve
- Page 103 and 104:
SRQ 1.1.1a.1: Is the intention to p
- Page 105 and 106:
RP 1.1.5: Chinese consumers’ purc
- Page 107 and 108:
RP 1.2.4: The importance of store l
- Page 109 and 110:
inconvenient activity. Beijing's va
- Page 111 and 112:
In our study we investigated the br
- Page 113 and 114:
SRQ 4.1: Do consumers in Guangzhou
- Page 115 and 116:
RP 5.4.0: Chinese consumers are not
- Page 117 and 118:
5. Research Methodology 5.0 Introdu
- Page 119 and 120:
Figure 5. 1 Research Methodology Su
- Page 121 and 122:
with a sample size of between fifty
- Page 123 and 124:
Figure 5. 2 Product Categories for
- Page 125 and 126:
follow-up emails, where applicable,
- Page 127 and 128:
Low Functionality/ Low Representati
- Page 129 and 130:
product category's COO higher than
- Page 131 and 132:
We can see that for product categor
- Page 133 and 134:
the case of household appliances, S
- Page 135 and 136:
Table 5. 8 Selection of brands used
- Page 137 and 138:
Table 5. 9 Expected versus Actual Q
- Page 139 and 140:
5.7 Expert Interviews Marketing exp
- Page 141 and 142:
5.7.1 Results of the Pre-test of Ma
- Page 143 and 144:
esult in high internal validity but
- Page 145 and 146:
6.3 Data Analyses Data analyses wer
- Page 147 and 148:
19 When a new brand of an existing
- Page 149 and 150:
13 price for an unknown brand. My f
- Page 151 and 152:
Table 6. 4 Tests of importance for
- Page 153 and 154:
Table 6. 5 ANOVAs Between Ethnicity
- Page 155 and 156:
Table 6. 6 Summary of Fisher's LSD
- Page 157 and 158:
Table 6. 7 Two Sample Test of Hypot
- Page 159 and 160:
1.1.1 Conservatism: Ethnocentrism i
- Page 161 and 162:
Proposition # Specific Research Que
- Page 163 and 164:
Proposition 1.1.2a, which states th
- Page 165 and 166:
Proposition 1.1.3, which states tha
- Page 167 and 168:
Propositions Specific Research Ques
- Page 169 and 170:
We argued that a "conservative" con
- Page 171 and 172:
important service component, there
- Page 173 and 174:
member/loyalty cards more often tha
- Page 175 and 176:
Consumers from the key cities studi
- Page 177 and 178:
Table 6. 16 Pair-wise tests of sign
- Page 179 and 180:
Table 6. 17 Frequency of Purchase (
- Page 181 and 182:
Table 6. 19 Frequency of Purchase (
- Page 183 and 184:
Based on Cramer's V, the strength o
- Page 185 and 186:
GRQ 2.0: Brand choice and ethnicity
- Page 187 and 188:
four categories there is a very str
- Page 189 and 190:
Table 6. 24 Percentage of urban con
- Page 191 and 192:
Brands by category Beijing Shanghai
- Page 193 and 194:
small to medium effect with respect
- Page 195 and 196:
12 categories for Chongqing consume
- Page 197 and 198:
Beijing Shanghai Chongqing Guangzho
- Page 199 and 200:
table highlights that quality overa
- Page 201 and 202:
the least frequent purchases. Perfu
- Page 203 and 204:
Table 6. 30 Actual Percentage of Co
- Page 205 and 206:
The general research question askin
- Page 207 and 208:
Table 6. 33 Means of Importance of
- Page 209 and 210:
Using Cramer's V to measure the str
- Page 211 and 212:
Specific Research Questions Proposi
- Page 213 and 214:
Table 6. 37 Consumer Knowledge of B
- Page 215 and 216:
Brand % Correct Country of origin C
- Page 217 and 218:
With respect to Leconte, many respo
- Page 219 and 220:
Brand % Correct Country of origin C
- Page 221 and 222:
To determine if those who recently
- Page 223 and 224:
H0: Are those urban consumers who b
- Page 225 and 226:
H0: Are those urban consumers who b
- Page 227 and 228:
no differences between COO and COM
- Page 229 and 230:
H0: Are consumers more aware of COM
- Page 231 and 232:
Table 6.41 summarizes results by in
- Page 233 and 234:
Statistically significant differenc
- Page 235 and 236:
% Correct responses Brand/Ethnicity
- Page 237 and 238:
% Correct responses Brand/Ethnicity
- Page 239 and 240:
Table 6. 45 Two-way Contingency Tab
- Page 241 and 242:
Table 6. 46 Chi-Square Tests of Dif
- Page 243 and 244:
Table 6. 47 Two-way Contingency Tab
- Page 245 and 246:
H0: p1 ≤ p2 ;H1: p1 > p2; z=1.65
- Page 247 and 248:
are misinformed as to the correct C
- Page 249 and 250:
Marketers, moreover, need to be war
- Page 251 and 252:
definitive nature of the survey que
- Page 253 and 254:
With respect to the fourth dimensio
- Page 255 and 256:
Population density likely accounts
- Page 257 and 258:
2006; Wakefield and Inman, 2003; En
- Page 259 and 260:
7.4 Brand Choice (RQ 2.0) This sect
- Page 261 and 262:
Table 7. 3 Reasons for purchasing f
- Page 263 and 264:
influenced. Melewar et al (2004) si
- Page 265 and 266:
Table 7. 7 Overall brand knowledge
- Page 267 and 268:
more than 70 imported or joint vent
- Page 269 and 270:
domestic brands and partly because
- Page 271 and 272:
8. Summary, Implications, and Concl
- Page 273 and 274:
8.1.4. Actual purchase frequency
- Page 275 and 276:
their segmentation and targeting st
- Page 277 and 278:
Ideally the main person responsible
- Page 279 and 280:
counterparts; yet, the interviewee
- Page 281 and 282:
promotions and marketing, differenc
- Page 283 and 284:
8.5.8 Situational factors impacting
- Page 285 and 286:
Anderson, D.R., Sweeney, D.J. & Wil
- Page 287 and 288:
Bettman, J.R. (1970) Information pr
- Page 289 and 290:
Chen, C.H. and Zimitat, C. (2006) U
- Page 291 and 292:
Czinkota, M.R. and Ronkainen, I.A.
- Page 293 and 294:
Ehrenberg, A., Goodhardt, G. & Barw
- Page 295 and 296:
Goffman, E. (1967) Interaction Ritu
- Page 297 and 298:
Hofstede, G. (2001) Culture's Conse
- Page 299 and 300:
Insch G.S. (2003) The Impact of Cou
- Page 301 and 302:
Kluckhohn, C. and F.L. Strodtbeck (
- Page 303 and 304:
Li, J.J. and Su, C. (2007) How Face
- Page 305 and 306:
[Accessed 3 April 2010). McShane, S
- Page 307 and 308:
innovation diffusion: The case of J
- Page 309 and 310:
Perrin, R. and Gong, Y. (2010) Uniq
- Page 311 and 312:
Samiee, S. (1994) Custumer evaluati
- Page 313 and 314:
Su, Y., Xu, D. & Phan, P.H. (2008)
- Page 315 and 316:
Verlegh, P.W. and Steenkamp, J.B. (
- Page 317 and 318:
Wu, K. (1998) Sociology of Educatio
- Page 319 and 320:
Appendix I. The Chinese Marketing E
- Page 321 and 322:
Confucius was not particularly inte
- Page 323 and 324:
China from their bases in Manchuria
- Page 325 and 326:
Figure A1. 1 Administrative Divisio
- Page 327 and 328:
Table A1. 1 Population and Its Comp
- Page 329 and 330:
levels of domestic and internationa
- Page 331 and 332:
Table A1. 4 GDP and Population Dens
- Page 333 and 334:
middle south regions and below nati
- Page 335 and 336:
world’s third-largest economy). B
- Page 337 and 338:
337 Countries Market Size Market Gr
- Page 339 and 340:
Table A1. 6 Year to Year Comparison
- Page 341 and 342:
Table A1. 7 Dimensions and Measures
- Page 343 and 344:
internet access exists but some cen
- Page 345 and 346:
certifications, such as a license.
- Page 347 and 348:
Table A1. 8 Business Monitor Intern
- Page 349 and 350:
China’s political environment is
- Page 351 and 352:
and makers to reduce the stigma of
- Page 353 and 354:
making comparisons between differen
- Page 355 and 356:
2007). Each of the populations in t
- Page 357 and 358:
Walmart in 2007, who explained that
- Page 359 and 360:
From a manufacturer's perspective,
- Page 361 and 362:
among others as well as China's own
- Page 363 and 364:
Table A2. 2 Traditional Media Expen
- Page 365 and 366:
The size of China's online display
- Page 367 and 368:
Appendix III. Industry Interviews -
- Page 369 and 370:
A3.3. Q3-2 Do Chinese consumers try
- Page 371 and 372:
cigarettes."; "Older people prefer
- Page 373 and 374:
a bias toward foreign brands due to
- Page 375 and 376:
guarantee or promise of good qualit
- Page 377 and 378:
Table A3. 2 Synopsis of interview r
- Page 379 and 380:
A3.6. Q3-5 Are Chinese consumers sl
- Page 381 and 382:
Table A3. 3 Combined responses to Q
- Page 383 and 384:
products even for foreign brands bu
- Page 385 and 386:
A3.10. Q3-9 Do Chinese consumers ge
- Page 387 and 388:
deposit or some stores don't allow
- Page 389 and 390:
their related product categories. P
- Page 391 and 392:
agreement that Beijing consumers ar
- Page 393 and 394:
administration and white-collar wor
- Page 395 and 396:
� Shanghai and Guangzhou consumer
- Page 397 and 398:
trying new products). Thus, consump
- Page 399 and 400:
A3.14. Q4-3 Would you consider urba
- Page 401 and 402:
Response No. of expert mentions* Ye
- Page 403 and 404:
Experts also unanimously agreed tha
- Page 405 and 406:
Strategy lever Useful Insights Pric
- Page 407 and 408:
awareness of brand names, relative
- Page 409 and 410:
Appendix IV. Research Consent Forms
- Page 411 and 412:
A4.2 Research Consent Form - Depth
- Page 413 and 414:
Appendix V. Survey of Consumer Bran
- Page 415 and 416:
Bottled Water 矿泉水或纯净水
- Page 417 and 418:
Ice Cream Tubs 冰淇淋浴盆 Yes
- Page 419 and 420:
Potato Chips (Crisps) 薯片(脆片
- Page 421 and 422:
Household Appliances (refrigerators
- Page 423 and 424:
Airlines 航空公司 1. Singapore
- Page 425 and 426:
Appendix VI. Specification of brand
- Page 427 and 428:
11. Banks (including ATMs) 中国
- Page 429 and 430:
消费者购买行为调查 请根
- Page 431 and 432:
C 对于以下品牌产品当中,
- Page 433 and 434:
C 对于以下品牌产品当中,
- Page 435 and 436:
品牌之间的关系 如下所示,
- Page 437 and 438:
品牌之间的关系 如下所示,
- Page 439 and 440:
品牌之间的关系 如下所示,
- Page 441 and 442:
Appendix VIII. Main Consumer Behavi
- Page 443 and 444:
II. Relationship to Product Categor
- Page 445 and 446:
III. Relationship to Brands C Speci
- Page 447 and 448:
III. Relationship to Brands C Speci
- Page 449 and 450:
III. Relationship to Brands C Speci
- Page 451 and 452:
COO/COM 品牌之间的关系 3. To
- Page 453 and 454:
453 7. Perfume 香水 兰蔻Lancome
- Page 455 and 456:
COO/COM 品牌之间的关系 11. B
- Page 457 and 458:
Appendix IX. Interview Guide for Ma
- Page 459 and 460:
3.2. Would you consider consumers i
- Page 461 and 462:
potential sampling (Type I) error b
- Page 463 and 464:
A10.9 Coefficients of Correlation F
- Page 465 and 466:
The main general research questions
- Page 467 and 468:
The main general research questions
- Page 469 and 470:
Study(Year) Country Findings Jordan
- Page 471 and 472:
Appendix XIV. Brand Choice - Other
- Page 473 and 474:
Category Brand Beijing Shanghai Cho
- Page 475 and 476:
Appendix XV. Unique Promotional App
- Page 477 and 478:
Distribution of shopping discount c
- Page 479 and 480:
479
- Page 481 and 482:
481
- Page 483 and 484:
483
- Page 485 and 486:
485
- Page 487 and 488:
487
- Page 489 and 490:
489
- Page 491 and 492:
491
- Page 493 and 494:
with negative rhetoric and pejorati
- Page 495 and 496:
literature where consumers consider
- Page 497 and 498:
correctly point out that their stud
- Page 499 and 500:
quite difficult to research the mod
- Page 501 and 502:
dissuades them from accepting brand
- Page 503:
esponsibility and argued that socia