- Page 1: Biostatistics for Animal Science
- Page 4 and 5: CABI Publishing is a division of CA
- Page 6 and 7: vi Biostatistics for Animal Science
- Page 8 and 9: viii Biostatistics for Animal Scien
- Page 10 and 11: x Biostatistics for Animal Science
- Page 12 and 13: Preface This book was written to se
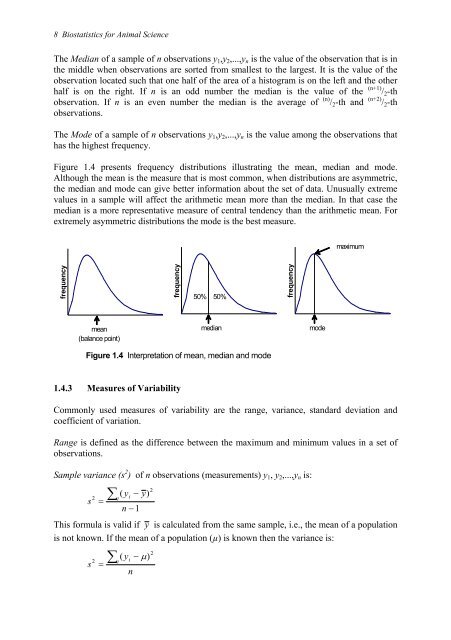
- Page 15 and 16: Chapter 1 Presenting and Summarizin
- Page 17 and 18: Brown 5% Simmental 76% Holstein 19%
- Page 19 and 20: Number of calves 18 16 14 12 10 8 6
- Page 21: Σi y 2 i = 1 2 + 3 2 + 6 2 = 46 Co
- Page 25 and 26: 1.4.5 Measures of Relative Position
- Page 27 and 28: Chapter 1 Presenting and Summarizin
- Page 29 and 30: Chapter 2 Probability The word prob
- Page 31 and 32: 2.2.1 Multiplicative Rule Chapter 2
- Page 33 and 34: Chapter 2 Probability 19 event. As
- Page 35 and 36: Chapter 2 Probability 21 P(A ∩ B)
- Page 37 and 38: 2.4 Bayes Theorem First calf Second
- Page 39 and 40: We define: P(A1) = 0.6 is the proba
- Page 41 and 42: Chapter 3 Random Variables and thei
- Page 43 and 44: Chapter 3 Random Variables and thei
- Page 45 and 46: 3.2.3 Binomial Distribution Chapter
- Page 47 and 48: ⎛10⎞ 0 10 0 10 b) P ( y = 0) =
- Page 49 and 50: E(y) = µ = λ and Var(y) = σ 2 =
- Page 51 and 52: Chapter 3 Random Variables and thei
- Page 53 and 54: 2.5% µ−1.96σ µ−σ µ µ+σ F
- Page 55 and 56: Chapter 3 Random Variables and thei
- Page 57 and 58: Chapter 3 Random Variables and thei
- Page 59 and 60: Chapter 3 Random Variables and thei
- Page 61 and 62: e f ( y) = − 1 2 −1 ( y −µ )
- Page 63 and 64: Chapter 3 Random Variables and thei
- Page 65 and 66: The expectation and variance of the
- Page 67 and 68: Chapter 4 Population and Sample A p
- Page 69 and 70: Chapter 4 Population and Sample 55
- Page 71 and 72: 5.2 Maximum Likelihood Estimation C
- Page 73 and 74:
Chapter 5 Estimation of Parameters
- Page 75 and 76:
By setting both terms to zero the e
- Page 77 and 78:
Chapter 5 Estimation of Parameters
- Page 79 and 80:
Chapter 6 Hypothesis Testing The fo
- Page 81 and 82:
µ 0 y − z ≈ s n Chapter 6 Hypo
- Page 83 and 84:
Known values are: y = 4000 kg σ =
- Page 85 and 86:
α -zα Figure 6.7 The critical val
- Page 87 and 88:
s( y 1− y2 ) = 2 s1 s + n n 1 2 2
- Page 89 and 90:
The estimated pooled variance is: s
- Page 91 and 92:
Chapter 6 Hypothesis Testing 77 tha
- Page 93 and 94:
( y − y2 ) − 0 ( 11. 857 − 21
- Page 95 and 96:
Normal Approximation Z 2.0626 One-S
- Page 97 and 98:
pˆ − pˆ 1 The estimator has var
- Page 99 and 100:
2 χ [ yi E( yi ) ] E( y ) ∑ −
- Page 101 and 102:
∑ ∑ y i i p0 = i = 1,..., k n i
- Page 103 and 104:
Chapter 6 Hypothesis Testing 89 Exp
- Page 105 and 106:
Chapter 6 Hypothesis Testing 91 An
- Page 107 and 108:
Decision of a statistical test H 0
- Page 109 and 110:
Chapter 6 Hypothesis Testing 95 nor
- Page 111 and 112:
Chapter 6 Hypothesis Testing 97 One
- Page 113 and 114:
0.45 0.40 0.35 0.30 0.25 0.20 0.15
- Page 115 and 116:
SAS output: alpha n mi0 mi1 stdev d
- Page 117 and 118:
6.12 Sample Size Chapter 6 Hypothes
- Page 119 and 120:
SAS program: DATA a; DO n = 2 TO 10
- Page 121 and 122:
Chapter 6 Hypothesis Testing 107 PR
- Page 123 and 124:
Chapter 7 Simple Linear Regression
- Page 125 and 126:
The measurements of the dependent v
- Page 127 and 128:
Chapter 7 Simple Linear Regression
- Page 129 and 130:
Chapter 7 Simple Linear Regression
- Page 131 and 132:
Chapter 7 Simple Linear Regression
- Page 133 and 134:
Chapter 7 Simple Linear Regression
- Page 135 and 136:
2 SSRES s = = MSRES = 115. 826 n
- Page 137 and 138:
Confidence intervals follow the cla
- Page 139 and 140:
spread yi about y A) y y * * * * *
- Page 141 and 142:
SS REG ( SSxy ) = SS xx 2 Chapter 7
- Page 143 and 144:
E(MSREG) = σ 2 + β1 2 SSxx Chapte
- Page 145 and 146:
The likelihood function when H0 is
- Page 147 and 148:
2 R = SS SS REG TOT Chapter 7 Simpl
- Page 149 and 150:
Chapter 7 Simple Linear Regression
- Page 151 and 152:
Chapter 7 Simple Linear Regression
- Page 153 and 154:
= (X'X) -1 X'y A maximum likelihood
- Page 155 and 156:
Chapter 7 Simple Linear Regression
- Page 157 and 158:
DATA a; alpha=0.05; n=6; b=7.52941;
- Page 159 and 160:
Chapter 7 Simple Linear Regression
- Page 161 and 162:
Chapter 8 Correlation 147 of correl
- Page 163 and 164:
has a t-distribution with (n - 2) d
- Page 165 and 166:
Chapter 8 Correlation 151 under H0:
- Page 167 and 168:
Exercises Chapter 8 Correlation 153
- Page 169 and 170:
The assumptions of the model are: 1
- Page 171 and 172:
where: Chapter 9 Multiple Linear Re
- Page 173 and 174:
The residual mean square, which is
- Page 175 and 176:
The null and alternative hypotheses
- Page 177 and 178:
Chapter 9 Multiple Linear Regressio
- Page 179 and 180:
Chapter 9 Multiple Linear Regressio
- Page 181 and 182:
yi = the weight of bull i x1i = the
- Page 183 and 184:
SAS program: DATA bulls; INPUT weig
- Page 185 and 186:
Chapter 9 Multiple Linear Regressio
- Page 187 and 188:
9.6.1 Analysis of Residuals Chapter
- Page 189 and 190:
y * * 1 * * * * * * * * * 2 * * * 4
- Page 191 and 192:
where: Chapter 9 Multiple Linear Re
- Page 193 and 194:
SAS program: DATA bull; INPUT weigh
- Page 195 and 196:
Chapter 9 Multiple Linear Regressio
- Page 197 and 198:
where: SSRES = residual mean square
- Page 199 and 200:
Chapter 10 Curvilinear Regression I
- Page 201 and 202:
Chapter 10 Curvilinear Regression 1
- Page 203 and 204:
The variance estimate is s 2 = 210.
- Page 205 and 206:
Chapter 10 Curvilinear Regression 1
- Page 207 and 208:
SAS program: DATA a; INPUT age weig
- Page 209 and 210:
Chapter 10 Curvilinear Regression 1
- Page 211 and 212:
Weight (g) 1000 800 600 400 200 0 0
- Page 213 and 214:
Chapter 10 Curvilinear Regression 1
- Page 215 and 216:
Chapter 10 Curvilinear Regression 2
- Page 217 and 218:
Chapter 10 Curvilinear Regression 2
- Page 219 and 220:
Chapter 11 One-way Analysis of Vari
- Page 221 and 222:
From the assumptions it follows: Ch
- Page 223 and 224:
By defining: SS SS SS TOT TRT RES =
- Page 225 and 226:
Chapter 11 One-way Analysis of Vari
- Page 227 and 228:
1) Total sum: Σi Σj yij = (270 +
- Page 229 and 230:
2 L( µ , σ | y) = The log likelih
- Page 231 and 232:
And as shown previously: Thus: 2
- Page 233 and 234:
Chapter 11 One-way Analysis of Vari
- Page 235 and 236:
The hypotheses can be tested using
- Page 237 and 238:
ANOVA table: Chapter 11 One-way Ana
- Page 239 and 240:
F 3 = 2890 2 296. 67 = 4. 871 Chapt
- Page 241 and 242:
SAS output: Chapter 11 One-way Anal
- Page 243 and 244:
Chapter 11 One-way Analysis of Vari
- Page 245 and 246:
Chapter 11 One-way Analysis of Vari
- Page 247 and 248:
Chapter 11 One-way Analysis of Vari
- Page 249 and 250:
Chapter 11 One-way Analysis of Vari
- Page 251 and 252:
The effect of sow 1 is: ˆ 1 τ = 0
- Page 253 and 254:
Chapter 11 One-way Analysis of Vari
- Page 255 and 256:
The log likelihood that is to be ma
- Page 257 and 258:
Solution for Random Effects Chapter
- Page 259 and 260:
11.3.1.2 Estimating Parameters Chap
- Page 261 and 262:
Chapter 11 One-way Analysis of Vari
- Page 263 and 264:
The sums of squares needed for test
- Page 265 and 266:
The Xr'Xr matrix and its inverse ar
- Page 267 and 268:
11.3.2 The Random Effects Model 11.
- Page 269 and 270:
Chapter 11 One-way Analysis of Vari
- Page 271 and 272:
11.3.2.4 Restricted Maximum Likelih
- Page 273 and 274:
Chapter 11 One-way Analysis of Vari
- Page 275 and 276:
Chapter 11 One-way Analysis of Vari
- Page 277 and 278:
Chapter 12 Concepts of Experimental
- Page 279 and 280:
Chapter 12 Concepts of Experimental
- Page 281 and 282:
Chapter 12 Concepts of Experimental
- Page 283 and 284:
12.5 Required Number of Replication
- Page 285 and 286:
SAS output: alfa df1 df2 n power 0.
- Page 287 and 288:
Chapter 13 Blocking 273 environment
- Page 289 and 290:
1) Total sum: Σi Σj yij 2) Correc
- Page 291 and 292:
Chapter 13 Blocking 277 Example: Th
- Page 293 and 294:
13.1.3 SAS Example for Block Design
- Page 295 and 296:
Animal No. (Treatment) Blocks I II
- Page 297 and 298:
Mean square for treatments: Mean sq
- Page 299 and 300:
= s y − y MS ij . i' j' . RES ⎛
- Page 301 and 302:
1347. 90 F = = 7. 67 175. 83 F test
- Page 303 and 304:
Dependent Variable: d_gain i/j 1 2
- Page 305 and 306:
Chapter 13 Blocking 291 the adjuste
- Page 307 and 308:
Exercises Chapter 13 Blocking 293 1
- Page 309 and 310:
µ = the overall mean τi = the fix
- Page 311 and 312:
BLOCK II The hypotheses are: Chapte
- Page 313 and 314:
The results are shown in the ANOVA
- Page 315 and 316:
Chapter 14 Change-over Designs 301
- Page 317 and 318:
3) Total (corrected) sum of squares
- Page 319 and 320:
3) Total (corrected) sum of squares
- Page 321 and 322:
Least Squares Means Adjustment for
- Page 323 and 324:
Chapter 14 Change-over Designs 309
- Page 325 and 326:
Chapter 14 Change-over Designs 311
- Page 327 and 328:
Chapter 15 Factorial Experiments A
- Page 329 and 330:
1) Total sum: Σi Σj Σk yijk 2) C
- Page 331 and 332:
Chapter 15 Factorial Experiments 31
- Page 333 and 334:
5) Sum of squares for vitamin II: (
- Page 335 and 336:
Chapter 15 Factorial Experiments 32
- Page 337 and 338:
Chapter 16 Hierarchical or Nested D
- Page 339 and 340:
6) Sum of squares within factor B (
- Page 341 and 342:
3) Total sum of squares: Chapter 16
- Page 343 and 344:
SAS output of the NESTED procedure:
- Page 345 and 346:
Chapter 17 More about Blocking If t
- Page 347 and 348:
Chapter 17 More about Blocking 333
- Page 349 and 350:
SAS program: DATA steer; INPUT pen
- Page 351 and 352:
SAS output of the GLM procedure: De
- Page 353 and 354:
Chapter 17 More about Blocking 339
- Page 355 and 356:
The ANOVA table is: Source Degrees
- Page 357 and 358:
The model for this design is: where
- Page 359 and 360:
Chapter 18 Split-plot Design 345 su
- Page 361 and 362:
Least Squares Means Chapter 18 Spli
- Page 363 and 364:
Source Degrees of freedom Factor A
- Page 365 and 366:
Effects Means Estimators Standard e
- Page 367 and 368:
Chapter 18 Split-plot Design 353 Ex
- Page 369 and 370:
Chapter 19 Analysis of Covariance A
- Page 371 and 372:
DATA gain; INPUT treatment $ initia
- Page 373 and 374:
Chapter 19 Analysis of Covariance 3
- Page 375 and 376:
For males (M) the model is: E(yi) =
- Page 377 and 378:
Chapter 19 Analysis of Covariance 3
- Page 379 and 380:
Chapter 20 Repeated Measures Experi
- Page 381 and 382:
Chapter 20 Repeated Measures 367 Ex
- Page 383 and 384:
8 9 1 1.3 8 10 1 1.3 8 11 1 1.3 8 1
- Page 385 and 386:
SAS output: Covariance Parameter Es
- Page 387 and 388:
where: Chapter 20 Repeated Measures
- Page 389 and 390:
Chapter 20 Repeated Measures 375 Ex
- Page 391 and 392:
σ ⎡ σ b σ ⎡ ⎤ 0 b0b1 [ 1 t
- Page 393 and 394:
⎡1 ⎢ ⎢ 1 R ˆ = ⎢1 ⎢ ⎣1
- Page 395 and 396:
⎡1 ⎢ ˆR ⎢ 1 = ⎢1 ⎢ ⎣1
- Page 397 and 398:
Chapter 20 Repeated Measures 383
- Page 399 and 400:
Chapter 21 Analysis of Numerical Tr
- Page 401 and 402:
Chapter 21 Analysis of Numerical Tr
- Page 403 and 404:
Chapter 21 Analysis of Numerical Tr
- Page 405 and 406:
21.2.1 SAS Example for Polynomial C
- Page 407 and 408:
Chapter 21 Analysis of Numerical Tr
- Page 409 and 410:
Chapter 22 Discrete Dependent Varia
- Page 411 and 412:
Chapter 22 Discrete Dependent Varia
- Page 413 and 414:
where: pi = the proportion with mas
- Page 415 and 416:
Chapter 22 Discrete Dependent Varia
- Page 417 and 418:
Analysis Of Parameter Estimates Cha
- Page 419 and 420:
SAS program: DATA a; INPUT n y farm
- Page 421 and 422:
Chapter 22 Discrete Dependent Varia
- Page 423 and 424:
Farm The model is: where: Total no.
- Page 425 and 426:
LR Statistics For Type 1 Analysis C
- Page 427 and 428:
Chapter 22 Discrete Dependent Varia
- Page 429 and 430:
Chapter 22 Discrete Dependent Varia
- Page 431 and 432:
Chapter 22 Discrete Dependent Varia
- Page 433 and 434:
Solutions of Exercises 1.1. Mean =
- Page 435 and 436:
Appendix A: Vectors and Matrices A
- Page 437 and 438:
⎡a A + B = ⎢ ⎢ a ⎢⎣ a A +
- Page 439 and 440:
a = (X'X) -1 X'y Appendix A: Vector
- Page 441 and 442:
Critical Values of Student t Distri
- Page 443 and 444:
Critical Values of Chi-square Distr
- Page 445 and 446:
Critical Values of F Distributions,
- Page 447 and 448:
Critical Value of F Distributions,
- Page 449 and 450:
Critical Values of the Studentized
- Page 451 and 452:
References 437 Gianola, D. and Hamm
- Page 453 and 454:
Subject Index accuracy, 266 Akaike
- Page 455 and 456:
y hypothesis testing, 56 by paramet
- Page 457 and 458:
hypothesis test, 186 t test, 186 ra
- Page 459:
of regression estimators, 119, 159