Nutrition in the First 1,000 Days - Save the Children
Nutrition in the First 1,000 Days - Save the Children
Nutrition in the First 1,000 Days - Save the Children

You also want an ePaper? Increase the reach of your titles
YUMPU automatically turns print PDFs into web optimized ePapers that Google loves.
<strong>Nutrition</strong> <strong>in</strong> <strong>the</strong> <strong>First</strong> 1,<strong>000</strong> <strong>Days</strong><br />
State of <strong>the</strong> World’s Mo<strong>the</strong>rs 2012
Contents<br />
Foreword by Dr. rajiv Shah . . . . . . . . . . . . . . . . . . . . . . . . . . . . . . . . . . . . . . . . . . . . . . . . . . . 2<br />
<strong>in</strong>troduction by carolyn Miles . . . . . . . . . . . . . . . . . . . . . . . . . . . . . . . . . . . . . . . . . . . . . . . . . 3<br />
executive Summary: Key F<strong>in</strong>d<strong>in</strong>gs and recommendations . . . . . . . . . . . . . . . . . . . . . . . 5<br />
Why Focus on <strong>the</strong> <strong>First</strong> 1,<strong>000</strong> <strong>Days</strong>? . . . . . . . . . . . . . . . . . . . . . . . . . . . . . . . . . . . . . . . . . . 11<br />
<strong>the</strong> global Malnutrition crisis . . . . . . . . . . . . . . . . . . . . . . . . . . . . . . . . . . . . . . . . . . . . . . . 15<br />
Sav<strong>in</strong>g lives and Build<strong>in</strong>g a Better Future: low-cost Solutions that Work . . . . . 23<br />
• <strong>the</strong> lifesav<strong>in</strong>g Six . . . . . . . . . . . . . . . . . . . . . . . . . . . . . . . . . . . . . . . . . . . . . . . . . . . . . . . . . 23<br />
• <strong>in</strong>fant and toddler Feed<strong>in</strong>g Scorecard . . . . . . . . . . . . . . . . . . . . . . . . . . . . . . . . . . . . . 26<br />
• health Workers are Key to Success . . . . . . . . . . . . . . . . . . . . . . . . . . . . . . . . . . . . . . 32<br />
Breastfeed<strong>in</strong>g <strong>in</strong> <strong>the</strong> <strong>in</strong>dustrialized World . . . . . . . . . . . . . . . . . . . . . . . . . . . . . . . . . . . . . 39<br />
take action Now . . . . . . . . . . . . . . . . . . . . . . . . . . . . . . . . . . . . . . . . . . . . . . . . . . . . . . . . . . . . 45<br />
appendix: 13th annual Mo<strong>the</strong>rs’ <strong>in</strong>dex and country rank<strong>in</strong>gs . . . . . . . . . . . . . . . . . 47<br />
Methodology and research Notes . . . . . . . . . . . . . . . . . . . . . . . . . . . . . . . . . . . . . . . . . . . . 53<br />
endnotes . . . . . . . . . . . . . . . . . . . . . . . . . . . . . . . . . . . . . . . . . . . . . . . . . . . . . . . . . . . . . . . . . . . . 59<br />
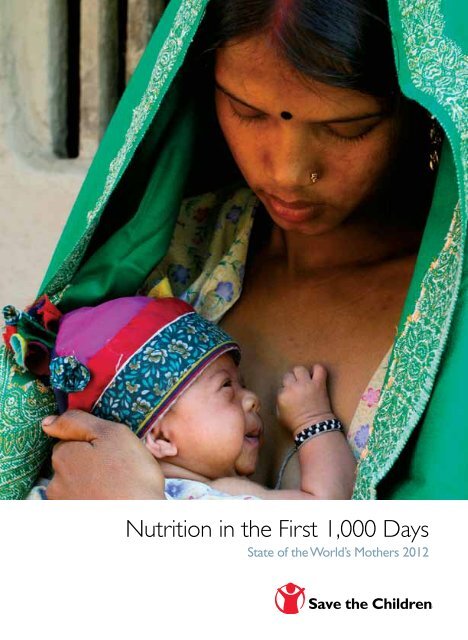
Front cover<br />
hemanti, an 18-year-old mo<strong>the</strong>r <strong>in</strong> Nepal,<br />
prepares to breastfeed her 28-day-old baby<br />
who was born underweight. <strong>the</strong> baby has not<br />
yet been named.<br />
Photo by Michael Bisceglie<br />
<strong>Save</strong> <strong>the</strong> children, May 2012.<br />
all rights reserved.<br />
iSBN 1-888393-24-6<br />
State of <strong>the</strong> World’s Mo<strong>the</strong>rs 2012 was<br />
published with generous support from<br />
Johnson & Johnson, Mattel, <strong>in</strong>c. and<br />
Brookstone.<br />
2 chapter title goeS here
NUtritioN iN <strong>the</strong> FirSt 1,<strong>000</strong> DayS<br />
In commemoration of Mo<strong>the</strong>r’s Day, <strong>Save</strong> <strong>the</strong> <strong>Children</strong> is publish<strong>in</strong>g<br />
its thirteenth annual State of <strong>the</strong> World’s Mo<strong>the</strong>rs report. The focus is<br />
on <strong>the</strong> 171 million children globally who do not have <strong>the</strong> opportunity<br />
to reach <strong>the</strong>ir full potential due to <strong>the</strong> physical and mental effects of<br />
poor nutrition <strong>in</strong> <strong>the</strong> earliest months of life. This report shows which<br />
countries are do<strong>in</strong>g <strong>the</strong> best – and which are do<strong>in</strong>g <strong>the</strong> worst – at<br />
provid<strong>in</strong>g nutrition dur<strong>in</strong>g <strong>the</strong> critical w<strong>in</strong>dow of development that<br />
starts dur<strong>in</strong>g a mo<strong>the</strong>r’s pregnancy and goes through her child’s second<br />
birthday. It looks at six key nutrition solutions, <strong>in</strong>clud<strong>in</strong>g breastfeed<strong>in</strong>g,<br />
that have <strong>the</strong> greatest potential to save lives, and shows that <strong>the</strong>se<br />
solutions are affordable, even <strong>in</strong> <strong>the</strong> world’s poorest countries.<br />
The Infant and Toddler Feed<strong>in</strong>g Scorecard ranks 73 develop<strong>in</strong>g<br />
countries on measures of early child nutrition. The Breastfeed<strong>in</strong>g Policy<br />
Scorecard exam<strong>in</strong>es maternity leave laws, <strong>the</strong> right to nurs<strong>in</strong>g breaks<br />
at work and o<strong>the</strong>r <strong>in</strong>dicators to rank 36 developed countries on <strong>the</strong><br />
degree to which <strong>the</strong>ir policies support women who want to breastfeed.<br />
And <strong>the</strong> annual Mo<strong>the</strong>rs’ Index evaluates <strong>the</strong> status of women’s health,<br />
nutrition, education, economic well-be<strong>in</strong>g and political participation to<br />
rank 165 countries – both <strong>in</strong> <strong>the</strong> <strong>in</strong>dustrialized and develop<strong>in</strong>g world –<br />
to show where mo<strong>the</strong>rs and children fare best and where <strong>the</strong>y face <strong>the</strong><br />
greatest hardships.<br />
MoZaMBiQUe
2<br />
ForeWorD<br />
It’s hard to believe, but a child’s future<br />
can be determ<strong>in</strong>ed years before <strong>the</strong>y<br />
even reach <strong>the</strong>ir fifth birthday. As a<br />
fa<strong>the</strong>r of three, I see unlimited potential<br />
when I look at my kids. But for<br />
many children, this is not <strong>the</strong> case.<br />
In some countries, half of all children<br />
are chronically undernourished<br />
or “stunted.” Despite significant progress<br />
aga<strong>in</strong>st hunger and poverty <strong>in</strong><br />
<strong>the</strong> last decade, undernutrition is an<br />
underly<strong>in</strong>g killer of more than 2.6 million<br />
children and more than 100,<strong>000</strong><br />
mo<strong>the</strong>rs every year. Susta<strong>in</strong>ed poor<br />
nutrition weakens immune systems, mak<strong>in</strong>g children and<br />
adults more likely to die of diarrhea or pneumonia. And it<br />
impairs <strong>the</strong> effectiveness of lifesav<strong>in</strong>g medications, <strong>in</strong>clud<strong>in</strong>g<br />
those needed by people liv<strong>in</strong>g with HIV and AIDS.<br />
The devastat<strong>in</strong>g impact of undernutrition spans generations,<br />
as poorly nourished women are more likely to suffer<br />
difficult pregnancies and give birth to undernourished children<br />
<strong>the</strong>mselves. Lost productivity <strong>in</strong> <strong>the</strong> 36 countries with<br />
<strong>the</strong> highest levels of undernutrition can cost those economies<br />
between 2 and 3 percent of gross domestic product.<br />
That’s billions of dollars each year that could go towards<br />
educat<strong>in</strong>g more children, treat<strong>in</strong>g more patients at health<br />
cl<strong>in</strong>ics and fuel<strong>in</strong>g <strong>the</strong> global economy.<br />
We know that <strong>in</strong>vestments <strong>in</strong> nutrition are some of <strong>the</strong><br />
most powerful and cost-effective <strong>in</strong> global development.<br />
Good nutrition dur<strong>in</strong>g <strong>the</strong> critical 1,<strong>000</strong>-day w<strong>in</strong>dow from<br />
pregnancy to a child’s second birthday is crucial to develop<strong>in</strong>g<br />
a child’s cognitive capacity and physical growth.<br />
Ensur<strong>in</strong>g a child receives adequate nutrition dur<strong>in</strong>g this<br />
w<strong>in</strong>dow can yield dividends for a lifetime, as a well-nourished<br />
child will perform better <strong>in</strong> school, more effectively<br />
fight off disease and even earn more as an adult.<br />
The United States cont<strong>in</strong>ues to be a leader <strong>in</strong> fight<strong>in</strong>g<br />
undernutrition. Through Feed <strong>the</strong> Future and <strong>the</strong> Global<br />
Health Initiative we’re respond<strong>in</strong>g to <strong>the</strong> vary<strong>in</strong>g causes and<br />
consequences of, and solutions to, undernutrition. Our<br />
nutrition programs are <strong>in</strong>tegrated <strong>in</strong> both <strong>in</strong>itiatives, as we<br />
seek to ensure mo<strong>the</strong>rs and young children have access to<br />
nutritious food and quality health services.<br />
In both <strong>in</strong>itiatives, <strong>the</strong> focus for change is on women.<br />
Women comprise nearly half of <strong>the</strong> agricultural workforce<br />
<strong>in</strong> Africa, <strong>the</strong>y are often responsible for br<strong>in</strong>g<strong>in</strong>g home<br />
water and food and prepar<strong>in</strong>g family meals, <strong>the</strong>y are <strong>the</strong><br />
primary family caregivers and <strong>the</strong>y often eat last and least.<br />
Given any small amount of resources, <strong>the</strong>y often spend<br />
<strong>the</strong>m on <strong>the</strong> health and well-be<strong>in</strong>g of <strong>the</strong>ir families, and it<br />
has been proven that <strong>the</strong>ir own health<br />
and practices determ<strong>in</strong>e <strong>the</strong> health<br />
and prospects of <strong>the</strong> next generation.<br />
To help address this challenge,<br />
our programs support country-led<br />
efforts to ensure <strong>the</strong> availability of<br />
affordable, quality foods, <strong>the</strong> promotion<br />
of breastfeed<strong>in</strong>g and improved<br />
feed<strong>in</strong>g practices, micronutrient supplementation<br />
and community-based<br />
management of acute malnutrition.<br />
S<strong>in</strong>ce we know ris<strong>in</strong>g <strong>in</strong>comes do not<br />
necessarily translate <strong>in</strong>to a reduction<br />
<strong>in</strong> undernutrition, we are support<strong>in</strong>g<br />
specific efforts geared towards better child nutrition<br />
outcomes <strong>in</strong>clud<strong>in</strong>g broader nutrition education target<strong>in</strong>g<br />
not only mo<strong>the</strong>rs, but fa<strong>the</strong>rs, grandmo<strong>the</strong>rs and<br />
o<strong>the</strong>r caregivers.<br />
The United States is not act<strong>in</strong>g alone; many develop<strong>in</strong>g<br />
countries are tak<strong>in</strong>g <strong>the</strong> lead on tackl<strong>in</strong>g this issue.<br />
In 2009, G8 leaders met <strong>in</strong> L’Aquila, Italy and pledged<br />
to <strong>in</strong>crease fund<strong>in</strong>g and coord<strong>in</strong>ation for <strong>in</strong>vestment <strong>in</strong><br />
agriculture and food security, revers<strong>in</strong>g years of decl<strong>in</strong><strong>in</strong>g<br />
public <strong>in</strong>vestment. And s<strong>in</strong>ce 2010, some 27 develop<strong>in</strong>g<br />
countries have jo<strong>in</strong>ed <strong>the</strong> Scal<strong>in</strong>g Up <strong>Nutrition</strong> (SUN)<br />
Movement, pledg<strong>in</strong>g to focus on reduc<strong>in</strong>g undernutrition.<br />
That same year, <strong>the</strong> United States and several <strong>in</strong>ternational<br />
partners launched <strong>the</strong> 1,<strong>000</strong> <strong>Days</strong> Partnership. The<br />
Partnership was designed to raise awareness of and focus<br />
political will on nutrition dur<strong>in</strong>g <strong>the</strong> critical 1,<strong>000</strong> days<br />
from pregnancy to a child’s second birthday. 1,<strong>000</strong> <strong>Days</strong><br />
also supports <strong>the</strong> SUN Movement, and I am proud to be<br />
a member of <strong>the</strong> SUN Lead Group until <strong>the</strong> end of 2013.<br />
Prevent<strong>in</strong>g undernutrition means more than just provid<strong>in</strong>g<br />
food to <strong>the</strong> hungry. It is a long-term <strong>in</strong>vestment <strong>in</strong><br />
our future, with generational payoffs. This report documents<br />
<strong>the</strong> extent of <strong>the</strong> problem and <strong>the</strong> ways we can solve<br />
it. All we must do is act.<br />
Dr. Rajiv Shah<br />
Adm<strong>in</strong>istrator of <strong>the</strong> United States Agency for<br />
International Development (USAID)
S av e t h e c h i l D r e N · S tat e o F t h e Wo r l D ’ S M ot h e r S 2 0 1 2 3<br />
iNtroDUctioN<br />
Every year, our State of <strong>the</strong> World’s<br />
Mo<strong>the</strong>rs report rem<strong>in</strong>ds us of <strong>the</strong> <strong>in</strong>extricable<br />
l<strong>in</strong>k between <strong>the</strong> well-be<strong>in</strong>g of<br />
mo<strong>the</strong>rs and <strong>the</strong>ir children. More than<br />
90 years of experience on <strong>the</strong> ground<br />
have shown us that when mo<strong>the</strong>rs<br />
have health care, education and economic<br />
opportunity, both <strong>the</strong>y and<br />
<strong>the</strong>ir children have <strong>the</strong> best chance to<br />
survive and thrive.<br />
But many are not so fortunate.<br />
Alarm<strong>in</strong>g numbers of mo<strong>the</strong>rs and<br />
children <strong>in</strong> develop<strong>in</strong>g countries are<br />
not gett<strong>in</strong>g <strong>the</strong> nutrition <strong>the</strong>y need.<br />
For mo<strong>the</strong>rs, this means less strength and energy for <strong>the</strong><br />
vitally important activities of daily life. It also means<br />
<strong>in</strong>creased risk of death or giv<strong>in</strong>g birth to a pre-term, underweight<br />
or malnourished <strong>in</strong>fant. For young children, poor<br />
nutrition <strong>in</strong> <strong>the</strong> early years often means irreversible damage<br />
to bodies and m<strong>in</strong>ds dur<strong>in</strong>g <strong>the</strong> time when both are<br />
develop<strong>in</strong>g rapidly. And for 2.6 million children each year,<br />
hunger kills, with malnutrition lead<strong>in</strong>g to death.<br />
This report looks at <strong>the</strong> critical 1,<strong>000</strong>-day w<strong>in</strong>dow of<br />
time from <strong>the</strong> start of a woman’s pregnancy to her child’s<br />
second birthday. It highlights proven, low-cost nutrition<br />
solutions – like exclusive breastfeed<strong>in</strong>g for <strong>the</strong> first 6<br />
months – that can make <strong>the</strong> difference between life and<br />
death for children <strong>in</strong> develop<strong>in</strong>g countries. It shows how<br />
millions of lives can be saved – and whole countries can<br />
be bolstered economically – if governments and private<br />
donors <strong>in</strong>vest <strong>in</strong> <strong>the</strong>se basic solutions. As Adm<strong>in</strong>istrator<br />
Shah states persuasively <strong>in</strong> <strong>the</strong> Foreword to this report, <strong>the</strong><br />
economic argument for early nutrition is very strong – <strong>the</strong><br />
cost to a nation's GDP is significant when kids go hungry<br />
early <strong>in</strong> life.<br />
<strong>Save</strong> <strong>the</strong> <strong>Children</strong> is work<strong>in</strong>g to fight malnutrition on<br />
three fronts as part of our global newborn and child survival<br />
campaign:<br />
• <strong>First</strong>, <strong>Save</strong> <strong>the</strong> <strong>Children</strong> is <strong>in</strong>creas<strong>in</strong>g awareness of <strong>the</strong><br />
global malnutrition crisis and its disastrous effects on<br />
mo<strong>the</strong>rs, children, families and communities. As part of<br />
our campaign, this report calls attention to areas where<br />
greater <strong>in</strong>vestments are needed and shows that effective<br />
strategies are work<strong>in</strong>g, even <strong>in</strong> some of <strong>the</strong> poorest<br />
places on earth.<br />
• Second, <strong>Save</strong> <strong>the</strong> <strong>Children</strong> is encourag<strong>in</strong>g action by<br />
mobiliz<strong>in</strong>g citizens around <strong>the</strong> world to support quality<br />
programs to reduce maternal, newborn and child<br />
mortality, and to advocate for <strong>in</strong>creased leadership,<br />
commitment and fund<strong>in</strong>g for programs<br />
we know work.<br />
• Third, we are mak<strong>in</strong>g a major difference<br />
on <strong>the</strong> ground. <strong>Save</strong> <strong>the</strong> <strong>Children</strong><br />
rigorously tests strategies that lead<br />
to breakthroughs for children. We<br />
work <strong>in</strong> partnerships across sectors<br />
with national m<strong>in</strong>istries, local<br />
organizations and o<strong>the</strong>rs to support<br />
high quality health, nutrition and<br />
agriculture programm<strong>in</strong>g throughout<br />
<strong>the</strong> develop<strong>in</strong>g world. As part of<br />
this, we tra<strong>in</strong> and support frontl<strong>in</strong>e<br />
health workers who promote breastfeed<strong>in</strong>g,<br />
counsel families to improve diets, distribute<br />
vitam<strong>in</strong>s and o<strong>the</strong>r micronutrients, and treat childhood<br />
diseases. We also manage large food security programs<br />
with a focus on child nutrition <strong>in</strong> 10 countries. Work<strong>in</strong>g<br />
toge<strong>the</strong>r, we have saved millions of children’s lives. The<br />
tragedy is that so many more could be helped, if only<br />
more resources were available to ensure <strong>the</strong>se lifesav<strong>in</strong>g<br />
programs reach all those who need <strong>the</strong>m.<br />
This report conta<strong>in</strong>s our annual rank<strong>in</strong>g of <strong>the</strong> best and<br />
worst places <strong>in</strong> <strong>the</strong> world for mo<strong>the</strong>rs and children. We<br />
count on <strong>the</strong> world’s leaders to take stock of how mo<strong>the</strong>rs<br />
and children are far<strong>in</strong>g <strong>in</strong> every country and to respond<br />
to <strong>the</strong> urgent needs described <strong>in</strong> this report. Invest<strong>in</strong>g <strong>in</strong><br />
this most basic partnership of all – between a mo<strong>the</strong>r and<br />
her child – is <strong>the</strong> first and best step <strong>in</strong> ensur<strong>in</strong>g healthy<br />
children, prosperous families and strong communities.<br />
Every one of us has a role to play. As a mo<strong>the</strong>r myself, I<br />
urge you to do your part. Please read <strong>the</strong> Take Action section<br />
of this report, and visit our website on a regular basis<br />
to f<strong>in</strong>d out what you can do to make a difference.<br />
Carolyn Miles<br />
President and CEO<br />
<strong>Save</strong> <strong>the</strong> <strong>Children</strong> USA<br />
(Follow @carolynsave on Twitter)
Somalia<br />
4 chapter title goeS here
S av e t h e c h i l D r e N · S tat e o F t h e Wo r l D ’ S M ot h e r S 2 0 1 2 5<br />
execUtive SUMMary:<br />
Key FiNDiNgS aND recoMMeNDatioNS<br />
Malnutrition is an underly<strong>in</strong>g cause of death for 2.6 million children each year,<br />
and it leaves millions more with lifelong physical and mental impairments.<br />
Worldwide, more than 170 million children do not have <strong>the</strong> opportunity to<br />
reach <strong>the</strong>ir full potential because of poor nutrition <strong>in</strong> <strong>the</strong> earliest months of life.<br />
Much of a child’s future – and <strong>in</strong> fact much of a nation’s future – is determ<strong>in</strong>ed<br />
by <strong>the</strong> quality of nutrition <strong>in</strong> <strong>the</strong> first 1,<strong>000</strong> days. The period from <strong>the</strong><br />
start of a mo<strong>the</strong>r’s pregnancy through her child’s second birthday is a critical<br />
w<strong>in</strong>dow when a child’s bra<strong>in</strong> and body are develop<strong>in</strong>g rapidly and good nutrition<br />
is essential to lay <strong>the</strong> foundation for a healthy and productive future. If<br />
children do not get <strong>the</strong> right nutrients dur<strong>in</strong>g this period, <strong>the</strong> damage is often<br />
irreversible.<br />
This year’s State of <strong>the</strong> World’s Mo<strong>the</strong>rs report shows which countries are succeed<strong>in</strong>g<br />
– and which are fail<strong>in</strong>g – to provide good nutrition dur<strong>in</strong>g <strong>the</strong> critical<br />
1,<strong>000</strong>-day w<strong>in</strong>dow. It exam<strong>in</strong>es how <strong>in</strong>vestments <strong>in</strong> nutrition solutions make<br />
a difference for mo<strong>the</strong>rs, children, communities, and society as a whole. It also<br />
po<strong>in</strong>ts to proven, low-cost solutions that could save millions of lives and help<br />
lift millions more out of ill-health and poverty.<br />
Key F<strong>in</strong>d<strong>in</strong>gs<br />
1. <strong>Children</strong> <strong>in</strong> an alarm<strong>in</strong>g number of countries are not gett<strong>in</strong>g adequate<br />
nutrition dur<strong>in</strong>g <strong>the</strong>ir first 1,<strong>000</strong> days. Out of 73 develop<strong>in</strong>g countries –<br />
which toge<strong>the</strong>r account for 95 percent of child deaths – only four score “very<br />
good” on measures of young child nutrition. Our Infant and Toddler Feed<strong>in</strong>g<br />
Scorecard identifies Malawi, Madagascar, Peru and Solomon Islands as <strong>the</strong> top<br />
four countries where <strong>the</strong> majority of children under age 2 are be<strong>in</strong>g fed accord<strong>in</strong>g<br />
to recommended standards. More than two thirds of <strong>the</strong> countries on <strong>the</strong><br />
Scorecard receive grades of “fair” or “poor” on <strong>the</strong>se measures overall, <strong>in</strong>dicat<strong>in</strong>g<br />
vast numbers of children are not gett<strong>in</strong>g a healthy start <strong>in</strong> life. The bottom four<br />
countries on <strong>the</strong> Scorecard – Somalia, Côte d'Ivoire, Botswana and Equatorial<br />
Gu<strong>in</strong>ea – have stagger<strong>in</strong>gly poor performance on <strong>in</strong>dicators of early child feed<strong>in</strong>g<br />
and have made little to no progress s<strong>in</strong>ce 1990 <strong>in</strong> sav<strong>in</strong>g children’s lives. (To<br />
read more, turn to pages 26-31.)<br />
2. Child malnutrition is widespread and it is limit<strong>in</strong>g <strong>the</strong> future success of<br />
millions of children and <strong>the</strong>ir countries. Stunt<strong>in</strong>g, or stunted growth, occurs<br />
when children do not receive <strong>the</strong> right type of nutrients, especially <strong>in</strong> utero or<br />
dur<strong>in</strong>g <strong>the</strong> first two years of life. <strong>Children</strong> whose bodies and m<strong>in</strong>ds are limited<br />
by stunt<strong>in</strong>g are at greater risk for disease and death, poor performance <strong>in</strong> school,<br />
and a lifetime of poverty. More than 80 countries <strong>in</strong> <strong>the</strong> develop<strong>in</strong>g world have<br />
child stunt<strong>in</strong>g rates of 20 percent or more. Thirty of <strong>the</strong>se countries have what<br />
is considered to be “very high” stunt<strong>in</strong>g rates of 40 percent or more. While<br />
many countries are mak<strong>in</strong>g progress <strong>in</strong> reduc<strong>in</strong>g child malnutrition, stunt<strong>in</strong>g<br />
prevalence is on <strong>the</strong> rise <strong>in</strong> at least 14 countries, most of <strong>the</strong>m <strong>in</strong> sub-Saharan<br />
Africa. If current trends cont<strong>in</strong>ue, Africa may overtake Asia as <strong>the</strong> region most<br />
heavily burdened by child malnutrition. (To read more, turn to pages 15-21.)<br />
3. Economic growth is not enough to fight malnutrition. Political will and<br />
effective strategies are needed to reduce malnutrition and prevent stunt<strong>in</strong>g.<br />
A number of relatively poor countries are do<strong>in</strong>g an admirable job of tackl<strong>in</strong>g<br />
this problem, while o<strong>the</strong>r countries with greater resources are not do<strong>in</strong>g so<br />
Vital statistics<br />
Malnutrition is <strong>the</strong> underly<strong>in</strong>g cause<br />
of more than 2.6 million child deaths<br />
each year.<br />
171 million children – 27 percent of all chil-<br />
dren globally – are stunted, mean<strong>in</strong>g <strong>the</strong>ir<br />
bodies and m<strong>in</strong>ds have suffered permanent,<br />
irreversible damage due to malnutrition.<br />
In develop<strong>in</strong>g countries, breastfed children<br />
are at least 6 times more likely to survive <strong>in</strong><br />
<strong>the</strong> early months of life than non-breastfed<br />
children.<br />
If all children <strong>in</strong> <strong>the</strong> develop<strong>in</strong>g world<br />
received adequate nutrition and feed<strong>in</strong>g<br />
of solid foods with breastfeed<strong>in</strong>g,<br />
stunt<strong>in</strong>g rates at 12 months could be cut<br />
by 20 percent.<br />
Breastfeed<strong>in</strong>g is <strong>the</strong> s<strong>in</strong>gle most effective<br />
nutrition <strong>in</strong>tervention for sav<strong>in</strong>g lives.<br />
If practiced optimally, it could prevent<br />
1 million child deaths each year.<br />
Adults who were malnourished as children<br />
can earn an estimated 20 percent less on<br />
average than those who weren’t.<br />
The effects of malnutrition <strong>in</strong> develop<strong>in</strong>g<br />
countries can translate <strong>in</strong>to losses <strong>in</strong> GDP<br />
of up to 2-3 percent annually.<br />
Globally, <strong>the</strong> direct cost of malnutrition is<br />
estimated at $20 to $30 billion per year.
6 executive summary<br />
well. For example: India has a GDP per capita of $1,500 and 48 percent of<br />
its children are stunted. Compare this to Vietnam where <strong>the</strong> GDP per capita<br />
is $1,200 and <strong>the</strong> child stunt<strong>in</strong>g rate is 23 percent. O<strong>the</strong>rs countries that are<br />
perform<strong>in</strong>g better on child nutrition than <strong>the</strong>ir national wealth might suggest<br />
<strong>in</strong>clude: Brazil, Chile, Costa Rica, Kyrgyzstan, Mongolia, Senegal and Tunisia.<br />
Countries that are underperform<strong>in</strong>g relative to <strong>the</strong>ir national wealth <strong>in</strong>clude:<br />
Botswana, Equatorial Gu<strong>in</strong>ea, Guatemala, Indonesia, Mexico, Panama, Peru,<br />
South Africa and Venezuela. (To read more, turn to pages 19-20.)<br />
4. We know how to save millions of children. <strong>Save</strong> <strong>the</strong> <strong>Children</strong> has highlighted<br />
six low-cost nutrition <strong>in</strong>terventions with <strong>the</strong> greatest potential to save<br />
lives <strong>in</strong> children’s first 1,<strong>000</strong> days and beyond. Universal coverage of <strong>the</strong>se<br />
“lifesav<strong>in</strong>g six” solutions globally could prevent more than 2 million mo<strong>the</strong>r<br />
and child deaths each year. The lifesav<strong>in</strong>g six are: iron folate, breastfeed<strong>in</strong>g,<br />
complementary feed<strong>in</strong>g, vitam<strong>in</strong> A, z<strong>in</strong>c and hygiene. Nearly 1 million lives<br />
could be saved by breastfeed<strong>in</strong>g alone. This entire lifesav<strong>in</strong>g package can be<br />
delivered at a cost of less than $20 per child for <strong>the</strong> first 1,<strong>000</strong> days. Tragically,<br />
more than half of <strong>the</strong> world’s children do not have access to <strong>the</strong> lifesav<strong>in</strong>g six.<br />
(To read more, turn to pages 23-26.)<br />
5. Health workers are key to success. Frontl<strong>in</strong>e health workers have a vital role<br />
to play <strong>in</strong> promot<strong>in</strong>g good nutrition <strong>in</strong> <strong>the</strong> first 1,<strong>000</strong> days. In impoverished<br />
communities <strong>in</strong> <strong>the</strong> develop<strong>in</strong>g world where malnutrition is most common,<br />
doctors and hospitals are often unavailable, too far away, or too expensive.<br />
vietnam
S av e t h e c h i l D r e N · S tat e o F t h e Wo r l D ’ S M ot h e r S 2 0 1 2 7<br />
Community health workers and midwives meet critical needs <strong>in</strong> <strong>the</strong>se communities<br />
by screen<strong>in</strong>g children for malnutrition, treat<strong>in</strong>g diarrhea, promot<strong>in</strong>g<br />
breastfeed<strong>in</strong>g, distribut<strong>in</strong>g vitam<strong>in</strong>s and o<strong>the</strong>r micronutrients, and counsel<strong>in</strong>g<br />
mo<strong>the</strong>rs about balanced diet, hygiene and sanitation. The “lifesav<strong>in</strong>g six”<br />
<strong>in</strong>terventions highlighted <strong>in</strong> this report can all be delivered <strong>in</strong> remote, impoverished<br />
places by well-tra<strong>in</strong>ed and well-equipped community health workers.<br />
In a number of countries – <strong>in</strong>clud<strong>in</strong>g Cambodia, Malawi and Nepal – <strong>the</strong>se<br />
health workers have contributed to broad-scale success <strong>in</strong> fight<strong>in</strong>g malnutrition<br />
and sav<strong>in</strong>g lives. (To read more, turn to pages 32-37.)<br />
6. In <strong>the</strong> <strong>in</strong>dustrialized world, <strong>the</strong> United States has <strong>the</strong> least favorable environment<br />
for mo<strong>the</strong>rs who want to breastfeed. <strong>Save</strong> <strong>the</strong> <strong>Children</strong> exam<strong>in</strong>ed<br />
maternity leave laws, <strong>the</strong> right to nurs<strong>in</strong>g breaks at work, and several o<strong>the</strong>r<br />
<strong>in</strong>dicators to create a rank<strong>in</strong>g of 36 <strong>in</strong>dustrialized countries measur<strong>in</strong>g which<br />
ones have <strong>the</strong> most – and <strong>the</strong> least – supportive policies for women who want to<br />
breastfeed. Norway tops <strong>the</strong> Breastfeed<strong>in</strong>g Policy Scorecard rank<strong>in</strong>g. The United<br />
States comes <strong>in</strong> last. (To read more, turn to pages 39-43.)<br />
ReCommendations<br />
1. Invest <strong>in</strong> proven, low-cost solutions to save children’s lives and prevent<br />
stunt<strong>in</strong>g. Malnutrition and child mortality can be fought with relatively simple<br />
and <strong>in</strong>expensive solutions. Iron supplements streng<strong>the</strong>n children’s resistance<br />
to disease, lower women’s risk of dy<strong>in</strong>g <strong>in</strong> childbirth and may help prevent<br />
premature births and low birthweight. Six months of exclusive breastfeed<strong>in</strong>g<br />
<strong>in</strong>creases a child’s chance of survival at least six-fold. Timely and appropriate<br />
complementary feed<strong>in</strong>g is <strong>the</strong> best way to prevent a lifetime of lost potential<br />
due to stunt<strong>in</strong>g. Vitam<strong>in</strong> A helps prevent bl<strong>in</strong>dness and lowers a child’s risk<br />
of death from common diseases. Z<strong>in</strong>c and good hygiene can save a child from<br />
dy<strong>in</strong>g of diarrhea. These solutions are not expensive, and it is a tragedy that<br />
millions of mo<strong>the</strong>rs and children do not get <strong>the</strong>m.<br />
2. Invest <strong>in</strong> health workers – especially those serv<strong>in</strong>g on <strong>the</strong> front l<strong>in</strong>es – to<br />
reach <strong>the</strong> most vulnerable mo<strong>the</strong>rs and children. The world is short more than<br />
3 million health workers of all types, and <strong>the</strong>re is an acute shortage of frontl<strong>in</strong>e<br />
Kyrgyzstan
8 executive summary<br />
afghanistan<br />
workers, <strong>in</strong>clud<strong>in</strong>g community health workers, who are critical to deliver<strong>in</strong>g<br />
<strong>the</strong> nutrition solutions that can save lives and prevent stunt<strong>in</strong>g. Governments<br />
and donors should work toge<strong>the</strong>r to fill this health worker gap by recruit<strong>in</strong>g,<br />
tra<strong>in</strong><strong>in</strong>g and support<strong>in</strong>g new and exist<strong>in</strong>g health workers, and deploy<strong>in</strong>g <strong>the</strong>m<br />
where <strong>the</strong>y are needed most.<br />
3. Help more girls go to school and stay <strong>in</strong> school. One of <strong>the</strong> most effective<br />
ways to fight child malnutrition is to focus on girls’ education. Educated women<br />
tend to have fewer, healthier and better-nourished children. Increased <strong>in</strong>vestments<br />
are needed to help more girls go to school and stay <strong>in</strong> school, and to encourage<br />
families and communities to value <strong>the</strong> education of girls. Both formal education<br />
and non-formal tra<strong>in</strong><strong>in</strong>g give girls knowledge, self-confidence, practical skills and<br />
hope for a bright future. These are powerful tools that can help delay marriage<br />
and child-bear<strong>in</strong>g to a time that is healthier for <strong>the</strong>m and <strong>the</strong>ir babies.<br />
4. Increase government support for proven solutions to fight malnutrition<br />
and save lives. In order to meet <strong>in</strong>ternationally agreed upon development goals<br />
to reduce child deaths and improve mo<strong>the</strong>rs’ health, lifesav<strong>in</strong>g services must<br />
be <strong>in</strong>creased for <strong>the</strong> women and children who need help most. All countries<br />
must make fight<strong>in</strong>g malnutrition and stunt<strong>in</strong>g a priority. Develop<strong>in</strong>g countries<br />
should commit to and fund national nutrition plans that are <strong>in</strong>tegrated with<br />
plans for maternal and child health. Donor countries should support <strong>the</strong>se<br />
goals by keep<strong>in</strong>g <strong>the</strong>ir fund<strong>in</strong>g commitments to achiev<strong>in</strong>g <strong>the</strong> Millennium<br />
Development Goals and countries should endorse and support <strong>the</strong> Scal<strong>in</strong>g Up<br />
<strong>Nutrition</strong> (SUN) movement. Resources for malnutrition programs should not<br />
come at <strong>the</strong> expense of o<strong>the</strong>r programs critical to <strong>the</strong> survival and well-be<strong>in</strong>g<br />
of children.(To read more, turn to page 45.)<br />
5. Increase private sector partnerships to improve nutrition for mo<strong>the</strong>rs and<br />
children. Many local diets fail to meet <strong>the</strong> nutritional requirements of children 6-24<br />
months old. The private sector can help by produc<strong>in</strong>g and market<strong>in</strong>g affordable<br />
fortified products. Partnerships should be established with multiple manufacturers,<br />
distributors and government m<strong>in</strong>istries to <strong>in</strong>crease product choice, access and<br />
affordability, improve compliance with codes and standards, and promote public<br />
education on good feed<strong>in</strong>g practices and use of local foods and commercial products.<br />
The food <strong>in</strong>dustry can also <strong>in</strong>vest more <strong>in</strong> nutrition programs and research,<br />
contribute social market<strong>in</strong>g expertise to promote healthy behaviors such as breastfeed<strong>in</strong>g,<br />
and advocate for greater government <strong>in</strong>vestments <strong>in</strong> nutrition.<br />
6. Improve laws, policies and actions that support families and encourage<br />
breastfeed<strong>in</strong>g. Governments <strong>in</strong> all countries can do more to help parents and<br />
create a supportive environment for breastfeed<strong>in</strong>g. Governments and partners<br />
should adopt policies that are child-friendly and support breastfeed<strong>in</strong>g<br />
mo<strong>the</strong>rs. Such policies would give families access to maternal and paternal<br />
leave, ensure that workplaces and public facilities offer women a suitable<br />
place to feed <strong>the</strong>ir babies outside of <strong>the</strong> home, and ensure work<strong>in</strong>g women<br />
are guaranteed breastfeed<strong>in</strong>g breaks while on <strong>the</strong> job. In an <strong>in</strong>creas<strong>in</strong>gly urban<br />
world, a fur<strong>the</strong>r example is that public transportation can offer special seats<br />
for breastfeed<strong>in</strong>g mo<strong>the</strong>rs.
S av e t h e c h i l D r e N · S tat e o F t h e Wo r l D ’ S M ot h e r S 2 0 1 2 9<br />
Niger<br />
<strong>the</strong> 2012 Mo<strong>the</strong>rs’ Index Index: : norway tops List, niger Ranks Last,<br />
United states Ranks 25th<br />
<strong>Save</strong> <strong>the</strong> <strong>Children</strong>’s thirteenth annual Mo<strong>the</strong>rs’ Index<br />
compares <strong>the</strong> well-be<strong>in</strong>g of mo<strong>the</strong>rs and children <strong>in</strong> 165<br />
countries – more than <strong>in</strong> any previous year. The<br />
Mo<strong>the</strong>rs’ Index also provides <strong>in</strong>formation on an addi-<br />
tional 8 countries, 7 of which report sufficient data<br />
to present f<strong>in</strong>d<strong>in</strong>gs on women’s or children’s <strong>in</strong>dica-<br />
tors. When <strong>the</strong>se are <strong>in</strong>cluded, <strong>the</strong> total comes to<br />
173 countries.<br />
Norway, Iceland and Sweden top <strong>the</strong> rank<strong>in</strong>gs this<br />
year. The top 10 countries, <strong>in</strong> general, atta<strong>in</strong> very high<br />
scores for mo<strong>the</strong>rs’ and children’s health, educational<br />
and economic status. Niger ranks last among <strong>the</strong> 165<br />
countries surveyed. The 10 bottom-ranked countries<br />
– eight from sub-Saharan Africa – are a reverse image<br />
of <strong>the</strong> top 10, perform<strong>in</strong>g poorly on all <strong>in</strong>dicators. The<br />
United States places 25th this year – up six spots from<br />
last year.<br />
Conditions for mo<strong>the</strong>rs and <strong>the</strong>ir children <strong>in</strong> <strong>the</strong><br />
bottom countries are grim. On average, 1 <strong>in</strong> 30 women<br />
will die from pregnancy-related causes. One child <strong>in</strong><br />
7 dies before his or her fifth birthday, and more than<br />
1 child <strong>in</strong> 3 suffers from malnutrition. Nearly half <strong>the</strong><br />
population lacks access to safe water and fewer than 4<br />
girls for every 5 boys are enrolled <strong>in</strong> primary school.<br />
The gap <strong>in</strong> availability of maternal and child health<br />
services is especially dramatic when compar<strong>in</strong>g Norway<br />
and Niger. Skilled health personnel are present at virtu-<br />
ally every birth <strong>in</strong> Norway, while only a third of births<br />
are attended <strong>in</strong> Niger. A typical Norwegian girl can<br />
expect to receive 18 years of formal education and to live<br />
to be over 83 years old. Eighty-two percent of women<br />
are us<strong>in</strong>g some modern method of contraception, and<br />
only 1 <strong>in</strong> 175 is likely to lose a child before his or her<br />
fifth birthday. At <strong>the</strong> opposite end of <strong>the</strong> spectrum, <strong>in</strong><br />
Niger, a typical girl receives only 4 years of education<br />
and lives to be only 56. Only 5 percent of women are<br />
us<strong>in</strong>g modern contraception, and 1 child <strong>in</strong> 7 dies before<br />
his or her fifth birthday. At this rate, every mo<strong>the</strong>r <strong>in</strong><br />
Niger is likely to suffer <strong>the</strong> loss of a child.<br />
Zero<strong>in</strong>g <strong>in</strong> on <strong>the</strong> children’s well-be<strong>in</strong>g portion of<br />
<strong>the</strong> Mo<strong>the</strong>rs’ Index Index, , Iceland f<strong>in</strong>ishes first and Somalia is<br />
last out of 171 countries. While nearly every Icelandic<br />
child – girl and boy alike – enjoys good health and edu-<br />
cation, children <strong>in</strong> Somalia face <strong>the</strong> highest risk of death<br />
<strong>in</strong> <strong>the</strong> world. More than 1 child <strong>in</strong> 6 dies before age 5.<br />
Nearly one-third of Somali children are malnourished<br />
and 70 percent lack access to safe water. Fewer than 1 <strong>in</strong><br />
3 children <strong>in</strong> Somalia are enrolled <strong>in</strong> school, and with<strong>in</strong><br />
that meager enrollment, boys outnumber girls almost<br />
2 to 1.<br />
These statistics go far beyond mere numbers. The<br />
human despair and lost opportunities represented <strong>in</strong><br />
<strong>the</strong>se numbers demand mo<strong>the</strong>rs everywhere be given<br />
<strong>the</strong> basic tools <strong>the</strong>y need to break <strong>the</strong> cycle of poverty<br />
and improve <strong>the</strong> quality of life for <strong>the</strong>mselves, <strong>the</strong>ir<br />
children, and for generations to come.<br />
See <strong>the</strong> Appendix for <strong>the</strong> Complete Mo<strong>the</strong>rs’ Index<br />
and Country Rank<strong>in</strong>gs.
Bangladesh<br />
10 chapter title goeS here
S av e t h e c h i l D r e N · S tat e o F t h e Wo r l D ’ S M ot h e r S 2 0 1 2 11<br />
Why FocUS oN <strong>the</strong> FirSt 1,<strong>000</strong> DayS?<br />
Good nutrition dur<strong>in</strong>g <strong>the</strong> 1,<strong>000</strong>-day period between <strong>the</strong> start of a woman’s<br />
pregnancy and her child’s second birthday is critical to <strong>the</strong> future health, wellbe<strong>in</strong>g<br />
and success of her child. The right nutrition dur<strong>in</strong>g this w<strong>in</strong>dow can have<br />
a profound impact on a child’s ability to grow, learn and rise out of poverty.<br />
It also benefits society, by boost<strong>in</strong>g productivity and improv<strong>in</strong>g economic<br />
prospects for families and communities.<br />
Malnutrition is an underly<strong>in</strong>g cause of 2.6 million child deaths each year.1<br />
Millions more children survive, but suffer lifelong physical and cognitive<br />
impairments because <strong>the</strong>y did not get <strong>the</strong> nutrients <strong>the</strong>y needed early <strong>in</strong> <strong>the</strong>ir<br />
lives when <strong>the</strong>ir grow<strong>in</strong>g bodies and m<strong>in</strong>ds were most vulnerable. When children<br />
start <strong>the</strong>ir lives malnourished, <strong>the</strong> negative effects are largely irreversible.<br />
Pregnancy and <strong>in</strong>fancy are <strong>the</strong> most important periods for bra<strong>in</strong> development.<br />
Mo<strong>the</strong>rs and babies need good nutrition to lay <strong>the</strong> foundation for <strong>the</strong><br />
child’s future cognitive, motor and social skills, school success and productivity.<br />
<strong>Children</strong> with restricted bra<strong>in</strong> development <strong>in</strong> early life are at risk for later<br />
neurological problems, poor school achievement, early school drop out, lowskilled<br />
employment and poor care of <strong>the</strong>ir own children, thus contribut<strong>in</strong>g to<br />
<strong>the</strong> <strong>in</strong>tergenerational transmission of poverty.2<br />
Millions of mo<strong>the</strong>rs <strong>in</strong> poor countries struggle to give <strong>the</strong>ir children a healthy<br />
start <strong>in</strong> life. Complex social and cultural beliefs <strong>in</strong> many develop<strong>in</strong>g countries<br />
put females at a disadvantage and, start<strong>in</strong>g from a very young age, many girls<br />
do not get enough to eat. In communities where early marriage is common,<br />
teenagers often leave school and become pregnant before <strong>the</strong>ir bodies have fully<br />
matured. With compromised health, small bodies and <strong>in</strong>adequate resources and<br />
support, <strong>the</strong>se mo<strong>the</strong>rs often fail to ga<strong>in</strong> sufficient weight dur<strong>in</strong>g pregnancy<br />
and are susceptible to a host of complications that put <strong>the</strong>mselves and <strong>the</strong>ir<br />
babies at risk.<br />
Worldwide, 20 million babies are born with low birthweight each year.3<br />
Many of <strong>the</strong>se babies are born too early – before <strong>the</strong> full n<strong>in</strong>e months of pregnancy.<br />
O<strong>the</strong>rs are full-term but <strong>the</strong>y are small because of poor growth <strong>in</strong> <strong>the</strong><br />
mo<strong>the</strong>r’s womb. Even babies who are born at a normal weight may still have<br />
been malnourished <strong>in</strong> <strong>the</strong> womb if <strong>the</strong> mo<strong>the</strong>r’s diet was poor. O<strong>the</strong>rs become<br />
malnourished <strong>in</strong> <strong>in</strong>fancy due to disease, <strong>in</strong>adequate breastfeed<strong>in</strong>g or lack of<br />
nutritious food. Malnutrition weakens young children’s immune systems and<br />
leaves <strong>the</strong>m vulnerable to death from common illnesses such as pneumonia,<br />
diarrhea and malaria.<br />
South Sudan
12 Why Focus oN <strong>the</strong> <strong>First</strong> 1,<strong>000</strong> <strong>Days</strong>?<br />
eConomiC gRowth and FUtURe sUCCess<br />
Investments <strong>in</strong> improv<strong>in</strong>g nutrition for mo<strong>the</strong>rs and children <strong>in</strong> <strong>the</strong> first<br />
1,<strong>000</strong> days will yield real payoffs both <strong>in</strong> lives saved and <strong>in</strong> healthier, more<br />
stable and productive populations. In addition to its negative, often fatal, health<br />
consequences, malnutrition means children achieve less at school and <strong>the</strong>ir<br />
productivity and health <strong>in</strong> adult life is affected, which has dire f<strong>in</strong>ancial consequences<br />
for entire countries.<br />
<strong>Children</strong> whose physical and mental development are stunted by malnutrition<br />
will earn less on average as adults. One study suggested <strong>the</strong> loss of human<br />
potential result<strong>in</strong>g from stunt<strong>in</strong>g was associated with 20 percent less adult<br />
<strong>in</strong>come on average.4 Malnutrition costs many develop<strong>in</strong>g nations an estimated<br />
2-3 percent of <strong>the</strong>ir GDP each year, extends <strong>the</strong> cycle of poverty, and impedes<br />
global economic growth.5 Globally, <strong>the</strong> direct cost of child malnutrition is<br />
estimated at $20 to $30 billion per year.6<br />
In contrast, well-nourished children perform better <strong>in</strong> school and grow up<br />
to earn considerably more on average than those who were malnourished as<br />
children. Recent evidence suggests nutritional <strong>in</strong>terventions can <strong>in</strong>crease adult<br />
earn<strong>in</strong>gs by as much as 46 percent.7<br />
An estimated 450 million children will be affected by stunt<strong>in</strong>g <strong>in</strong> <strong>the</strong> next<br />
15 years if current trends cont<strong>in</strong>ue.8 This is bad news for <strong>the</strong> economies of<br />
develop<strong>in</strong>g nations, and for a global economy that is <strong>in</strong>creas<strong>in</strong>gly dependent<br />
on new markets to drive economic growth.<br />
Malawi
S av e t h e c h i l D r e N · S tat e o F t h e Wo r l D ’ S M ot h e r S 2 0 1 2 13<br />
pakistan<br />
end<strong>in</strong>g a Family Legacy of malnutrition<br />
Sobia grew up <strong>in</strong> a large family that<br />
struggled to get by, and like many girls, she<br />
did not get enough to eat. “We were five<br />
bro<strong>the</strong>rs and sisters and lived a very hard<br />
life,” she said. “My mo<strong>the</strong>r looked after us<br />
by do<strong>in</strong>g tailor<strong>in</strong>g work at home and fed us<br />
on this meager <strong>in</strong>come.”<br />
When Sobia was 18 and pregnant with<br />
her first child, she felt tired, achy, feverish<br />
and nauseous. Her mo<strong>the</strong>r-<strong>in</strong>-law told<br />
her this was normal, so she did not seek<br />
medical care. She knows now that she was<br />
anemic, and she is lucky she and her baby<br />
are still alive. With no prenatal care, she<br />
was unprepared for childbirth. When her<br />
labor pa<strong>in</strong>s started, her family waited three<br />
days, as <strong>the</strong>y were expect<strong>in</strong>g her to deliver<br />
at home. F<strong>in</strong>ally, when her pa<strong>in</strong> became<br />
extreme, <strong>the</strong>y took her to <strong>the</strong> hospital.<br />
She had a difficult delivery with extensive<br />
bleed<strong>in</strong>g. Her baby boy, Abdullah, was born<br />
small and weak. Sobia was exhausted, and it<br />
was difficult for her to care for her <strong>in</strong>fant.<br />
Sobia followed local customs that say<br />
a woman should not breastfeed her baby<br />
for <strong>the</strong> first three days. Over <strong>the</strong> next<br />
few months, Abdullah suffered bouts of<br />
“Whenever i see a pregnant woman now, i share <strong>the</strong> lessons i<br />
learned, so <strong>the</strong>y won’t have to suffer like i did,” says Sobia, age<br />
23. Sobia, her 8-month-old daughter arooj, and 3½-year-old son<br />
abdullah, live <strong>in</strong> haripur, pakistan. Photo by Daulat Baig<br />
diarrhea and pneumonia, but he managed<br />
to survive. When Abdullah was 8 months<br />
old, Sobia discovered she was pregnant<br />
aga<strong>in</strong>. After she miscarried, she sought<br />
help from a nearby cl<strong>in</strong>ic established by<br />
<strong>Save</strong> <strong>the</strong> <strong>Children</strong>. That was when she<br />
learned she was severely anemic.<br />
The staff at <strong>the</strong> cl<strong>in</strong>ic gave Sobia iron<br />
supplements and showed her ways to<br />
improve her diet. They advised her to use<br />
contraceptives to give herself time to rest<br />
and get stronger before hav<strong>in</strong>g her next<br />
baby. She discussed this with her husband<br />
and <strong>the</strong>y agreed <strong>the</strong>y would wait two years.<br />
Sobia was anemic aga<strong>in</strong> dur<strong>in</strong>g her third<br />
pregnancy, but this time she was gett<strong>in</strong>g<br />
regular prenatal care, so <strong>the</strong> doctors gave<br />
her iron <strong>in</strong>jections and more advice about<br />
improv<strong>in</strong>g her diet. Sobia followed <strong>the</strong><br />
advice and gave birth to her second baby, a<br />
healthy girl named Arooj, <strong>in</strong> July 2011. She<br />
breastfed Arooj with<strong>in</strong> 30 m<strong>in</strong>utes after<br />
she was born, and cont<strong>in</strong>ued breastfeed<strong>in</strong>g<br />
exclusively for 6 months. “My Arooj is so<br />
much healthier than Abdullah was,” Sobia<br />
says. “She doesn’t get sick all <strong>the</strong> time like<br />
he did.”
Mozambique<br />
14 chapter title goeS here
S av e t h e c h i l D r e N · S tat e o F t h e Wo r l D ’ S M ot h e r S 2 0 1 2 15<br />
<strong>the</strong> gloBal MalNUtritioN criSiS<br />
One <strong>in</strong> four of <strong>the</strong> world’s children are chronically malnourished, also known<br />
as stunted. These are children who have not gotten <strong>the</strong> essential nutrients <strong>the</strong>y<br />
need, and <strong>the</strong>ir bodies and bra<strong>in</strong>s have not developed properly.<br />
The damage often beg<strong>in</strong>s before a child is born, when a poorly nourished<br />
mo<strong>the</strong>r cannot pass along adequate nutrition to <strong>the</strong> baby <strong>in</strong> her womb. She<br />
<strong>the</strong>n gives birth to an underweight <strong>in</strong>fant. If she is impoverished, overworked,<br />
poorly educated or <strong>in</strong> poor health, she may be at greater risk of not be<strong>in</strong>g able<br />
to feed her baby adequately. The child may endure more frequent <strong>in</strong>fections,<br />
which will also deprive <strong>the</strong> grow<strong>in</strong>g body of essential nutrients. <strong>Children</strong> under<br />
age 2 are especially vulnerable, and <strong>the</strong> negative effects of malnutrition at this<br />
age are largely irreversible.<br />
The issue of chronic malnutrition, as opposed to acute malnutrition (as <strong>in</strong><br />
<strong>the</strong> Horn of Africa <strong>in</strong> <strong>the</strong> last year) seldom grabs <strong>the</strong> headl<strong>in</strong>es, yet it is slowly<br />
destroy<strong>in</strong>g <strong>the</strong> potential of millions of children. Globally, 171 million children<br />
are experienc<strong>in</strong>g chronic malnutrition,9 which leaves a large portion of <strong>the</strong><br />
world’s children not only shorter than <strong>the</strong>y o<strong>the</strong>rwise would be, but also fac<strong>in</strong>g<br />
cognitive impairment that lasts a lifetime.<br />
More than 80 countries <strong>in</strong> <strong>the</strong> develop<strong>in</strong>g world have child stunt<strong>in</strong>g rates<br />
of 20 percent or more. Thirty of <strong>the</strong>se countries have what are considered to be<br />
“very high” stunt<strong>in</strong>g rates of 40 percent or more.10 Four countries – Afghanistan,<br />
Burundi, Timor-Leste and Yemen – have stunt<strong>in</strong>g rates close to 60 percent.11 As<br />
much as a third of children <strong>in</strong> Asia are stunted12 (100 million of <strong>the</strong> global total).13<br />
In Africa, almost 2 <strong>in</strong> 5 children are stunted – a total of 60 million children.14 This<br />
largely unnoticed child malnutrition crisis is robb<strong>in</strong>g <strong>the</strong> health of tomorrow’s<br />
adults, erod<strong>in</strong>g <strong>the</strong> foundations of <strong>the</strong> global economy, and threaten<strong>in</strong>g global<br />
stability.<br />
thirty Countries have stunt<strong>in</strong>g Rates of 40% or more<br />
Percent of children under age 5 who are moderately or severely stunted<br />
—<br />
Data sources: Who global Database on child growth and Malnutrition (who.<strong>in</strong>t/nutgrowthdb/);<br />
UNiceF global Databases (child<strong>in</strong>fo.org); recent DhS and MicS surveys (as of april 2012)<br />
Chronic malnutrition<br />
Causes three times as<br />
many Child deaths as acute<br />
malnutrition<br />
chronic malnutrition<br />
(stunt<strong>in</strong>g)<br />
acute malnutrition<br />
(severe wast<strong>in</strong>g)<br />
Data not available less than 5 percent 5-19 percent 20-29 percent 30-39 percent 40 percent or more<br />
child<br />
deaths<br />
(1,<strong>000</strong>s)<br />
% of<br />
all child<br />
deaths<br />
1,100 14.5<br />
340 4.4<br />
low birthweight* 250 3.3<br />
total** 1,600 21.4%<br />
—<br />
* Deaths are for low birthweight (lBW) due to <strong>in</strong>trauter<strong>in</strong>e<br />
growth restriction, <strong>the</strong> primary cause of lBW <strong>in</strong> develop<strong>in</strong>g<br />
countries.<br />
** totals do not equal column sums as <strong>the</strong>y take <strong>in</strong>to<br />
account <strong>the</strong> jo<strong>in</strong>t distrubtion of stunt<strong>in</strong>g and severe wast<strong>in</strong>g.<br />
—<br />
Note: <strong>the</strong> share of global under-5 deaths directly attributed<br />
to nutritional status measures are for 2004 as reported<br />
<strong>in</strong> The Lancet (robert e. Black, et al. “Maternal and child<br />
Undernutrition: global and regional exposures and<br />
health consequences,” 2008). total number of deaths are<br />
calculated by <strong>Save</strong> <strong>the</strong> children based on child mortality<br />
<strong>in</strong> 2010 (UNiceF. The State of <strong>the</strong> World’s <strong>Children</strong> 2012,<br />
table 1).
16 <strong>the</strong> gloBal MalNUtritioN criSiS<br />
Four types of malnutrition<br />
Stunt<strong>in</strong>g – A child is too short for <strong>the</strong>ir age.<br />
This is caused by poor diet and frequent<br />
<strong>in</strong>fections. Stunt<strong>in</strong>g generally occurs before<br />
age 2, and <strong>the</strong> effects are largely irreversible.<br />
These <strong>in</strong>clude delayed motor development,<br />
impaired cognitive function and poor<br />
school performance. In total, 171 million<br />
children – 27 percent of all children globally<br />
– are stunted.15 stunted. 15<br />
Wast<strong>in</strong>g – A child’s weight is too low<br />
for <strong>the</strong>ir height. This is caused by acute<br />
malnutrition. Wast<strong>in</strong>g is a strong predic-<br />
tor of mortality among children under 5.<br />
It is usually caused by severe food short-<br />
age or disease. In total, over 60 million<br />
children – 10 percent of all children globally<br />
– are wasted.16 wasted. 16<br />
Underweight – A child’s weight is too low<br />
for <strong>the</strong>ir age. A child can be underweight<br />
because she is stunted, wasted or both.<br />
Weight is a sensitive <strong>in</strong>dicator of short-term<br />
(i.e., acute) undernutrition. Whereas a<br />
deficit <strong>in</strong> height (stunt<strong>in</strong>g) is difficult to<br />
correct, a deficit <strong>in</strong> weight (underweight)<br />
can be recouped if nutrition and health<br />
improve later <strong>in</strong> childhood. Worldwide,<br />
more than 100 million children are underweight.<br />
weight.17 17 Be<strong>in</strong>g underweight is associated<br />
with 19 percent of child deaths. deaths.18 18<br />
Micronutrient deficiency – A child<br />
lacks essential vitam<strong>in</strong>s or m<strong>in</strong>erals.<br />
These <strong>in</strong>clude vitam<strong>in</strong> A, iron and z<strong>in</strong>c.<br />
Micronutrient deficiencies are caused by<br />
a long-term lack of nutritious food or by<br />
<strong>in</strong>fections such as worms. Micronutrient<br />
deficiencies are associated with 10 percent<br />
of all children’s deaths, or about one-third<br />
of all child deaths due to malnutrition.<br />
malnutrition.19 19<br />
maLnUtRition and ChiLd moRtaLity<br />
Every year, 7.6 million children die before <strong>the</strong>y reach <strong>the</strong> age of 5, most<br />
from preventable or treatable illnesses and almost all <strong>in</strong> develop<strong>in</strong>g countries.20<br />
Malnutrition is an underly<strong>in</strong>g cause of more than a third (35 percent) of <strong>the</strong>se<br />
deaths.21<br />
A malnourished child is up to 10 times as likely to die from an easily preventable<br />
or treatable disease as a well-nourished child.22 And a chronically<br />
malnourished child is more vulnerable to acute malnutrition dur<strong>in</strong>g food shortages,<br />
economic crises and o<strong>the</strong>r emergencies.23<br />
Unfortunately, many countries have not made address<strong>in</strong>g malnutrition and<br />
child survival a high-level priority. For <strong>in</strong>stance, a recent analysis by <strong>the</strong> World<br />
Health Organization found that only 67 percent of 121 mostly low- and middle-<strong>in</strong>come<br />
countries had policies to promote breastfeed<strong>in</strong>g. Complementary<br />
feed<strong>in</strong>g and iron and folic acid supplements were <strong>in</strong>cluded <strong>in</strong> little over half of<br />
all national policy documents (55 and 51 percent, respectively). And vitam<strong>in</strong> A<br />
and z<strong>in</strong>c supplementation for children (for <strong>the</strong> treatment of diarrhea) were part<br />
of national policies <strong>in</strong> only 37 percent and 22 percent of countries respectively.24<br />
While nutrition is gett<strong>in</strong>g more high-level commitment than ever before, <strong>the</strong>re<br />
is still a lot of progress to be made.<br />
Persistent and worsen<strong>in</strong>g malnutrition <strong>in</strong> develop<strong>in</strong>g countries is perhaps<br />
<strong>the</strong> s<strong>in</strong>gle biggest obstacle to achiev<strong>in</strong>g many of <strong>the</strong> Millennium Development<br />
Goals (MDGs). These goals – agreed to by all United Nations member states <strong>in</strong><br />
2<strong>000</strong> – set specific targets for end<strong>in</strong>g poverty and improv<strong>in</strong>g human rights and<br />
security. MDG 1 <strong>in</strong>cludes halv<strong>in</strong>g <strong>the</strong> proportion of people liv<strong>in</strong>g <strong>in</strong> hunger.<br />
MDG 2 is to ensure all children complete primary school. MDG 4 aims to<br />
reduce <strong>the</strong> world’s 1990 under-5 mortality rate by two thirds. MDG 5 aims to<br />
reduce <strong>the</strong> 1990 maternal mortality ratio by three quarters. And MDG 6 is to<br />
halt and beg<strong>in</strong> to reverse <strong>the</strong> spread of HIV/AIDS and <strong>the</strong> <strong>in</strong>cidence of malaria<br />
and o<strong>the</strong>r major diseases. Improv<strong>in</strong>g nutrition helps fuel progress toward all<br />
of <strong>the</strong>se MDGs.<br />
With just a few years left until <strong>the</strong> 2015 deadl<strong>in</strong>e, less than a third (22)<br />
of 75 priority countries are on track to achieve <strong>the</strong> poverty and hunger goal<br />
(MDG 1).25 Only half of develop<strong>in</strong>g countries are on target to achieve universal<br />
primary education (MDG 2).26 Just 23 of <strong>the</strong> 75 countries are on track to<br />
achieve <strong>the</strong> child survival goal (MDG 4).27 And just 13 of <strong>the</strong> 75 countries are<br />
on target to achieve <strong>the</strong> maternal mortality goal (MDG 5).28 While new HIV<br />
<strong>in</strong>fections are decl<strong>in</strong><strong>in</strong>g <strong>in</strong> some regions, trends are worrisome <strong>in</strong> o<strong>the</strong>rs.29 Also,<br />
treatment for HIV and AIDS has expanded quickly, but not fast enough to<br />
meet <strong>the</strong> 2010 target for universal access (MDG 6).30<br />
mateRnaL maLnUtRition<br />
Many children are born undernourished because <strong>the</strong>ir mo<strong>the</strong>rs are undernourished.<br />
As much as half of all child stunt<strong>in</strong>g occurs <strong>in</strong> utero,31 underscor<strong>in</strong>g<br />
<strong>the</strong> critical importance of better nutrition for women and girls.<br />
In most develop<strong>in</strong>g countries, <strong>the</strong> nutritional status of women and girls is<br />
compromised by <strong>the</strong> cumulative and synergistic effects of many risk factors.<br />
These <strong>in</strong>clude: limited access to food, lack of power at <strong>the</strong> household level, traditions<br />
and customs that limit women’s consumption of certa<strong>in</strong> nutrient-rich<br />
foods, <strong>the</strong> energy demands of heavy physical labor, <strong>the</strong> nutritional demands<br />
of frequent pregnancies and breastfeed<strong>in</strong>g, and <strong>the</strong> toll of frequent <strong>in</strong>fections<br />
with limited access to health care.<br />
Anemia is <strong>the</strong> most widespread nutritional problem affect<strong>in</strong>g girls and women<br />
<strong>in</strong> develop<strong>in</strong>g countries. It is a significant cause of maternal mortality and<br />
can cause premature birth and low birthweight. In <strong>the</strong> develop<strong>in</strong>g world, 40
S av e t h e c h i l D r e N · S tat e o F t h e Wo r l D ’ S M ot h e r S 2 0 1 2 17<br />
determ<strong>in</strong>ants of Child nutrition and examples of how to address <strong>the</strong>m<br />
immediate CaUses<br />
<strong>in</strong>teRmediate CaUses<br />
UndeRLy<strong>in</strong>g CaUses<br />
Food/Nutrient<br />
<strong>in</strong>take<br />
access to<br />
and availability of<br />
Nutritious Food<br />
<strong>in</strong>stitutions political<br />
and ideological<br />
Framework<br />
chilD NUtritioN<br />
Maternal<br />
and child care<br />
practices<br />
economic<br />
Structure<br />
health Status<br />
Water/Sanitation<br />
and health Services<br />
resources:<br />
environment,<br />
technology, people<br />
percent of non-pregnant women and half (49 percent) of pregnant women are<br />
anemic.32 Anemia is caused by poor diet and can be exacerbated by <strong>in</strong>fectious<br />
diseases, particularly malaria and <strong>in</strong>test<strong>in</strong>al parasites. Pregnant adolescents are<br />
more prone to anemia than older women, and are at additional risk because<br />
<strong>the</strong>y are often less likely to receive health care. Anemia prevalence is especially<br />
high <strong>in</strong> Asia and Africa, but even <strong>in</strong> Lat<strong>in</strong> America and <strong>the</strong> Caribbean, one<br />
quarter of women are anemic.33<br />
Many women <strong>in</strong> <strong>the</strong> develop<strong>in</strong>g world are short <strong>in</strong> stature and/or underweight.<br />
These conditions are usually caused by malnutrition dur<strong>in</strong>g childhood<br />
and adolescence. A woman who is less than 145 cm or 4'7" is considered to be<br />
stunted. Stunt<strong>in</strong>g among women is particularly severe <strong>in</strong> South Asia, where<br />
<strong>in</strong> some countries – for example, Bangladesh, India and Nepal – more than 10<br />
percent of women aged 15-49 are stunted. Rates are similarly high <strong>in</strong> Bolivia<br />
and Peru. And <strong>in</strong> Guatemala, an alarm<strong>in</strong>g 29 percent of women are stunted.<br />
These women face higher risks of complications dur<strong>in</strong>g childbirth and of hav<strong>in</strong>g<br />
small babies. Maternal underweight means a body-mass <strong>in</strong>dex of less than<br />
18.5 kg/m2 and <strong>in</strong>dicates chronic energy deficiency. Ten to 20 percent of <strong>the</strong><br />
women <strong>in</strong> sub-Saharan Africa and 25-35 percent of <strong>the</strong> women <strong>in</strong> South Asia<br />
are classified as excessively th<strong>in</strong>.34 The risk of hav<strong>in</strong>g a small baby is even greater<br />
for mo<strong>the</strong>rs who are underweight (as compared to stunted).35<br />
In many develop<strong>in</strong>g countries, it is common for girls to marry and beg<strong>in</strong><br />
hav<strong>in</strong>g babies while still <strong>in</strong> <strong>the</strong>ir teens – before <strong>the</strong>ir bodies have fully matured.<br />
Younger mo<strong>the</strong>rs tend to have fewer economic resources, less education, less<br />
health care, and <strong>the</strong>y are more likely to be malnourished when <strong>the</strong>y become<br />
pregnant, multiply<strong>in</strong>g <strong>the</strong> risks to <strong>the</strong>mselves and <strong>the</strong>ir children. Teenagers<br />
who give birth when <strong>the</strong>ir own bodies have yet to f<strong>in</strong>ish grow<strong>in</strong>g are at greater<br />
risk of hav<strong>in</strong>g undernourished babies. The younger a girl is when she becomes<br />
pregnant, <strong>the</strong> greater <strong>the</strong> risks to her health and <strong>the</strong> more likely she is to have<br />
a low-birthweight baby.36<br />
<strong>in</strong>terventions<br />
Breastfeed<strong>in</strong>g, complementary feed<strong>in</strong>g,<br />
hygiene, micronutrient supplementation<br />
and fortification<br />
<strong>in</strong>terventions<br />
Social protection, health system<br />
streng<strong>the</strong>n<strong>in</strong>g, nutrition-sensitive<br />
agriculture and food security<br />
programs, water and sanitation, girls<br />
education, women’s empowerment<br />
<strong>in</strong>terventions<br />
poverty reduction and economic<br />
growth programs, governance,<br />
<strong>in</strong>stitutional capacity, environmental<br />
safeguards, conflict resolution<br />
—<br />
adapted from UNiceF. Strategy for Improved <strong>Nutrition</strong> of <strong>Children</strong> and Women <strong>in</strong> Develop<strong>in</strong>g Countries, (New york: 1990); Marie ruel. “address<strong>in</strong>g <strong>the</strong> Underly<strong>in</strong>g Determ<strong>in</strong>ants of Undernutrition:<br />
examples of Successful <strong>in</strong>tegration of <strong>Nutrition</strong> <strong>in</strong> poverty reduction and agriculture Strategies,” SCN News 2008; World Bank, Mov<strong>in</strong>g Towards Consensus. A Global Action Plan for Scal<strong>in</strong>g up <strong>Nutrition</strong><br />
Investments. gap presentation. Draft 2011; <strong>Save</strong> <strong>the</strong> children, A Life Free From Hunger, (london: 2012)<br />
<strong>the</strong> <strong>in</strong>tergenerational<br />
Cycle of growth Failure<br />
LOW BIRTH<br />
WEIGHT BABY<br />
CHILD GROWTH<br />
FAILURE<br />
EARLY<br />
PREGNANCY<br />
SMALL ADULT<br />
WOMEN<br />
LOW WEIGHT<br />
AND HEIGHT<br />
IN TEENS<br />
—<br />
adapted from adm<strong>in</strong>istrative committee on coord<strong>in</strong>ation/<br />
Subcommittee on <strong>Nutrition</strong> (United Nations), Second Report<br />
on <strong>the</strong> World <strong>Nutrition</strong> Situation (geneva: 1992).
18 <strong>the</strong> gloBal MalNUtritioN criSiS<br />
Ris<strong>in</strong>g Food Prices Can<br />
hurt mo<strong>the</strong>rs and <strong>Children</strong><br />
As global food prices rema<strong>in</strong> high and<br />
volatile, poor mo<strong>the</strong>rs and children <strong>in</strong><br />
develop<strong>in</strong>g countries can have little choice<br />
but to cut back on <strong>the</strong> quantity and qual-<br />
ity of <strong>the</strong> food <strong>the</strong>y eat. The World Bank<br />
estimates that ris<strong>in</strong>g food prices pushed an<br />
additional 44 million people <strong>in</strong>to poverty<br />
between June 2010 and February 2011. 2011.37 37<br />
Staple food prices hit record highs <strong>in</strong><br />
February 2011 and may have put <strong>the</strong> lives of<br />
more than 400,<strong>000</strong> more children at risk. risk.38 38<br />
Poor families <strong>in</strong> develop<strong>in</strong>g countries<br />
typically spend between 50 to 70 percent<br />
of <strong>the</strong>ir <strong>in</strong>come on food. food.39 39 When meat,<br />
fish, eggs, fruit and vegetables become too<br />
expensive, families often turn to cheaper<br />
cereals and gra<strong>in</strong>s, which offer fewer<br />
nutrients. Studies show that women tend<br />
to cut <strong>the</strong>ir food consumption first, and as<br />
a crisis deepens, o<strong>the</strong>r adults and eventually<br />
children cut back.40 back. 40<br />
When pregnant mo<strong>the</strong>rs and young<br />
children are deprived of essential nutrients<br />
dur<strong>in</strong>g a critical period <strong>in</strong> <strong>the</strong>ir develop-<br />
ment, <strong>the</strong> results are often devastat<strong>in</strong>g.<br />
Mo<strong>the</strong>rs experience higher rates of anemia<br />
and chronic energy deficiency. Childbirth<br />
becomes more risky, and babies are more<br />
likely to be born at low birthweight.<br />
<strong>Children</strong> face <strong>in</strong>creased risk of stunt<strong>in</strong>g,<br />
acute malnutrition and death.<br />
BaRRieRs to BReastFeed<strong>in</strong>g<br />
Experts recommend that children be breastfed with<strong>in</strong> one hour of birth,<br />
exclusively breastfed for <strong>the</strong> first 6 months, and <strong>the</strong>n breastfed until age 2<br />
with age-appropriate, nutritionally adequate and safe complementary foods.<br />
Optimal feed<strong>in</strong>g accord<strong>in</strong>g to <strong>the</strong>se standards can prevent an estimated 19 percent<br />
of all under-5 deaths, more than any o<strong>the</strong>r child survival <strong>in</strong>tervention.41<br />
Yet worldwide, <strong>the</strong> vast majority of children are not breastfed optimally.<br />
What are some of <strong>the</strong> reasons for this? Cultural beliefs, lack of knowledge<br />
and mis<strong>in</strong>formation play major roles. Many women and family members are<br />
unaware of <strong>the</strong> benefits of exclusive breastfeed<strong>in</strong>g. New mo<strong>the</strong>rs may be told<br />
<strong>the</strong>y should wait several hours or days after <strong>the</strong>ir baby is born to beg<strong>in</strong> breastfeed<strong>in</strong>g.<br />
Aggressive market<strong>in</strong>g of <strong>in</strong>fant formula often gives <strong>the</strong> impression that<br />
human milk is less modern and thus less healthy for <strong>in</strong>fants than commercial<br />
formula. Or mo<strong>the</strong>rs may be told <strong>the</strong>ir breast milk is “bad” or does not conta<strong>in</strong><br />
sufficient nutrients, so <strong>the</strong>y <strong>in</strong>troduce o<strong>the</strong>r liquids and solid food too early.<br />
Most breastfeed<strong>in</strong>g problems occur <strong>in</strong> <strong>the</strong> first two weeks of a child’s life. If<br />
a mo<strong>the</strong>r experiences pa<strong>in</strong> or <strong>the</strong> baby does not latch, an <strong>in</strong>experienced mo<strong>the</strong>r<br />
may give up. Support from fa<strong>the</strong>rs, mo<strong>the</strong>rs-<strong>in</strong>-law, peer groups and health<br />
workers can help a mo<strong>the</strong>r to ga<strong>in</strong> confidence, overcome obstacles and prolong<br />
exclusive breastfeed<strong>in</strong>g.<br />
Women often stop breastfeed<strong>in</strong>g because <strong>the</strong>y return to work. Many aren’t<br />
provided with paid maternity leave or time and a private place to breastfeed<br />
or express <strong>the</strong>ir breast milk. Legislation around maternity leave and policies<br />
that provide time, space, and support for breastfeed<strong>in</strong>g <strong>in</strong> <strong>the</strong> workplace could<br />
reduce this barrier. For mo<strong>the</strong>rs who work <strong>in</strong> farm<strong>in</strong>g or <strong>the</strong> <strong>in</strong>formal sector,<br />
family and community support can help <strong>the</strong>m to cont<strong>in</strong>ue breastfeed<strong>in</strong>g, even<br />
after return<strong>in</strong>g to work. Also many countries need better laws and enforcement<br />
to protect women from persecution or harassment for breastfeed<strong>in</strong>g <strong>in</strong> public.<br />
Countries mak<strong>in</strong>g <strong>the</strong> Fastest and slowest ga<strong>in</strong>s aga<strong>in</strong>st<br />
Child malnutrition, ~1990-2010<br />
top 15 countries<br />
with fastest progress<br />
(annual % decrease <strong>in</strong> stunt<strong>in</strong>g)<br />
Bottom 15 countries<br />
with no progress<br />
(annual % <strong>in</strong>crease <strong>in</strong> stunt<strong>in</strong>g)<br />
Uzbekistan 6.7%<br />
angola 6.6%<br />
ch<strong>in</strong>a 6.3%<br />
Kyrgyzstan 6.3%<br />
turkmenistan 6.3%<br />
Dpr Korea 5.6%<br />
Brazil 5.5%<br />
Mauritania 4.6%<br />
eritrea 4.4%<br />
vietnam 4.3%<br />
Mexico 3.1%<br />
Bangladesh 2.9%<br />
Nepal 2.6%<br />
<strong>in</strong>donesia 2.6%<br />
cambodia 2.5%<br />
Sierra leone 0.0%<br />
Niger -0.2%<br />
Djibouti -0.4%<br />
Zimbabwe -0.5%<br />
lesotho -0.5%<br />
Burundi -0.5%<br />
gu<strong>in</strong>ea -0.8%<br />
Mali -0.9%<br />
yemen -1.0%<br />
central african republic -1.4%<br />
afghanistan -1.6%<br />
comoros -2.3%<br />
côte d'ivoire -2.6%<br />
Ben<strong>in</strong> -2.6%<br />
Somalia -6.3%<br />
-8% -6% -4% -2% 0% 2% 4% 6% 8%<br />
average annual rate of reduction <strong>in</strong> child stunt<strong>in</strong>g (%), ~1990-2010<br />
—<br />
Note: trend analysis <strong>in</strong>cluded all 71 of 75 Countdown countries with available data for <strong>the</strong> approximate period 1990-2010.<br />
For country-level data, see Methodology and research Notes. Data Sources: Who global Database on child growth<br />
and Malnutrition (who.<strong>in</strong>t/nutgrowthdb/); UNiceF global Databases (child<strong>in</strong>fo.org); countdown to 2015. Accountability for<br />
Maternal, Newborn & Child Survival: An Update on Progress <strong>in</strong> Priority Countries. (Who: 2012); recent DhS and MicS surveys (as<br />
of april 2012)
S av e t h e c h i l D r e N · S tat e o F t h e Wo r l D ’ S M ot h e r S 2 0 1 2 19<br />
africa is expected to overtake asia as <strong>the</strong> Region most heavily Burdened by malnutrition<br />
200<br />
180<br />
160<br />
140<br />
120<br />
100<br />
80<br />
60<br />
40<br />
20<br />
0<br />
estimated number of stunted children (millions) estimated % of children stunted<br />
asia<br />
africa<br />
1990 1995 2<strong>000</strong> 2005 2010 2015 2020<br />
—<br />
Source: Mercedes de onis, Monika Blössner and ela<strong>in</strong>e Borghi, “prevalence and trends of Stunt<strong>in</strong>g among pre-School children,<br />
1990-2020,” Public Health <strong>Nutrition</strong>, vol.15, No.1, July 14, 2011, pp.142-148<br />
<strong>in</strong>sUFFiCient PRogRess<br />
Globally, <strong>the</strong>re have been modest improvements <strong>in</strong> child malnutrition rates<br />
<strong>in</strong> <strong>the</strong> past two decades; however, <strong>the</strong> pace of progress has varied considerably<br />
across regions and countries. Between 1990 and 2010, child stunt<strong>in</strong>g rates fell<br />
globally by one third, from 40 to 27 percent. Asia, as a region, reduced stunt<strong>in</strong>g<br />
dramatically dur<strong>in</strong>g this period, from 49 to 28 percent.42 The Africa region, <strong>in</strong><br />
contrast, shows little evidence of improvement, and not much is anticipated<br />
over <strong>the</strong> next decade.43 In Lat<strong>in</strong> America and <strong>the</strong> Caribbean, overall stunt<strong>in</strong>g<br />
prevalence is fall<strong>in</strong>g; however, stunt<strong>in</strong>g levels rema<strong>in</strong> high <strong>in</strong> many countries<br />
(for example: Guatemala, Haiti and Honduras).44<br />
Angola and Uzbekistan are <strong>the</strong> two priority countries45 that have made <strong>the</strong><br />
fastest progress <strong>in</strong> reduc<strong>in</strong>g child malnutrition – both cut stunt<strong>in</strong>g rates <strong>in</strong> half<br />
<strong>in</strong> about 10 years. Brazil, Ch<strong>in</strong>a and Vietnam have also made impressive ga<strong>in</strong>s,<br />
each cutt<strong>in</strong>g stunt<strong>in</strong>g rates by over 60 percent <strong>in</strong> <strong>the</strong> past 20 years.<br />
Stunt<strong>in</strong>g rates have decl<strong>in</strong>ed significantly <strong>in</strong> a number of <strong>the</strong> poorest countries<br />
<strong>in</strong> <strong>the</strong> world – <strong>in</strong>clud<strong>in</strong>g Bangladesh, Cambodia, Eritrea, Kyrgyzstan and<br />
Nepal – underscor<strong>in</strong>g that marked improvements can be achieved even <strong>in</strong><br />
resource-constra<strong>in</strong>ed sett<strong>in</strong>gs.<br />
Stunt<strong>in</strong>g rates have gotten worse <strong>in</strong> 14 countries, most of <strong>the</strong>m <strong>in</strong> sub-<br />
Saharan Africa. Somalia has shown <strong>the</strong> worst regression – stunt<strong>in</strong>g rates <strong>in</strong> that<br />
country <strong>in</strong>creased from 29 to 42 percent from 2<strong>000</strong>-2006, <strong>the</strong> only years for<br />
which data are available. Afghanistan – <strong>the</strong> most populous of <strong>the</strong> 14 countries<br />
– has seen stunt<strong>in</strong>g <strong>in</strong>crease by 11 percent. In both Somalia and Afghanistan,<br />
war and conflict have likely played a significant role <strong>in</strong> stunt<strong>in</strong>g rate <strong>in</strong>creases.<br />
60<br />
50<br />
40<br />
30<br />
20<br />
10<br />
0<br />
africa<br />
asia<br />
1990 1995 2<strong>000</strong> 2005 2010 2015 2020
20 <strong>the</strong> gloBal MalNUtritioN criSiS<br />
eConomiC gRowth isn’t enoUgh<br />
While children who live <strong>in</strong> impoverished countries are at higher risk for<br />
malnutrition and stunt<strong>in</strong>g, poverty alone does not expla<strong>in</strong> high malnutrition<br />
rates for children. A number of relatively poor countries are do<strong>in</strong>g an admirable<br />
job of tackl<strong>in</strong>g this problem, while o<strong>the</strong>r countries with greater resources are<br />
not do<strong>in</strong>g so well.<br />
Political commitment, supportive policies and effective strategies have a lot<br />
to do with success <strong>in</strong> fight<strong>in</strong>g child malnutrition. This is demonstrated by an<br />
analysis of stunt<strong>in</strong>g rates and gross domestic product (GDP) <strong>in</strong> 127 developed<br />
and develop<strong>in</strong>g countries. For example: India has a GDP per capita of $1,500<br />
and 48 percent of its children are stunted. Compare this to Vietnam where <strong>the</strong><br />
GDP per capita is $1,200 and <strong>the</strong> child stunt<strong>in</strong>g rate is 23 percent. Nigeria and<br />
Ghana both have a GDP per capita around $1,250, but Nigeria’s child stunt<strong>in</strong>g<br />
rate is 41 percent, while Ghana’s is 29 percent.<br />
Countries that are perform<strong>in</strong>g better on child nutrition than <strong>the</strong>ir national<br />
wealth might suggest <strong>in</strong>clude: Brazil, Chile, Costa Rica, Kyrgyzstan, Mongolia,<br />
Senegal and Tunisia. Countries that are underperform<strong>in</strong>g relative to <strong>the</strong>ir GDP<br />
<strong>in</strong>clude: Botswana, Equatorial Gu<strong>in</strong>ea, Guatemala, Indonesia, Mexico, Panama,<br />
Peru, South Africa and Venezuela.<br />
Countries Fall<strong>in</strong>g above and Below expectations Based on gdP<br />
% <strong>Children</strong> under-5 moderately or severely stunted<br />
60<br />
50<br />
40<br />
30<br />
20<br />
10<br />
0<br />
Kenya<br />
ghana<br />
haiti<br />
Senegal<br />
Bolivia<br />
gambia<br />
vietnam<br />
afghanistan<br />
guatemala<br />
<strong>in</strong>donesia<br />
Sierra leone<br />
Kyrgyzstan<br />
Mongolia<br />
Namibia<br />
Botswana<br />
azerbajan<br />
gabon<br />
South africa<br />
peru libya<br />
panama<br />
Mexico venezuela<br />
Uruguay<br />
Moldova ch<strong>in</strong>a<br />
tunisia<br />
Brazil<br />
Ukra<strong>in</strong>e<br />
costa rica<br />
Jamaica<br />
chile<br />
czech republic<br />
equatorial gu<strong>in</strong>ea<br />
overperform<strong>in</strong>g relative to gdP<br />
Underperform<strong>in</strong>g relative to gdP<br />
$0 $10,<strong>000</strong> $20,<strong>000</strong> $30,<strong>000</strong> $40,<strong>000</strong> $50,<strong>000</strong><br />
r 2 =0.61<br />
gdP per capita (2010 Us$)<br />
50%<br />
Malawi<br />
Niger<br />
ethiopia<br />
tanzania<br />
Nepal<br />
40%<br />
Uganda<br />
Mali<br />
S<strong>in</strong>gapore<br />
Madagascar<br />
<strong>in</strong>dia<br />
Bangladesh<br />
pakistan<br />
Nigeria<br />
Kuwait<br />
germany<br />
cambodia<br />
côte d’ivoire<br />
—<br />
Note: all 127 countries with available data were <strong>in</strong>cluded <strong>in</strong> this analysis. Stunt<strong>in</strong>g rates are for <strong>the</strong> latest available year 2<strong>000</strong>-<br />
2010. Data sources: Who global Database on child growth and Malnutrition (who.<strong>in</strong>t/nutgrowthdb/); UNiceF global<br />
Databases (child<strong>in</strong>fo.org); recent DhS and MicS (as of March 2012) and <strong>the</strong> World Bank, World Development <strong>in</strong>dicators<br />
(data.worldbank.org/<strong>in</strong>dicator)<br />
USa
S av e t h e c h i l D r e N · S tat e o F t h e Wo r l D ’ S M ot h e r S 2 0 1 2 21<br />
maLnUtRition among <strong>the</strong> PooR<br />
Most malnourished children tend to be poor. Generally speak<strong>in</strong>g, children<br />
<strong>in</strong> <strong>the</strong> poorest households are more than twice as likely to be stunted or<br />
underweight as children <strong>in</strong> <strong>the</strong> richest households.46 For many of <strong>the</strong>se families,<br />
social protection programs and <strong>in</strong>come-generat<strong>in</strong>g opportunities can play an<br />
important role <strong>in</strong> contribut<strong>in</strong>g to better nutrition. However, <strong>in</strong> many countries,<br />
stunt<strong>in</strong>g can be relatively high even among <strong>the</strong> better-off families,47 show<strong>in</strong>g<br />
that knowledge, behavior and o<strong>the</strong>r factors also play a part.<br />
Across all develop<strong>in</strong>g regions, malnutrition is highest <strong>in</strong> <strong>the</strong> poorest households.<br />
In South Asia, <strong>the</strong> poorest children are almost three times as likely to be<br />
underweight as <strong>the</strong>ir wealthiest peers.48 Lat<strong>in</strong> America has some of <strong>the</strong> largest<br />
<strong>in</strong>equities. The poorest children <strong>in</strong> Guatemala and Nicaragua are more than<br />
six times as likely to be underweight as <strong>the</strong>ir wealthy peers. In Honduras, <strong>the</strong>y<br />
are eight times as likely, and <strong>in</strong> El Salvador and Peru, <strong>the</strong>y are 13 and 16 times<br />
as likely to be underweight.49<br />
The relationship between stunt<strong>in</strong>g and wealth varies across countries. In<br />
countries such as Bolivia, India, Nigeria and Peru, children <strong>in</strong> <strong>the</strong> richest households<br />
are at a dist<strong>in</strong>ct advantage compared to children <strong>in</strong> o<strong>the</strong>r households.50<br />
This contrasts with Ethiopia, where stunt<strong>in</strong>g is widespread. Even among children<br />
liv<strong>in</strong>g <strong>in</strong> <strong>the</strong> wealthiest Ethiopian households, <strong>the</strong> prevalence of stunt<strong>in</strong>g<br />
is high, at 30 percent.51 Similarly, <strong>in</strong> Bangladesh, stunt<strong>in</strong>g <strong>in</strong> children less than<br />
5 years of age is found <strong>in</strong> one-fourth of <strong>the</strong> richest households.52 And <strong>in</strong> Egypt,<br />
stunt<strong>in</strong>g prevalence is remarkably similar across <strong>in</strong>come groups (30 percent and<br />
27 percent among <strong>the</strong> poorest and richest households, respectively).53<br />
The poorest children also tend to have <strong>the</strong> poorest dietary quality. In Ethiopia,<br />
Kenya and Nigeria, for example, <strong>the</strong> wealthiest children are twice as likely to<br />
consume animal source foods as <strong>the</strong> poorest. In South Africa, <strong>the</strong>y're almost<br />
three times as likely.54<br />
guatemala
South Sudan<br />
22 chapter title goeS here
S av e t h e c h i l D r e N · S tat e o F t h e Wo r l D ’ S M ot h e r S 2 0 1 2 23<br />
SaviNg liveS aND BUilDiNg a Better FUtUre:<br />
loW-coSt SolUtioNS that WorK<br />
Here is a look at six key nutrition solutions that have <strong>the</strong> greatest potential<br />
to save lives <strong>in</strong> a child’s first 1,<strong>000</strong> days and beyond.55 Us<strong>in</strong>g a new evidencebased<br />
tool,56 <strong>Save</strong> <strong>the</strong> <strong>Children</strong> has calculated that nearly 1.3 million children’s<br />
lives could be saved each year if <strong>the</strong>se six <strong>in</strong>terventions are fully implemented<br />
at scale <strong>in</strong> <strong>the</strong> 12 countries most heavily burdened by child malnutrition and<br />
under-5 mortality.<br />
Implement<strong>in</strong>g <strong>the</strong>se solutions globally could save more than 2 million lives,<br />
and would not require massive <strong>in</strong>vestments <strong>in</strong> health <strong>in</strong>frastructure. In fact,<br />
with <strong>the</strong> help of frontl<strong>in</strong>e health workers, all six of <strong>the</strong>se <strong>in</strong>terventions can be<br />
delivered fairly rapidly us<strong>in</strong>g health systems that are already <strong>in</strong> place <strong>in</strong> most<br />
develop<strong>in</strong>g countries. What is lack<strong>in</strong>g is <strong>the</strong> political will and relatively small<br />
amount of money needed to take <strong>the</strong>se proven solutions to <strong>the</strong> women and<br />
children who need <strong>the</strong>m most.<br />
Three of <strong>the</strong> six solutions – iron, vitam<strong>in</strong> A and z<strong>in</strong>c – are typically packaged<br />
as capsules cost<strong>in</strong>g pennies per dose, or about $1 to $2 per person, per year. The<br />
o<strong>the</strong>r three solutions – breastfeed<strong>in</strong>g, complementary feed<strong>in</strong>g and good hygiene<br />
– are behavior-change solutions, which are implemented through outreach,<br />
education and community support. The World Bank estimates <strong>the</strong>se latter three<br />
solutions could be delivered through community nutrition programs at a cost<br />
of $15 per household or $7.50 per child.57 All comb<strong>in</strong>ed, <strong>the</strong> entire lifesav<strong>in</strong>g<br />
package costs less than $20 per child for <strong>the</strong> first 1,<strong>000</strong> days.58<br />
Breastfeed<strong>in</strong>g, when practiced optimally, is one of <strong>the</strong> most effective child<br />
survival <strong>in</strong>terventions available today. Optimal feed<strong>in</strong>g from birth to age 2<br />
can prevent an estimated 19 percent of all under-5 deaths, more than any o<strong>the</strong>r<br />
<strong>in</strong>tervention.59 However <strong>the</strong>re are also o<strong>the</strong>r feed<strong>in</strong>g practices and <strong>in</strong>terventions<br />
that are needed to ensure good nutrition <strong>in</strong> develop<strong>in</strong>g countries (see sidebar<br />
on this page and graphic on page 27).<br />
Given <strong>the</strong> close l<strong>in</strong>k between malnutrition and <strong>in</strong>fections, key <strong>in</strong>terventions<br />
to prevent and treat <strong>in</strong>fections will contribute to better nutrition as well as<br />
reduced mortality. These <strong>in</strong>terventions <strong>in</strong>clude good hygiene practices and hand<br />
wash<strong>in</strong>g, sanitation and access to safe dr<strong>in</strong>k<strong>in</strong>g water (which reduce diarrhea<br />
and o<strong>the</strong>r parasitic diseases to which undernourished children are particularly<br />
vulnerable) and oral rehydration salts and <strong>the</strong>rapeutic z<strong>in</strong>c to treat diarrhea.<br />
<strong>the</strong> six LiFesaV<strong>in</strong>g soLUtions aRe:<br />
Iron folate supplements – Iron deficiency anemia, <strong>the</strong> most common<br />
nutritional disorder <strong>in</strong> <strong>the</strong> world, is a significant cause of maternal mortality,<br />
<strong>in</strong>creas<strong>in</strong>g <strong>the</strong> risk of hemorrhage and <strong>in</strong>fection dur<strong>in</strong>g childbirth. It may also<br />
cause premature birth and low birthweight. At least 25 percent – or 1.6 billion<br />
people – are estimated to be anemic, and millions more are iron deficient, <strong>the</strong><br />
vast majority of <strong>the</strong>m women.60 A range of factors cause iron deficiency anemia,<br />
<strong>in</strong>clud<strong>in</strong>g <strong>in</strong>adequate diet, blood loss associated with menstruation, and<br />
parasitic <strong>in</strong>fections such as hookworm. Anemia also affects children, lower<strong>in</strong>g<br />
resistance to disease and weaken<strong>in</strong>g a child’s learn<strong>in</strong>g ability and physical<br />
stam<strong>in</strong>a. Recent studies suggest that pregnant women who take iron folate<br />
supplements not only lower <strong>the</strong>ir risk of dy<strong>in</strong>g <strong>in</strong> childbirth, <strong>the</strong>y also enhance<br />
<strong>the</strong> <strong>in</strong>tellectual development of <strong>the</strong>ir babies.61 Iron supplements for pregnant<br />
women cost just $2 per pregnancy.62 It is estimated that 19 percent of maternal<br />
deaths could be prevented if all women took iron supplements while pregnant.63<br />
what else is needed to<br />
Fight malnutrition and<br />
save Lives?<br />
In 2008, world nutrition experts worked<br />
toge<strong>the</strong>r to identify a group of 13 cost-<br />
effective direct nutrition <strong>in</strong>terventions,<br />
which were published <strong>in</strong> <strong>the</strong> Lancet medical<br />
journal. It was estimated that if <strong>the</strong>se<br />
<strong>in</strong>terventions were scaled up to reach every<br />
mo<strong>the</strong>r and child <strong>in</strong> <strong>the</strong> 36 countries that<br />
are home to 90 percent of malnourished<br />
children, approximately 25 percent of child<br />
deaths could be prevented. There would<br />
also be substantial reductions <strong>in</strong> childhood<br />
illnesses and stunt<strong>in</strong>g. stunt<strong>in</strong>g.64 64<br />
Experts also agreed that to make an even<br />
greater impact on reduc<strong>in</strong>g chronic malnu-<br />
trition, short- and long-term approaches are<br />
required across multiple sectors <strong>in</strong>volv-<br />
<strong>in</strong>g health, social protection, agriculture,<br />
economic growth, education and women’s<br />
empowerment.<br />
In 2010, experts from <strong>the</strong> Scal<strong>in</strong>g Up<br />
<strong>Nutrition</strong> (SUN) movement recommended<br />
a slightly revised group of 13 programprogram- matically feasible, evidence-based direct<br />
nutrition <strong>in</strong>terventions. <strong>in</strong>terventions. The “lifesav<strong>in</strong>g<br />
six” solutions profiled <strong>in</strong> this report are<br />
a subset of both <strong>the</strong> 13 Lancet and <strong>the</strong> 13<br />
SUN <strong>in</strong>terventions. The o<strong>the</strong>r seven SUN<br />
<strong>in</strong>terventions are:<br />
• Multiple micronutrient powders<br />
• Deworm<strong>in</strong>g drugs for children (to reduce<br />
loss of nutrients)<br />
• Salt iodization<br />
• Iodized oil capsules where iodized salt is<br />
unavailable<br />
• Iron fortification of staple foods<br />
• Supplemental feed<strong>in</strong>g for moderately mal-<br />
nourished children with special foods<br />
• Treatment of severe malnutrition with<br />
ready-to-use <strong>the</strong>rapeutic foods (RUTF)
24 SaviNg liveS aND BUilDiNg a Better FUtUre: loW-coSt SolUtioNS that WorK<br />
Promot<strong>in</strong>g and support<strong>in</strong>g<br />
early <strong>in</strong>itiation of<br />
Breastfeed<strong>in</strong>g<br />
Despite its benefits, many women delay<br />
<strong>in</strong>itiation of breastfeed<strong>in</strong>g. Only 43 percent<br />
of newborns <strong>in</strong> develop<strong>in</strong>g countries are<br />
put to <strong>the</strong> breast with<strong>in</strong> one hour of birth.<br />
Establish<strong>in</strong>g good breastfeed<strong>in</strong>g practices<br />
<strong>in</strong> <strong>the</strong> first days is critical to <strong>the</strong> health of<br />
<strong>the</strong> <strong>in</strong>fant and to breastfeed<strong>in</strong>g success.<br />
Initiat<strong>in</strong>g breastfeed<strong>in</strong>g is easiest and most<br />
successful when a mo<strong>the</strong>r is physically<br />
and psychologically prepared for birth and<br />
breastfeed<strong>in</strong>g and when she is <strong>in</strong>formed,<br />
supported, and confident of her ability to<br />
care for her newborn. The follow<strong>in</strong>g actions<br />
can <strong>in</strong>crease rates of early <strong>in</strong>itiation of<br />
breastfeed<strong>in</strong>g:<br />
• Identify <strong>the</strong> practices, beliefs, concerns<br />
and constra<strong>in</strong>ts to early and exclusive<br />
breastfeed<strong>in</strong>g and address <strong>the</strong>m through<br />
appropriate messages and changes <strong>in</strong><br />
delivery and postnatal procedures<br />
• Counsel women dur<strong>in</strong>g prenatal care on<br />
early <strong>in</strong>itiation and exclusive breastfeed<strong>in</strong>g<br />
• Upgrade <strong>the</strong> skills of birth attendants to<br />
support early and exclusive breastfeed<strong>in</strong>g<br />
• Make sk<strong>in</strong>-to-sk<strong>in</strong> contact and <strong>in</strong>itiation<br />
of breastfeed<strong>in</strong>g <strong>the</strong> first rout<strong>in</strong>e after<br />
delivery<br />
• Praise <strong>the</strong> mo<strong>the</strong>r for giv<strong>in</strong>g colostrum<br />
(<strong>the</strong> “first milk”), provide ongo<strong>in</strong>g<br />
encouragement, and assist with position-<br />
<strong>in</strong>g and attachment<br />
Breastfeed<strong>in</strong>g – Human breast milk provides all <strong>the</strong> nutrients newborns<br />
need for healthy development and also provides important antibodies aga<strong>in</strong>st<br />
common childhood illnesses. Exclusive breastfeed<strong>in</strong>g prevents babies from<br />
<strong>in</strong>gest<strong>in</strong>g contam<strong>in</strong>ated water that could be mixed with <strong>in</strong>fant formula. The<br />
protective benefits of breastfeed<strong>in</strong>g have been shown to be most significant with<br />
6 months of exclusive breastfeed<strong>in</strong>g and with cont<strong>in</strong>uation after 6 months, <strong>in</strong><br />
comb<strong>in</strong>ation with nutritious complementary foods (solids), up to age 2. In<br />
conditions that normally exist <strong>in</strong> develop<strong>in</strong>g countries, breastfed children are<br />
at least 6 times more likely to survive <strong>in</strong> <strong>the</strong> early months than non-breastfed<br />
children.65<br />
Complementary feed<strong>in</strong>g – When breast milk alone is no longer sufficient<br />
to meet a child’s nutritional needs, o<strong>the</strong>r foods and liquids must be added<br />
to a child’s diet <strong>in</strong> addition to breast milk. Optimal complementary feed<strong>in</strong>g<br />
<strong>in</strong>volves factors such as <strong>the</strong> quantity and quality of food, frequency and<br />
timel<strong>in</strong>ess of feed<strong>in</strong>g, food hygiene, and feed<strong>in</strong>g dur<strong>in</strong>g/after illnesses. The<br />
target range for complementary feed<strong>in</strong>g is 6-23 months.66 WHO notes that<br />
breastfeed<strong>in</strong>g should not be decreased when start<strong>in</strong>g complementary feed<strong>in</strong>g;<br />
complementary foods should be given with a spoon or a cup, not <strong>in</strong> a bottle;<br />
foods should be clean, safe and locally available; and ample time should be given<br />
for young children to learn to eat solid foods.67 Rates of malnutrition among<br />
children usually peak dur<strong>in</strong>g <strong>the</strong> time of complementary feed<strong>in</strong>g. Growth<br />
falter<strong>in</strong>g is most evident between 6-12 months, when foods of low nutrient<br />
density beg<strong>in</strong> to replace breast milk and rates of diarrheal illness due to food<br />
contam<strong>in</strong>ation are at <strong>the</strong>ir highest.68 Dur<strong>in</strong>g <strong>the</strong> past decade, <strong>the</strong>re has been<br />
considerable improvement <strong>in</strong> breastfeed<strong>in</strong>g practices <strong>in</strong> many countries; however,<br />
similar progress has not been made <strong>in</strong> <strong>the</strong> area of complementary feed<strong>in</strong>g.<br />
Complementary feed<strong>in</strong>g is a proven <strong>in</strong>tervention that can significantly reduce<br />
stunt<strong>in</strong>g dur<strong>in</strong>g <strong>the</strong> first two years of life.69 If all children <strong>in</strong> <strong>the</strong> develop<strong>in</strong>g<br />
world received adequate complementary feed<strong>in</strong>g, stunt<strong>in</strong>g rates at 12 months<br />
could be cut by 20 percent.70<br />
Vitam<strong>in</strong> A supplements – Roughly a third of all preschool-age children<br />
(190 million)71 and 15 percent of pregnant women (19 million)72 do not have<br />
enough vitam<strong>in</strong> A <strong>in</strong> <strong>the</strong>ir daily diet. Vitam<strong>in</strong> A deficiency is a contribut<strong>in</strong>g<br />
factor <strong>in</strong> <strong>the</strong> 1.3 million deaths each year from diarrhea among children and <strong>the</strong><br />
nearly 118,<strong>000</strong> deaths from measles.73 Severe deficiency can also cause irreversible<br />
corneal damage, lead<strong>in</strong>g to partial or total bl<strong>in</strong>dness. Vitam<strong>in</strong> A capsules<br />
given to children twice a year can prevent bl<strong>in</strong>dness and lower a child’s risk of<br />
death from common childhood diseases – at a cost of only 2 cents per capsule.74<br />
It is estimated that at least 2 percent of child deaths could be prevented if all<br />
children under age 5 received two doses of vitam<strong>in</strong> A each year.75<br />
Z<strong>in</strong>c for diarrhea – Diarrhea causes <strong>the</strong> death of 1.3 million children76 each<br />
year, most of <strong>the</strong>m between <strong>the</strong> ages of 6 months and 2 years.77 Young children<br />
are especially vulnerable because a smaller amount of fluid loss causes significant<br />
dehydration, because <strong>the</strong>y have fewer <strong>in</strong>ternal resources, and because<br />
<strong>the</strong>ir energy requirements are higher. <strong>Children</strong> <strong>in</strong> develop<strong>in</strong>g nations suffer an<br />
average of three cases of diarrhea a year.78 Diarrhea robs a child’s body of vital<br />
nutrients, caus<strong>in</strong>g malnutrition. Malnutrition, <strong>in</strong> turn, decreases <strong>the</strong> ability<br />
of <strong>the</strong> immune system to fight fur<strong>the</strong>r <strong>in</strong>fections, mak<strong>in</strong>g diarrheal episodes<br />
more frequent. Repeated bouts of diarrhea stunt children’s growth and keep<br />
<strong>the</strong>m out of school, which fur<strong>the</strong>r limits <strong>the</strong>ir chances for a successful future.
S av e t h e c h i l D r e N · S tat e o F t h e Wo r l D ’ S M ot h e r S 2 0 1 2 25<br />
we Can save 1.3 million Lives <strong>in</strong> <strong>the</strong>se 12 Countries<br />
UNDer-5 DeathS chilD StUNtiNg liveS <strong>Save</strong>D<br />
# (1,<strong>000</strong>s) rank country % # (1,<strong>000</strong>s) rank # (1,<strong>000</strong>s)<br />
1,696 1 <strong>in</strong>dia 48% 61,300 1 326<br />
861 2 Nigeria 41% 10,900 2 308<br />
465 3 Dr congo 43% 5,100 8 145<br />
423 4 pakistan 42% 8,900 3 100<br />
315 5 ch<strong>in</strong>a 9% 7,700 5 22<br />
271 6 ethiopia 44% 5,300 7 73<br />
191 7 afghanistan 59% 3,300 11 125<br />
151 8 <strong>in</strong>donesia 40% 8,700 4 36<br />
143 9 Sudan and South Sudan* 35% 2,200 16 31<br />
141 10 Uganda 39% 2,500 13 51<br />
140 11 Bangladesh 41% 6,100 6 22<br />
133 12 tanzania 43% 3,400 10 45<br />
—<br />
* Data are for <strong>the</strong> Sudan prior to <strong>the</strong> cession of <strong>the</strong> republic of South Sudan <strong>in</strong> July 2011.<br />
total lives saved: 1.3 million<br />
The annual estimated number of under-5 lives saved represents <strong>the</strong> potential comb<strong>in</strong>ed<br />
effect of scal<strong>in</strong>g up <strong>the</strong> follow<strong>in</strong>g “lifesav<strong>in</strong>g six” <strong>in</strong>terventions to universal coverage (set<br />
at 99%) by 2020: iron folate supplementation dur<strong>in</strong>g pregnancy, breastfeed<strong>in</strong>g (<strong>in</strong>clud<strong>in</strong>g<br />
exclusive breastfeed<strong>in</strong>g for <strong>the</strong> first six months and any breastfeed<strong>in</strong>g until 24 months),<br />
counsel<strong>in</strong>g on complementary feed<strong>in</strong>g, vitam<strong>in</strong> A supplementation, z<strong>in</strong>c for treatment of<br />
diarrhea and improved hygiene practices (i.e. access to safe dr<strong>in</strong>k<strong>in</strong>g water, use of improved<br />
sanitation facilities, safe disposal of children's stool, handwash<strong>in</strong>g with soap). In <strong>the</strong> few<br />
<strong>in</strong>stances where <strong>in</strong>tervention coverage data was miss<strong>in</strong>g, develop<strong>in</strong>g world averages were<br />
used. LiST analysis was done by <strong>Save</strong> <strong>the</strong> <strong>Children</strong>, with support from Johns Hopk<strong>in</strong>s<br />
University Bloomberg School of Public Health. Estimates for <strong>the</strong> number of stunted chil-<br />
dren <strong>in</strong> country were calculated by <strong>Save</strong> <strong>the</strong> <strong>Children</strong>.<br />
—<br />
Data sources: Mortality and under-5 population, UNiceF. The State of <strong>the</strong> World’s <strong>Children</strong> 2012. tables 1 and 6; Stunt<strong>in</strong>g, Who<br />
global Database on child growth and Malnutrition (usho.<strong>in</strong>t/nutgrowthb/.), UNiceF global Databases (child<strong>in</strong>fo.org) and<br />
recent DhS and MicS surveys (as of april 2012)<br />
When children with diarrhea are given z<strong>in</strong>c tablets along with oral rehydration<br />
solution, <strong>the</strong>y recover more quickly from diarrhea and <strong>the</strong>y are protected from<br />
recurrences.79 At 2 cents a tablet, a full lifesav<strong>in</strong>g course of z<strong>in</strong>c treatment for<br />
diarrhea costs less than 30 cents.80 It is estimated that 4 percent of child deaths<br />
could be prevented if all young children with diarrhea were treated with z<strong>in</strong>c.81<br />
Water, sanitation and hygiene – Poor access to safe water and sanitation<br />
services, coupled with poor hygiene practices, kills and sickens millions of<br />
children each year. Hand wash<strong>in</strong>g with soap is one of <strong>the</strong> most effective and<br />
<strong>in</strong>expensive ways to prevent diarrheal disease and pneumonia,82 which toge<strong>the</strong>r<br />
are responsible for approximately 2.9 million child deaths every year.83 It is<br />
estimated that 3 percent of child deaths could be prevented with access to<br />
safe dr<strong>in</strong>k<strong>in</strong>g water, improved sanitation facilities and good hygiene practices,<br />
especially hand wash<strong>in</strong>g.84<br />
Nigeria
26 SaviNg liveS aND BUilDiNg a Better FUtUre: loW-coSt SolUtioNS that WorK<br />
over half <strong>the</strong> world’s <strong>Children</strong> do not have access to <strong>the</strong> Lifesav<strong>in</strong>g six<br />
iron folate supplementation<br />
dur<strong>in</strong>g pregnancy<br />
Breastfeed<strong>in</strong>g ß<br />
complementary feed<strong>in</strong>g<br />
vitam<strong>in</strong> a supplementation<br />
Z<strong>in</strong>c for treatment of diarrhea<br />
Water, 1 sanitation 2 and hygiene 3<br />
3 2 1<br />
0% 20% 40% 60% 80% 100%<br />
■ average coverage level <strong>in</strong> develop<strong>in</strong>g countries<br />
■ opportunity to save lives with full scale-up<br />
ß <strong>in</strong>cludes exclusive for <strong>the</strong> first 6 months and any breastfeed<strong>in</strong>g 6-11 months<br />
+ Supplement<strong>in</strong>g neonates <strong>in</strong> asia could br<strong>in</strong>g it up to 7%<br />
estimated deaths prevented<br />
with universal coverage<br />
19% = 68,<strong>000</strong> (maternal)<br />
13% = 990,<strong>000</strong> (child)<br />
6% = 460,<strong>000</strong> (child)<br />
2% = 150,<strong>000</strong> + (child)<br />
4% = 300,<strong>000</strong> (child)<br />
3% = 230,<strong>000</strong> (child)<br />
The number of deaths that could be prevented with universal coverage of <strong>the</strong> “lifesav<strong>in</strong>g six” <strong>in</strong>terventions is calculated by apply<strong>in</strong>g Lancet<br />
estimates of <strong>in</strong>tervention effectiveness (Bhutta et al., 2008 for iron folate, all o<strong>the</strong>rs Jones et al., 2003) to 2010 child and 2008 maternal<br />
mortality. Coverage data are for <strong>the</strong> follow<strong>in</strong>g <strong>in</strong>dicators: % mo<strong>the</strong>rs who took iron dur<strong>in</strong>g pregnancy (90+ days); % children exclusively<br />
breastfed (first 6 months); % children (6-8 months) <strong>in</strong>troduced to soft, semi-soft or solid foods; % children (6-59 months) reached with two<br />
doses of vitam<strong>in</strong> A; % children (6-59 months) with diarrhea receiv<strong>in</strong>g z<strong>in</strong>c; % population with access to safe dr<strong>in</strong>k<strong>in</strong>g water (1); % popula-<br />
tion us<strong>in</strong>g improved sanitation facilities (2); % of mo<strong>the</strong>rs wash<strong>in</strong>g <strong>the</strong>ir hands with soap appropriately (i.e. after handl<strong>in</strong>g stool and before<br />
prepar<strong>in</strong>g food) (3).<br />
—<br />
Data sources: UNiceF. The State of <strong>the</strong> World’s <strong>Children</strong> 2012. (New york: 2012), table 2; Who/UNiceF Jo<strong>in</strong>t Monitor<strong>in</strong>g programme for Water Supply and Sanitation. Progress on Dr<strong>in</strong>k<strong>in</strong>g<br />
Water and Sanitation - 2012 Update. (UNiceF and Who: New york: 2012); Susan horton, Meera Shekar, christ<strong>in</strong>e McDonald, ajay Mahal and Jana Krystene Brooks, Scal<strong>in</strong>g Up <strong>Nutrition</strong>: What<br />
Will it Cost? (World Bank: Wash<strong>in</strong>gton Dc: 2010); recent DhS surveys and valerie curtis, lisa Danquah and robert aunger, “planned, Motivated and habitual hygiene Behaviour:<br />
an eleven country review,” Health Education Research 2009, 24(4):655-673.<br />
<strong>in</strong>Fant and toddLeR Feed<strong>in</strong>g sCoReCaRd<br />
<strong>Save</strong> <strong>the</strong> <strong>Children</strong> presents <strong>the</strong> Infant and Toddler Feed<strong>in</strong>g Scorecard show<strong>in</strong>g<br />
where young children have <strong>the</strong> best nutrition, and where <strong>the</strong>y have <strong>the</strong> worst.<br />
This analysis reveals that <strong>the</strong> develop<strong>in</strong>g world has a lot of room for improvement<br />
<strong>in</strong> early child feed<strong>in</strong>g. Only 4 countries out of 73 score “very good” overall<br />
on measures of young child nutrition. More than two-thirds perform <strong>in</strong> <strong>the</strong><br />
“fair” or “poor” category.<br />
The Scorecard analyzes <strong>the</strong> status of child nutrition <strong>in</strong> 73 priority countries<br />
where children are at <strong>the</strong> greatest risk of dy<strong>in</strong>g before <strong>the</strong>y reach <strong>the</strong> age of 5<br />
or where <strong>the</strong>y are dy<strong>in</strong>g <strong>in</strong> <strong>the</strong> greatest numbers. For each country, it measures<br />
<strong>the</strong> percentage of children who are:<br />
• Put to <strong>the</strong> breast with<strong>in</strong> one hour of birth<br />
• Exclusively breastfed for <strong>the</strong> first 6 months<br />
• Breastfed with complementary food from ages 6-9 months<br />
• Breastfed at age 2<br />
Countries are ranked us<strong>in</strong>g a scor<strong>in</strong>g system that assigns numeric values to<br />
very good, good, fair and poor levels of achievement on <strong>the</strong>se four <strong>in</strong>dicators.<br />
The performance thresholds are consistent with those established by <strong>the</strong> WHO<br />
and USAID’s L<strong>in</strong>kages Project <strong>in</strong> 2003.
S av e t h e c h i l D r e N · S tat e o F t h e Wo r l D ’ S M ot h e r S 2 0 1 2 27<br />
Key nutrition <strong>in</strong>terventions <strong>in</strong> <strong>the</strong> <strong>First</strong> 1,<strong>000</strong> days<br />
LiFeCyCLe stage<br />
Pregnancy ‡ newborn ‡ 0-6 months ‡ 6-24 months ‡<br />
Key diReCt nUtRition <strong>in</strong>teRVentions<br />
• iron folate or maternal<br />
supplementation of multiple<br />
micronutrients<br />
• calcium supplementation<br />
• iodized salt<br />
• <strong>in</strong>terventions to reduce<br />
<strong>in</strong>door air pollution and<br />
tobacco use<br />
• Deworm<strong>in</strong>g<br />
• <strong>in</strong>termittent preventive<br />
treatment for malaria<br />
• <strong>in</strong>secticide-treated bednets<br />
—<br />
* to date, beneficial effects have been shown <strong>in</strong><br />
asia only.<br />
‡ Food supplementation for pregnant women, lactat<strong>in</strong>g<br />
women and young children 6-24 months may be<br />
appropriate <strong>in</strong> food <strong>in</strong>secure sett<strong>in</strong>gs.<br />
• immediate and exclusive<br />
breastfeed<strong>in</strong>g<br />
• Delayed cord clamp<strong>in</strong>g<br />
• vitam<strong>in</strong> a supplementation*<br />
• exclusive breastfeed<strong>in</strong>g<br />
• hand wash<strong>in</strong>g or hygiene<br />
• conditional cash transfers<br />
(with nutrition education)<br />
• <strong>in</strong>secticide-treated bednets<br />
Malnutrition can be greatly reduced through <strong>the</strong> delivery of simple <strong>in</strong>terventions at key stages of <strong>the</strong> lifecycle – for <strong>the</strong> mo<strong>the</strong>r dur<strong>in</strong>g preg-<br />
nancy and while breastfeed<strong>in</strong>g; for <strong>the</strong> child, <strong>in</strong> <strong>in</strong>fancy and early childhood. If effectively scaled up, <strong>the</strong>se key <strong>in</strong>terventions will improve<br />
maternal and child nutrition and reduce <strong>the</strong> severity of childhood illness and under-5 mortality. Good nutrition is also important for chil-<br />
dren after <strong>the</strong> first 1,<strong>000</strong> days, and <strong>in</strong>terventions such as vitam<strong>in</strong> A supplementation, z<strong>in</strong>c treatment for diarrhea, and management of acute<br />
malnutrition are also critical for <strong>the</strong>se young children.<br />
—<br />
adapted from: Ma<strong>in</strong>stream<strong>in</strong>g <strong>Nutrition</strong> <strong>in</strong>itiative, 2006; Zulfiqar Bhutta, tahmeed ahmed, robert e. Black, Simon cousens, Kathryn Dewey, elsa giugliani, Batool haider, Betty Kirkwood, Saul<br />
Morris, hpS Sachdev and Meera Shekar, “What Works? <strong>in</strong>terventions for Maternal and child Undernutrition and Survival,” Lancet 2008 and horton, et al. Scal<strong>in</strong>g Up <strong>Nutrition</strong>: What Will it Cost?<br />
(World Bank: Wash<strong>in</strong>gton Dc: 2010)<br />
Complementary feed<strong>in</strong>g is <strong>the</strong> area where improvement is needed most.<br />
Countries score <strong>the</strong> most “poor” marks on this <strong>in</strong>dicator, <strong>in</strong>dicat<strong>in</strong>g widespread<br />
nutritional shortfalls dur<strong>in</strong>g <strong>the</strong> vulnerable period from 6 to 9 months of age.<br />
This is <strong>the</strong> time <strong>in</strong> many children’s lives when malnutrition is most likely to<br />
beg<strong>in</strong>, and when greater attention is clearly needed to prevent stunt<strong>in</strong>g.<br />
The Scorecard also looks at each country’s progress towards Millennium<br />
Development Goal 4 and at <strong>the</strong> degree to which countries have implemented<br />
<strong>the</strong> International Code of Market<strong>in</strong>g of Breast-milk Substitutes. MDG 4 challenges<br />
<strong>the</strong> world community to reduce child mortality by two-thirds by 2015.<br />
The market<strong>in</strong>g of breast-milk substitutes Code stipulates that <strong>the</strong>re should be<br />
no promotion of breast-milk substitutes, bottles and teats to <strong>the</strong> general public;<br />
that nei<strong>the</strong>r health facilities nor health professionals should have a role <strong>in</strong> promot<strong>in</strong>g<br />
breast-milk substitutes; and that free samples should not be provided<br />
to pregnant women, new mo<strong>the</strong>rs or families. These last two <strong>in</strong>dicators are<br />
presented to give a fuller picture of each country’s efforts to promote nutrition<br />
and save lives – <strong>the</strong>y were not <strong>in</strong>cluded <strong>in</strong> <strong>the</strong> calculations for country rank<strong>in</strong>gs.<br />
It is important to note that even <strong>in</strong> countries that have taken action to implement<br />
<strong>the</strong> Code, monitor<strong>in</strong>g and enforcement is often lack<strong>in</strong>g. Only effective<br />
• cont<strong>in</strong>ued breastfeed<strong>in</strong>g<br />
• complementary feed<strong>in</strong>g<br />
• preventive z<strong>in</strong>c<br />
supplementation<br />
• Z<strong>in</strong>c <strong>in</strong> management<br />
of diarrhea<br />
• vitam<strong>in</strong> a supplementation<br />
• iodized salt<br />
• Multiple micronutrient<br />
powders<br />
• hand wash<strong>in</strong>g or hygiene<br />
• treatment of severe acute<br />
malnutrition<br />
• Deworm<strong>in</strong>g<br />
• iron supplementation and<br />
fortification<br />
• conditional cash transfers<br />
(with nutrition education)<br />
• <strong>in</strong>secticide-treated bednets
28 SaviNg liveS aND BUilDiNg a Better FUtUre: loW-coSt SolUtioNS that WorK<br />
national laws that are properly enforced can stop baby food companies from<br />
compet<strong>in</strong>g with breastfeed<strong>in</strong>g. In fact, a recent WHO review of global nutrition<br />
policies found that only a third of <strong>the</strong> 96 countries reported to have enacted<br />
Code legislation also had effective monitor<strong>in</strong>g mechanisms <strong>in</strong> place.85<br />
The Top 4 countries on <strong>the</strong> Scorecard – Malawi, Madagascar, Peru and <strong>the</strong><br />
Solomon Islands – are also regional leaders <strong>in</strong> terms of child survival. Malawi<br />
and Madagascar have made more progress <strong>in</strong> reduc<strong>in</strong>g under-5 mortality than<br />
any o<strong>the</strong>r countries <strong>in</strong> sub-Saharan Africa. Peru has made <strong>the</strong> most progress<br />
of any country <strong>in</strong> Lat<strong>in</strong> America. And Solomon Islands has one of <strong>the</strong> lowest<br />
rates of child mortality <strong>in</strong> <strong>the</strong> East Asia and Pacific region. These countries have<br />
also made improvements <strong>in</strong> early <strong>in</strong>itiation of breastfeed<strong>in</strong>g and o<strong>the</strong>r feed<strong>in</strong>g<br />
practices <strong>in</strong> recent years.<br />
The Bottom 4 countries – Somalia, Côte d’Ivoire, Botswana and Equatorial<br />
Gu<strong>in</strong>ea – have made little to no progress <strong>in</strong> early feed<strong>in</strong>g or <strong>in</strong> sav<strong>in</strong>g children’s<br />
lives. Somalia, <strong>the</strong> lowest-ranked country on <strong>the</strong> Scorecard, has made no progress<br />
s<strong>in</strong>ce 1990 <strong>in</strong> reduc<strong>in</strong>g under-5 mortality, and <strong>in</strong> recent years <strong>the</strong> prevalence of<br />
underweight and stunted children <strong>in</strong> Somalia has risen by at least 10 percentage<br />
po<strong>in</strong>ts.86<br />
Top 4 Countries<br />
Malawi tops <strong>the</strong> Infant and Toddler Feed<strong>in</strong>g Scorecard rank<strong>in</strong>g, demonstrat<strong>in</strong>g<br />
impressive achievements <strong>in</strong> child nutrition. Overall, Malawi is do<strong>in</strong>g a<br />
very good job of feed<strong>in</strong>g young children accord<strong>in</strong>g to recommended standards,<br />
and this is sav<strong>in</strong>g many lives. With<strong>in</strong> an hour after birth, 95 percent of<br />
babies <strong>in</strong> Malawi are put to <strong>the</strong> breast. At 6 months, 71 percent are still be<strong>in</strong>g<br />
exclusively breastfed, and between 6-9 months, 87 percent are breastfed with<br />
complementary foods. At age 2, 77 percent of children are still gett<strong>in</strong>g some of<br />
<strong>the</strong>ir nutrition from breast milk. Malawi has enacted many provisions of <strong>the</strong><br />
International Code of Market<strong>in</strong>g of Breast-milk Substitutes <strong>in</strong>to law and has put<br />
significant energy and resources <strong>in</strong>to improv<strong>in</strong>g health services for its people.<br />
Many improvements can be attributed <strong>in</strong> part to <strong>the</strong> work of 10,<strong>000</strong> health<br />
surveillance assistants who are deployed <strong>in</strong> rural areas. These tra<strong>in</strong>ed, salaried<br />
frontl<strong>in</strong>e workers deliver preventative health care and counsel families about<br />
healthy behaviors such as hygiene, nutrition and breastfeed<strong>in</strong>g (see <strong>the</strong> story of<br />
one health worker on page 35). Malawi is an African success story, hav<strong>in</strong>g reduced<br />
its under-5 mortality rate by 59 percent s<strong>in</strong>ce 1990. It is one of a handful of sub-<br />
Saharan African countries that are on track to achieve MDG 4. While Malawi<br />
is to be applauded for its results <strong>in</strong> promot<strong>in</strong>g breastfeed<strong>in</strong>g and sav<strong>in</strong>g lives,<br />
<strong>the</strong> country still has one of <strong>the</strong> highest percentages of stunted children <strong>in</strong> <strong>the</strong><br />
world (48 percent). This paradox <strong>in</strong>dicates that additional efforts are needed to<br />
ensure children get good nutrition as <strong>the</strong>y are weaned off breast milk.<br />
Madagascar is ano<strong>the</strong>r African success story, on track to achieve MDG 4,<br />
with a 61 percent reduction <strong>in</strong> child mortality s<strong>in</strong>ce 1990. Strong performance<br />
on <strong>in</strong>fant and young child feed<strong>in</strong>g <strong>in</strong>dicators has contributed to Madagascar’s<br />
success <strong>in</strong> sav<strong>in</strong>g hundreds of thousands of lives.87 Madagascar’s M<strong>in</strong>istry of<br />
Health, <strong>in</strong> partnership with <strong>the</strong> AED/L<strong>in</strong>kages Project (funded by USAID),<br />
launched a major effort <strong>in</strong> 1999 to raise public awareness of <strong>the</strong> benefits of<br />
breastfeed<strong>in</strong>g. The campaign used <strong>in</strong>terpersonal communications, community<br />
mobilization events and local mass media to reach 6.3 million people<br />
with positive messages about breastfeed<strong>in</strong>g. S<strong>in</strong>ce <strong>the</strong> launch of <strong>the</strong> project,<br />
exclusive breastfeed<strong>in</strong>g rates have <strong>in</strong>creased from 41 to 51 percent and timely<br />
<strong>in</strong>itiation of breastfeed<strong>in</strong>g with<strong>in</strong> an hour of birth has risen from 34 to 72<br />
percent.88 Madagascar also does well on measures of complementary feed<strong>in</strong>g<br />
(89 percent) and breastfeed<strong>in</strong>g at age 2 (61 percent). Madagascar has enacted<br />
most provisions of <strong>the</strong> breast-milk substitutes Code <strong>in</strong>to law. As <strong>in</strong> Malawi,<br />
Malawi
S av e t h e c h i l D r e N · S tat e o F t h e Wo r l D ’ S M ot h e r S 2 0 1 2 29<br />
Madagascar’s children often falter as <strong>the</strong>y are transition<strong>in</strong>g from breast milk to<br />
solid foods: despite start<strong>in</strong>g life with healthy nutrition, an alarm<strong>in</strong>g 49 percent<br />
of Madagascar’s children under age 5 have stunted growth.<br />
Peru also does a very good job with early feed<strong>in</strong>g of its children: 51 percent<br />
of newborns are put to <strong>the</strong> breast with<strong>in</strong> an hour of birth; 68 percent are exclusively<br />
breastfed for 6 months; 84 percent are breastfed with complementary<br />
foods between 6-9 months; and an estimated 61 percent are still be<strong>in</strong>g breastfed<br />
around age 2. After years of almost no change <strong>in</strong> child chronic malnutrition<br />
rates, <strong>the</strong> Peruvian government launched Programa Integral de Nutrición<br />
(PIN) <strong>in</strong> 2006. PIN prioritized <strong>in</strong>terventions for children under age 3, pregnant<br />
women, lactat<strong>in</strong>g mo<strong>the</strong>rs and <strong>the</strong> poorest families who were at high risk for<br />
malnutrition.89 To <strong>in</strong>spire mo<strong>the</strong>rs to breastfeed more, <strong>the</strong> M<strong>in</strong>istry of Health<br />
sponsors events to promote breastfeed<strong>in</strong>g, such as an annual breastfeed<strong>in</strong>g<br />
contest where a prize is awarded for <strong>the</strong> baby who nurses <strong>the</strong> longest <strong>in</strong> one<br />
sitt<strong>in</strong>g.90 Government programs comb<strong>in</strong>ed with support<strong>in</strong>g efforts by NGOs<br />
and <strong>the</strong> donor community are credited with reduc<strong>in</strong>g Peru’s under-5 chronic<br />
malnutrition rate by about one quarter s<strong>in</strong>ce 2005,91 an impressive achievement.<br />
Peru has also cut its under-5 mortality rate by 76 percent s<strong>in</strong>ce 1990 so<br />
it has already achieved MDG 4. Still, 23 percent of Peru’s children are stunted,<br />
<strong>in</strong>dicat<strong>in</strong>g that more needs to be done to provide good nutrition to women<br />
while <strong>the</strong>y are pregnant and children as <strong>the</strong>y are transition<strong>in</strong>g from breast milk<br />
to solid foods.<br />
Solomon Islands is one of <strong>the</strong> least developed countries <strong>in</strong> <strong>the</strong> world, yet it<br />
performs very well on early nutrition <strong>in</strong>dicators, demonstrat<strong>in</strong>g that a strong<br />
policy environment and <strong>in</strong>dividual adoption of lifesav<strong>in</strong>g nutrition practices<br />
can matter more than national wealth when it comes to sav<strong>in</strong>g children’s lives.<br />
With<strong>in</strong> an hour after birth, 75 percent of babies <strong>in</strong> Solomon Islands are put<br />
to <strong>the</strong> breast. At 6 months, 74 percent are still be<strong>in</strong>g exclusively breastfed, and<br />
between 6-9 months, 81 percent are breastfed with complementary foods. At<br />
age 2, 67 percent of children are still gett<strong>in</strong>g some of <strong>the</strong>ir nutrition from breast<br />
milk. Solomon Islands has cut under-5 deaths by 40 percent s<strong>in</strong>ce 1990 and is<br />
on track to achieve MDG 4.<br />
Bottom 4 Countries<br />
Somalia scores last on <strong>the</strong> Infant and Toddler Feed<strong>in</strong>g Scorecard, demonstrat<strong>in</strong>g<br />
a widespread child nutrition crisis that often starts as soon as a child<br />
is born, if not before. Armed conflict, drought and food crises have placed<br />
enormous stresses on families <strong>in</strong> Somalia. Many women do not exclusively<br />
breastfeed, <strong>in</strong>stead giv<strong>in</strong>g <strong>the</strong>ir <strong>in</strong>fants camel’s milk, tea or water <strong>in</strong> addition<br />
to breast milk.92 Only 23 percent of Somali newborns are put to <strong>the</strong> breast<br />
peru
30 SaviNg liveS aND BUilDiNg a Better FUtUre: loW-coSt SolUtioNS that WorK<br />
with<strong>in</strong> an hour of birth; only 5 percent are exclusively breastfed for 6 months<br />
and 15 percent are breastfed with complementary foods between 6-9 months.<br />
At age 2, it is estimated that 27 percent of children are still gett<strong>in</strong>g some breast<br />
milk. Somalia has <strong>the</strong> lowest complementary feed<strong>in</strong>g rate and <strong>the</strong> highest child<br />
mortality rate <strong>in</strong> <strong>the</strong> world. Tragically, 1 child <strong>in</strong> 6 dies before reach<strong>in</strong>g age 5.93<br />
Years of political and economic <strong>in</strong>stability <strong>in</strong> Somalia have also contributed<br />
to severe <strong>in</strong>creases <strong>in</strong> stunt<strong>in</strong>g – up from 29 percent <strong>in</strong> 2<strong>000</strong> to 42 percent <strong>in</strong><br />
2006.94 Somalia has made no progress towards MDG 4.<br />
Côte d'Ivoire is ano<strong>the</strong>r country where conflict and <strong>in</strong>stability have created a<br />
dire situation for mo<strong>the</strong>rs and children. Only 25 percent of Ivorian newborns are<br />
put to <strong>the</strong> breast with<strong>in</strong> an hour of birth; only 4 percent are exclusively breastfed<br />
for 6 months; and 54 percent are breastfed with complementary foods between<br />
6-9 months. At age 2, it is estimated that 37 percent of children are still gett<strong>in</strong>g<br />
some breast milk. One child <strong>in</strong> 12 dies before reach<strong>in</strong>g age 195 and 39 percent<br />
of children are stunted. Côte d'Ivoire has made <strong>in</strong>sufficient progress towards<br />
MDG 4, and has taken little action on <strong>the</strong> International Code of Market<strong>in</strong>g of<br />
Breast-milk Substitutes.<br />
In Botswana, breastfeed<strong>in</strong>g was once widely practiced96 but today, only<br />
20 percent of <strong>in</strong>fants are exclusively breastfed. Botswana has been hard hit by<br />
AIDS, and many <strong>in</strong>fected mo<strong>the</strong>rs likely do not breastfeed for fear <strong>the</strong>y might<br />
pass along <strong>the</strong> disease to <strong>the</strong>ir babies. However, if given <strong>the</strong> right treatment with<br />
antiretrovirals (ARVs), HIV-positive mo<strong>the</strong>rs can safely breastfeed.97 And even<br />
without ARVs, <strong>in</strong> places where <strong>the</strong>re is little access to clean water, sanitation or<br />
health services, <strong>the</strong> risk that a child will die of diarrhea or ano<strong>the</strong>r childhood<br />
disease outweighs <strong>the</strong> risk of contract<strong>in</strong>g HIV through breast milk, at least<br />
dur<strong>in</strong>g <strong>the</strong> early months. Most HIV-positive mo<strong>the</strong>rs <strong>in</strong> develop<strong>in</strong>g countries<br />
are advised to exclusively breastfeed, but this message has met resistance <strong>in</strong><br />
Botswana. Poorly tra<strong>in</strong>ed health workers often do not encourage this recommended<br />
practice. And despite good efforts by <strong>the</strong> government to discourage<br />
formula feed<strong>in</strong>g by enact<strong>in</strong>g most of <strong>the</strong> Code <strong>in</strong>to law, <strong>the</strong> policies and programs<br />
to ensure that HIV-positive mo<strong>the</strong>rs are <strong>in</strong>formed about <strong>the</strong> risks and<br />
benefits of different <strong>in</strong>fant feed<strong>in</strong>g options – and are supported <strong>in</strong> carry<strong>in</strong>g out<br />
<strong>the</strong>ir <strong>in</strong>fant feed<strong>in</strong>g decisions – rema<strong>in</strong> <strong>in</strong>adequate.98 Largely as a result, only 20<br />
percent of Botswana’s newborns are put to <strong>the</strong> breast with<strong>in</strong> an hour of birth. At<br />
ages 6-9 months, 46 percent are breastfed with complementary foods and at age<br />
2, only 6 percent of children are gett<strong>in</strong>g any breast milk at all. Botswana’s <strong>in</strong>fant<br />
mortality rate is 36 per 1,<strong>000</strong> live births and 31 percent of children are stunted.<br />
Equatorial Gu<strong>in</strong>ea is <strong>the</strong> highest <strong>in</strong>come country <strong>in</strong> Africa, demonstrat<strong>in</strong>g<br />
that national wealth alone is not sufficient to prevent malnutrition. Only 24<br />
percent of babies <strong>in</strong> Equatorial Gu<strong>in</strong>ea are exclusively breastfed for 6 months<br />
and 48 percent are breastfed with complementary foods between 6-9 months.<br />
At age 2, it is estimated that just 10 percent of children are still gett<strong>in</strong>g some<br />
breast milk. Equatorial Gu<strong>in</strong>ea has made <strong>in</strong>sufficient progress towards MDG 4,<br />
and has taken no action on <strong>the</strong> International Code of Market<strong>in</strong>g of Breast-milk<br />
Substitutes. One child <strong>in</strong> 12 dies before reach<strong>in</strong>g age 199 and 35 percent of children<br />
have stunted growth.<br />
côte d’ivoire
<strong>in</strong>fant and toddler toddler Feed<strong>in</strong>g scorecard<br />
S av e t h e c h i l D r e N · S tat e o F t h e Wo r l D ’ S M ot h e r S 2 0 1 2 31<br />
<strong>in</strong>dicator rat<strong>in</strong>gs<br />
■ very good<br />
■ good<br />
■ Fair<br />
■ poor<br />
overall performance scores +<br />
≥ 9 very good<br />
7-8 good<br />
5-6 Fair<br />
3-4 poor<br />
+ aside from top performers,<br />
countries with three of <strong>the</strong> same<br />
put to <strong>the</strong> breast<br />
with<strong>in</strong> 1 hour of<br />
birth<br />
% oF ChiLdLRen (2<strong>000</strong>-2011) who aRe : eaRLy Feed<strong>in</strong>g sUmmaRy<br />
exclusively<br />
breastfed<br />
(first 6 months)<br />
rat<strong>in</strong>gs received <strong>the</strong> same overall<br />
performance score.<br />
– Data not available<br />
x Data differ from <strong>the</strong> standard<br />
def<strong>in</strong>ition<br />
y Data refer to only part of a country<br />
[z] Data are pre-2<strong>000</strong><br />
‡ Data are for <strong>the</strong> Sudan prior to<br />
<strong>the</strong> cession of <strong>the</strong> republic of South<br />
Sudan <strong>in</strong> July 2011.<br />
1 “on track” means that <strong>the</strong> under-5<br />
mortality rate (U5Mr) <strong>in</strong> 2010 is less<br />
than 40 deaths per 1,<strong>000</strong> live births<br />
(e.g. Dpr Korea, iraq, Kyrgyzstan,<br />
breastfed with breastfed at age 2<br />
complementary<br />
food (6-9 months)<br />
(20-23 months)<br />
philipp<strong>in</strong>es, Solomon islands) or<br />
that it is 40 or more with an average<br />
annual rate of reduction (aarr)<br />
of 4% or higher for 1990-2010;<br />
“<strong>in</strong>sufficient progress” <strong>in</strong>dicates<br />
a U5Mr ≥ 40 with an aarr of<br />
1%-3.9%; “no progress” <strong>in</strong>dicates<br />
a U5Mr ≥ 40 with an aarr < 1%.<br />
progress assessment by <strong>Save</strong> <strong>the</strong><br />
children. Sources: Methodology,<br />
countdown to 2015; aarr,<br />
UNiceF. State of <strong>the</strong> World’s <strong>Children</strong><br />
2012. table 10.<br />
2 this column summarizes <strong>the</strong> status<br />
of national measures with respect to<br />
Score rat<strong>in</strong>g progress<br />
towards MDg 4<br />
(2010) 1<br />
<strong>the</strong> International Code of Market<strong>in</strong>g of<br />
Breast-milk Substitutes. For category<br />
def<strong>in</strong>itions, please see research<br />
and Methodology Notes. Sources:<br />
iBFaN. SOC 2011; UNiceF. National<br />
Implementation of <strong>the</strong> International Code.<br />
April 2011.<br />
—<br />
Note: F<strong>in</strong>d<strong>in</strong>gs are reported for<br />
73 Countdown countries with latest<br />
available data from 2<strong>000</strong>-2011 for at<br />
least 3 out of <strong>the</strong>se 4 early feed<strong>in</strong>g<br />
<strong>in</strong>dicators. coverage rat<strong>in</strong>gs are<br />
based on performance thresholds<br />
established by <strong>the</strong> Who. For rat<strong>in</strong>g<br />
State of policy<br />
support for <strong>the</strong><br />
code 2<br />
Malawi 95 71 87 77 9.3 very good on track good<br />
Madagascar 72 51 89 61 9.0 very good on track very good<br />
peru 51 68 84 61z 9.0 very good on track very good<br />
Solomon islands 75 74 81 67 9.0 very good on track poor<br />
Bolivia, plur<strong>in</strong>ational State of 64 60 81 40 8.3 good on track good<br />
Burundi 74 69 74 79 8.3 good <strong>in</strong>sufficient poor<br />
cambodia 66 74 85 43 8.3 good on track good<br />
Myanmar 76 24 81 65 8.3 good <strong>in</strong>sufficient Fair<br />
rwanda 71 85 69 84 8.3 good <strong>in</strong>sufficient poor<br />
Zambia 57 61 93 42 8.3 good <strong>in</strong>sufficient good<br />
Papua New Gu<strong>in</strong>ea – 56 76 72 8.0 Good <strong>in</strong>sufficient good<br />
Bangladesh 43 64 69 90 7.8 good on track good<br />
Nepal 45 70 70 93 7.8 good on track very good<br />
egypt 56 53 66 35 7.5 good on track good<br />
eritrea 78 52 43 62 7.5 good on track poor<br />
ethiopia 52 52 51 82 7.5 good <strong>in</strong>sufficient good<br />
ghana 52 63 75 44 7.5 good <strong>in</strong>sufficient very good<br />
guatemala 56 50 71 46 7.5 good on track very good<br />
Kenya 58 32 83 54 7.5 good No progress Fair<br />
Mozambique 63 41 81 52 7.5 good <strong>in</strong>sufficient very good<br />
tanzania, United republic of 49 50 93 51 7.5 good <strong>in</strong>sufficient very good<br />
togo 53 63 44x 64 7.5 good <strong>in</strong>sufficient poor<br />
Uganda 42 60 80 54 7.5 good <strong>in</strong>sufficient very good<br />
Ben<strong>in</strong> 32 43 76 92 7.0 Fair <strong>in</strong>sufficient very good<br />
gu<strong>in</strong>ea-Bissau 55 38 41x 65 6.8 Fair <strong>in</strong>sufficient good<br />
haiti 44 41 87 35 6.8 Fair No progress poor<br />
lesotho 53 54 58 35 6.8 Fair No progress poor<br />
Mauritania 81 46 61 47 6.8 Fair No progress poor<br />
Niger 42 27 65 62 6.8 Fair <strong>in</strong>sufficient good<br />
Zimbabwe 65 31 83 20 6.8 Fair No progress very good<br />
angola 55 11 77 37 6.0 Fair <strong>in</strong>sufficient poor<br />
gambia 53 36 34x 31 6.0 Fair <strong>in</strong>sufficient very good<br />
gu<strong>in</strong>ea 35 48 32 71 6.0 Fair <strong>in</strong>sufficient good<br />
<strong>in</strong>dia 41 46 57 77 6.0 Fair <strong>in</strong>sufficient very good<br />
<strong>in</strong>donesia 44 32 75 50 6.0 Fair on track good<br />
lao people’s Democratic republic 30 26 70 48 6.0 Fair on track good<br />
Morocco 52 15 66 15 6.0 Fair on track Fair<br />
Nigeria 38 13 75 32 6.0 Fair <strong>in</strong>sufficient good<br />
philipp<strong>in</strong>es 54 34 58 34 6.0 Fair on track very good<br />
Sao tome and pr<strong>in</strong>cipe 45 51 73 20 6.0 Fair No progress poor<br />
Sierra leone 51 11 73 50 6.0 Fair <strong>in</strong>sufficient poor<br />
Swaziland 55 44 67x 11 6.0 Fair <strong>in</strong>sufficient Fair<br />
tajikistan 57z 25 15 34 6.0 Fair <strong>in</strong>sufficient good<br />
Uzbekistan 67 26 45 38 6.0 Fair <strong>in</strong>sufficient poor<br />
Yemen 30 12 76 [42] 6.0 Fair <strong>in</strong>sufficient very good<br />
Afghanistan 37y 43y 29 54 5.3 Fair <strong>in</strong>sufficient very good<br />
Brazil 43 40 70 25 5.3 Fair on track very good<br />
Burk<strong>in</strong>a Faso 20 25 52 80 5.3 Fair No progress good<br />
central african republic 39 23 55 47 5.3 Fair No progress poor<br />
congo 39 19 78 21 5.3 Fair <strong>in</strong>sufficient poor<br />
congo, Democratic republic of <strong>the</strong> 43 37 52x 53 5.3 Fair No progress good<br />
gabon 71 6 62 9 5.3 Fair <strong>in</strong>sufficient very good<br />
iraq 31 25 51 36 5.3 Fair on track poor<br />
Korea, Democratic people’s republic of 18 65 31 37 5.3 Fair on track poor<br />
Kyrgyzstan 65 32 49 26 5.3 Fair on track good<br />
liberia 44 34 51 41 5.3 Fair on track Fair<br />
Mali 43 34 30 56 5.3 Fair <strong>in</strong>sufficient good<br />
Senegal 23 39 71 51 5.3 Fair <strong>in</strong>sufficient good<br />
South africa 61 8 49 31 5.3 Fair No progress Fair<br />
turkmenistan 60 11 54 37 5.3 Fair <strong>in</strong>sufficient good<br />
Sudan and South Sudan‡ – 41 51x 40 5.0 Fair <strong>in</strong>sufficient poor<br />
azerbaijan 32 12 44 16 4.5 poor <strong>in</strong>sufficient good<br />
cameroon 20 20 76 24 4.5 poor No progress very good<br />
chad 34 3 36x 59 4.5 poor No progress poor<br />
ch<strong>in</strong>a 41 28 43 15 4.5 poor on track good<br />
comoros 25 21 34 45 4.5 poor <strong>in</strong>sufficient poor<br />
Djibouti 67 1 23 18 4.5 poor <strong>in</strong>sufficient good<br />
pakistan 29 37 36 55 4.5 poor <strong>in</strong>sufficient very good<br />
vietnam 40 17 50x 19 4.5 poor on track good<br />
Equatorial Gu<strong>in</strong>ea – 24 48 10 4.0 Poor <strong>in</strong>sufficient poor<br />
Botswana 20 20 46 6 3.8 poor <strong>in</strong>sufficient very good<br />
côte d’ivoire 25 4 54 37 3.8 poor <strong>in</strong>sufficient poor<br />
Somalia 23 5 15 27 3.0 poor No progress poor<br />
and scor<strong>in</strong>g methodology please see<br />
Methodology and research Notes.<br />
country scores and rat<strong>in</strong>gs <strong>in</strong> italics<br />
should be <strong>in</strong>terpreted with care<br />
as <strong>the</strong>y are based on <strong>in</strong>complete,<br />
outdated or sub-regional data.<br />
Data sources: Who global<br />
Databank on <strong>in</strong>fant and young child<br />
Feed<strong>in</strong>g (who.<strong>in</strong>t/nutrition/databases/<br />
<strong>in</strong>fantfeed<strong>in</strong>g/); UNiceF global<br />
Databases (child<strong>in</strong>fo.org); recent DhS,<br />
MicS and o<strong>the</strong>r national surveys<br />
(as of april 2012).
32 SaviNg liveS aND BUilDiNg a Better FUtUre: loW-coSt SolUtioNS that WorK<br />
to improve improve Child nutrition,<br />
educate girls<br />
The evidence is clear: When better-educated<br />
girls grow up and become mo<strong>the</strong>rs, <strong>the</strong>y<br />
tend to have fewer, healthier and better-<br />
nourished children. Educat<strong>in</strong>g girls is one<br />
of <strong>the</strong> most effective ways <strong>the</strong>re is to fight<br />
malnutrition and break <strong>the</strong> <strong>in</strong>tergenera-<br />
tional cycle of malnutrition.<br />
Studies <strong>the</strong> world over have l<strong>in</strong>ked<br />
maternal education with improved nutri-<br />
tion status of children. For example, a 2003<br />
analysis by <strong>the</strong> International Food Policy<br />
Research Institute estimated that improved<br />
female education was “responsible for<br />
almost 43 percent of <strong>the</strong> total reduction <strong>in</strong><br />
undernutrition across 63 countries between<br />
1971 and 1995.” 1995.”100 100<br />
Improvements <strong>in</strong> maternal educa-<br />
tion also lead to lower mortality rates <strong>in</strong><br />
children. UNESCO has estimated that<br />
each additional year of girls’ education can<br />
reduce child mortality by 9 percent and that<br />
universal secondary education could save<br />
1.8 million children's lives <strong>in</strong> sub-Saharan<br />
Africa alone. alone.101 101<br />
The “Copenhagen Consensus 2008” (a<br />
panel of eight dist<strong>in</strong>guished economists,<br />
<strong>in</strong>clud<strong>in</strong>g five Nobel Laureates) ranked<br />
<strong>in</strong>vestments <strong>in</strong> education, especially for<br />
girls, as provid<strong>in</strong>g some of <strong>the</strong> best returns<br />
of all development <strong>in</strong>terventions. Lower<strong>in</strong>g<br />
<strong>the</strong> price of school<strong>in</strong>g and <strong>in</strong>creas<strong>in</strong>g and<br />
improv<strong>in</strong>g girls’ education ranked 7th and<br />
8th out of <strong>the</strong>ir top 10 best <strong>in</strong>vestments <strong>in</strong><br />
development.<br />
development.102 102<br />
Despite <strong>the</strong> many benefits to <strong>in</strong>dividuals<br />
and society, far too many girls <strong>in</strong> develop<strong>in</strong>g<br />
countries are still deprived of an educa-<br />
tion. Worldwide, an estimated 36 million<br />
primary-school-aged girls are not enrolled<br />
<strong>in</strong> school. school.103 103<br />
heaLth woRKeRs aRe Key to sUCCess<br />
Frontl<strong>in</strong>e health workers have a vital role to play <strong>in</strong> ensur<strong>in</strong>g good nutrition<br />
<strong>in</strong> <strong>the</strong> first 1,<strong>000</strong> days. In impoverished communities <strong>in</strong> <strong>the</strong> develop<strong>in</strong>g world<br />
where malnutrition is most common, doctors and hospitals are often unavailable,<br />
too far away, or too expensive. Frontl<strong>in</strong>e health workers meet critical needs<br />
<strong>in</strong> <strong>the</strong>se communities by support<strong>in</strong>g and promot<strong>in</strong>g breastfeed<strong>in</strong>g, distribut<strong>in</strong>g<br />
vitam<strong>in</strong>s and o<strong>the</strong>r micronutrients, counsel<strong>in</strong>g mo<strong>the</strong>rs about balanced diet and<br />
improved complementary feed<strong>in</strong>g, promot<strong>in</strong>g hygiene and sanitation, screen<strong>in</strong>g<br />
children for malnutrition, and treat<strong>in</strong>g diarrhea and pneumonia.<br />
Frontl<strong>in</strong>e health workers deliver advice and services to families <strong>in</strong> <strong>the</strong>ir<br />
homes and <strong>in</strong> cl<strong>in</strong>ics, serv<strong>in</strong>g as counselors, educators and treatment providers.<br />
Because <strong>the</strong>y often come from <strong>the</strong> communities <strong>the</strong>y serve, community<br />
health workers and midwives understand <strong>the</strong> beliefs, practices and norms of <strong>the</strong><br />
people, allow<strong>in</strong>g <strong>the</strong>m to provide health care that is more culturally appropriate,<br />
and often highly effective.<br />
The “lifesav<strong>in</strong>g six” <strong>in</strong>terventions highlighted <strong>in</strong> this report can all be delivered<br />
<strong>in</strong> remote, impoverished places by well-tra<strong>in</strong>ed and well-equipped local<br />
health workers. In a number of countries, <strong>the</strong>se health workers have contributed<br />
to broad-scale success <strong>in</strong> fight<strong>in</strong>g malnutrition and sav<strong>in</strong>g lives. Some<br />
examples follow.<br />
• In Cambodia, exclusive breastfeed<strong>in</strong>g rates climbed dramatically from 11<br />
percent <strong>in</strong> 2<strong>000</strong> to 74 percent <strong>in</strong> 2010.104 Much of <strong>the</strong> credit goes to efforts<br />
such as <strong>the</strong> Baby-Friendly Community Initiative, which organized “Mo<strong>the</strong>r<br />
Support Groups” to provide education and <strong>in</strong>dividual counsel<strong>in</strong>g on <strong>in</strong>fant<br />
and young child feed<strong>in</strong>g. These volunteer-led groups have reached approximately<br />
517,<strong>000</strong> women <strong>in</strong> 2,675 villages, promot<strong>in</strong>g early and exclusive<br />
breastfeed<strong>in</strong>g, cont<strong>in</strong>ued nurs<strong>in</strong>g to 2 years or beyond, and appropriate<br />
complementary feed<strong>in</strong>g start<strong>in</strong>g at 6 months of age.105<br />
• Nepal has 50,<strong>000</strong> female community health volunteers, 97 percent of whom<br />
are <strong>in</strong> rural areas.106 These volunteers are chosen from and work for <strong>the</strong> community.<br />
They play an important role <strong>in</strong> contribut<strong>in</strong>g to a variety of public<br />
health programs, <strong>in</strong>clud<strong>in</strong>g family plann<strong>in</strong>g, maternal care, child health,<br />
vitam<strong>in</strong> A supplementation and immunization coverage.107 Anemia was a<br />
serious public health problem <strong>in</strong> Nepal for many years, but now <strong>the</strong> health<br />
volunteers have helped <strong>in</strong>crease iron folate supplementation to 81 percent<br />
(up from 23 percent <strong>in</strong> 2001).108 At <strong>the</strong> national level, <strong>the</strong> prevalence of<br />
anemia <strong>in</strong> women of reproductive age decreased from 68 percent <strong>in</strong> 1998<br />
to 35 percent <strong>in</strong> 2011.109 Through this and o<strong>the</strong>r efforts, Nepal succeeded<br />
<strong>in</strong> cutt<strong>in</strong>g its maternal mortality rate <strong>in</strong> half – from 539 deaths per 100,<strong>000</strong><br />
live births <strong>in</strong> 1996 to 281 <strong>in</strong> 2006.110<br />
• India’s Bihar State – one of <strong>the</strong> poorest <strong>in</strong> <strong>the</strong> nation – is at <strong>the</strong> forefront<br />
of <strong>the</strong> battle aga<strong>in</strong>st vitam<strong>in</strong> A deficiency, which afflicts up to 62 percent<br />
of preschool-aged children <strong>in</strong> rural India. The state set <strong>the</strong> ambitious goal<br />
of reach<strong>in</strong>g out to all children, beg<strong>in</strong>n<strong>in</strong>g with those traditionally excluded<br />
from services – children from <strong>the</strong> lower castes and m<strong>in</strong>ority groups – <strong>in</strong><br />
which malnutrition and mortality rates are often highest. More than 11,<strong>000</strong><br />
health centers and 80,<strong>000</strong> anganwadis, or child development centers, serve<br />
as core distribution sites for vitam<strong>in</strong> A supplements <strong>in</strong> Bihar. In addition,
S av e t h e c h i l D r e N · S tat e o F t h e Wo r l D ’ S M ot h e r S 2 0 1 2 33<br />
Nepal<br />
hira, 30, a mo<strong>the</strong>r <strong>in</strong> Nepal, saw how much of a difference it<br />
made when she breastfed her third child exclusively for <strong>the</strong><br />
first six months. Sandesh is much healthier than his two older<br />
bro<strong>the</strong>rs. Photo by Honey Malla<br />
<strong>the</strong>re’s noth<strong>in</strong>g Better than mo<strong>the</strong>r’s milk<br />
Like mo<strong>the</strong>rs everywhere, Hira has a lot of<br />
demands on her time and energy. She has<br />
three small boys to look after and her hus-<br />
band is away for months at a time work<strong>in</strong>g<br />
outside <strong>the</strong> country, so Hira has to manage<br />
on her own.<br />
Hira started breastfeed<strong>in</strong>g all three of<br />
her children as soon as <strong>the</strong>y were born, but<br />
she had difficulty cont<strong>in</strong>u<strong>in</strong>g with <strong>the</strong> first<br />
two. With her husband away, she had to<br />
tend to <strong>the</strong>ir small farm, so she couldn’t<br />
breastfeed as frequently as she wanted to.<br />
After about three months, she did not th<strong>in</strong>k<br />
she had enough of her own milk to feed<br />
<strong>the</strong> boys, so she started giv<strong>in</strong>g <strong>the</strong>m leeto (a<br />
porridge made of wheat and soy). Both boys<br />
suffered frequent ailments such as com-<br />
mon colds, coughs, fever, pneumonia and<br />
diarrhea.<br />
When Hira became pregnant with her<br />
third child, she started gett<strong>in</strong>g help from<br />
<strong>the</strong> female community health volunteer <strong>in</strong><br />
her village, a woman named Bhagawati,<br />
who was tra<strong>in</strong>ed by <strong>Save</strong> <strong>the</strong> <strong>Children</strong>.<br />
Bhagawati counseled Hira about improv<strong>in</strong>g<br />
her diet, and tak<strong>in</strong>g vitam<strong>in</strong>s and iron, so<br />
she could be stronger. She also expla<strong>in</strong>ed<br />
why it is important to breastfeed exclusively<br />
for <strong>the</strong> first six months of a child’s life, <strong>the</strong>n<br />
to start <strong>in</strong>troduc<strong>in</strong>g foods like leeto after six<br />
months. “I was not aware that <strong>the</strong> mo<strong>the</strong>r’s<br />
milk is so good for <strong>the</strong> child,” said Hira.<br />
“That it protects children from disease and<br />
<strong>in</strong>fection.”<br />
Hira’s third son, Sandesh, got noth<strong>in</strong>g<br />
but breast milk for his first six months.<br />
“Not even water,” Hira says proudly. “It is<br />
very easy to breastfeed. It doesn’t take any<br />
preparation time. It is hygienic, and I feed<br />
anytime <strong>the</strong> baby needs it. My two older<br />
sons could not digest <strong>the</strong> leeto so early.<br />
Sandesh is much healthier. He has only<br />
been sick once. I took him to be weighed<br />
last week – he is up to 16.5 pounds.”<br />
Hira started complementary feed<strong>in</strong>g<br />
Sandesh when he reached 6 months of age.<br />
“Right now, I breastfeed him first th<strong>in</strong>g <strong>in</strong><br />
<strong>the</strong> morn<strong>in</strong>g. I just started feed<strong>in</strong>g him leeto<br />
three times a day and he is able to digest it. I<br />
still breastfeed him at least six times a day.”<br />
Hira says she plans to cont<strong>in</strong>ue breastfeed-<br />
<strong>in</strong>g Sandesh for a few more years.
34 SaviNg liveS aND BUilDiNg a Better FUtUre: loW-coSt SolUtioNS that WorK<br />
more than 3,400 temporary sites were organized to deliver vitam<strong>in</strong> A with<strong>in</strong><br />
small, isolated communities. Frontl<strong>in</strong>e health and nutrition workers and<br />
community volunteers <strong>in</strong> <strong>the</strong> 38 districts of Bihar were tra<strong>in</strong>ed to adm<strong>in</strong>ister<br />
preventive vitam<strong>in</strong> A syrup to children and to counsel mo<strong>the</strong>rs on how<br />
to improve <strong>the</strong> vitam<strong>in</strong> A content of <strong>the</strong>ir children’s diet. In 2009, Bihar’s<br />
vitam<strong>in</strong> A supplementation program reached 13.4 million children under 5,<br />
protect<strong>in</strong>g 95 percent of children <strong>in</strong> this age group aga<strong>in</strong>st <strong>the</strong> devastat<strong>in</strong>g<br />
consequences of vitam<strong>in</strong> A deficiency.111 In 2010, national coverage for India<br />
as a whole was estimated at only 34 percent.112<br />
• Vietnam has a strong public health system at all levels that <strong>in</strong>cludes over<br />
100,<strong>000</strong> community health workers113 and a specific cadre called “nutrition<br />
collaborators” who staff cl<strong>in</strong>ics and do home visits. These health workers<br />
screen children for malnutrition, treat diarrhea and counsel mo<strong>the</strong>rs about<br />
breastfeed<strong>in</strong>g, balanced diet, hygiene and sanitation. With <strong>the</strong> help of <strong>the</strong>se<br />
health workers, Vietnam is mak<strong>in</strong>g promis<strong>in</strong>g progress toward <strong>the</strong> MDGs.<br />
By 2015 <strong>the</strong> country is almost certa<strong>in</strong> to reach MDGs 4 and 5 related to<br />
child and maternal mortality. S<strong>in</strong>ce 1990, Vietnam has cut child mortality<br />
by 55 percent114 and maternal mortality by 66 percent.115 Over <strong>the</strong> past<br />
two decades Vietnam has also cut child stunt<strong>in</strong>g by over 60 percent (from<br />
61 percent <strong>in</strong> 1989 to 23 percent <strong>in</strong> 2010)116 and s<strong>in</strong>ce 2005, <strong>the</strong> country has<br />
nearly elim<strong>in</strong>ated iod<strong>in</strong>e deficiency <strong>in</strong> pregnant women and children.117<br />
• In Mali, community health workers <strong>in</strong> one program helped ensure more<br />
than 90 percent of mo<strong>the</strong>rs took daily doses of iron-folic acid and multiple<br />
micronutrients.118 In nationwide efforts from 2002-2007, Mali’s government<br />
tra<strong>in</strong>ed 22,<strong>000</strong> community health workers on several nutrition-related<br />
<strong>in</strong>terventions to improve child survival. Each health worker was responsible<br />
for 35 households and was expected to visit each household monthly. The<br />
health workers delivered vitam<strong>in</strong> A to women and children under 5. They<br />
also discussed <strong>the</strong> benefits of exclusive breastfeed<strong>in</strong>g <strong>in</strong> <strong>the</strong> first 6 months of<br />
life and <strong>the</strong> risks of giv<strong>in</strong>g water <strong>in</strong>stead of breast milk.119 Program-specific<br />
results are not available, but national-level surveys have reported early <strong>in</strong>itiation<br />
of breastfeed<strong>in</strong>g <strong>in</strong>creased from 10 percent <strong>in</strong> 1995/96, to 43 percent <strong>in</strong><br />
2007. Exclusive breastfeed<strong>in</strong>g rose from 8 to 34 percent.120<br />
• In Mongolia, community health volunteers deliver multiple micronutrient<br />
powders – known as “Spr<strong>in</strong>kles” – that can improve vitam<strong>in</strong> and m<strong>in</strong>eral<br />
<strong>in</strong>take among children over 6 months old. The powders conta<strong>in</strong> up to 15<br />
vitam<strong>in</strong>s and m<strong>in</strong>erals (such as iron, and vitam<strong>in</strong>s A and D), are relatively<br />
tasteless, odorless, colorless, and are safe and easy to use. They cost about 3<br />
cents per sachet (one child typically gets 60 to 90 sachets per year). Mongolia<br />
is <strong>in</strong>troduc<strong>in</strong>g Spr<strong>in</strong>kles as part of an <strong>in</strong>tegrated approach to improve young<br />
child feed<strong>in</strong>g and reduce anemia and stunt<strong>in</strong>g. In 2001, when <strong>the</strong> country<br />
began distribut<strong>in</strong>g Spr<strong>in</strong>kles as part of a pilot program, around 42 percent of<br />
preschool-age children were anemic. Public health workers and community<br />
volunteers gave 30 sachets monthly to children. One year <strong>in</strong>to <strong>the</strong> program,<br />
13,<strong>000</strong> children, or more than 80 percent of those targeted, had received<br />
multi-micronutrient powders, and anemia was reduced to half of basel<strong>in</strong>e<br />
levels.121 Mongolia is currently scal<strong>in</strong>g-up <strong>the</strong> program nationally, aim<strong>in</strong>g<br />
to reach 49,480 children under age 2. Nurses, public health workers and<br />
community volunteers are distribut<strong>in</strong>g sachets at health posts.122<br />
vietnam
S av e t h e c h i l D r e N · S tat e o F t h e Wo r l D ’ S M ot h e r S 2 0 1 2 35<br />
Malawi<br />
Chisomo, <strong>the</strong> village heath worker, visited<br />
Mercy Benson and her children as often as<br />
he could because he noticed a lot of health<br />
problems <strong>in</strong> <strong>the</strong> household. The family<br />
couldn’t afford much food, <strong>the</strong>y were dr<strong>in</strong>k-<br />
<strong>in</strong>g unsafe water and cook<strong>in</strong>g <strong>in</strong> unsanitary<br />
conditions. Chisomo was especially worried<br />
about Anthony, <strong>the</strong> youngest child, who<br />
had been sick with malaria, diarrhea and<br />
o<strong>the</strong>r ailments.<br />
Anthony’s health problems <strong>in</strong>tensified<br />
when he was about a year old and Mercy<br />
stopped breastfeed<strong>in</strong>g him. Mercy was preg-<br />
nant aga<strong>in</strong>, and she mistakenly believed she<br />
shouldn’t breastfeed because it would take<br />
nutrition away from <strong>the</strong> baby <strong>in</strong> her womb.<br />
Anthony started gett<strong>in</strong>g diarrhea more<br />
frequently, and a few months later Chisomo<br />
discovered Anthony was malnourished,<br />
and gett<strong>in</strong>g worse.<br />
Chisomo treated Anthony’s diarrhea<br />
with oral rehydration solution and z<strong>in</strong>c.<br />
He expla<strong>in</strong>ed to Mercy that she should<br />
resume breastfeed<strong>in</strong>g, because it would help<br />
Anthony get better and it would not harm<br />
her pregnancy. “I advised Mercy to prepare<br />
chisomo Boxer exam<strong>in</strong>es anthony’s feet to check for edema.<br />
chisomo was tra<strong>in</strong>ed by <strong>Save</strong> <strong>the</strong> children to deliver primary<br />
health care <strong>in</strong> an isolated rural community <strong>in</strong> Malawi. anthony’s<br />
mo<strong>the</strong>r Mercy is grateful that she does not have to walk 14 miles<br />
across rugged, mounta<strong>in</strong>ous terra<strong>in</strong> to get to <strong>the</strong> nearest health<br />
facility when her children are sick. Photo by Amos Gumulira<br />
a Personal approach to Fight<strong>in</strong>g malnutrition<br />
food for Anthony and <strong>the</strong> rest of <strong>the</strong> family<br />
us<strong>in</strong>g multi-mix food pr<strong>in</strong>ciples. This means<br />
staple foods, legumes, fresh vegetables and<br />
oils should all be eaten as a s<strong>in</strong>gle meal,”<br />
said Chisomo. “I also taught her about<br />
hygienic food handl<strong>in</strong>g practices and envi-<br />
ronmental sanitation. Better refuse disposal<br />
would fix <strong>the</strong>ir condition once and for all. I<br />
dislike crude dump<strong>in</strong>g. It contributes to <strong>the</strong><br />
spread of diarrheal disease.”<br />
Chisomo checked <strong>in</strong> on <strong>the</strong> Bensons a<br />
few weeks later. “I noticed great improve-<br />
ments!” he said. “The family responded to<br />
my advice. They improved <strong>the</strong>ir hygiene to<br />
prevent diarrhea. Anthony no longer had<br />
edema due to malnutrition. And I was very<br />
pleased to see Mercy breastfeed<strong>in</strong>g dur<strong>in</strong>g<br />
my visit.”<br />
<strong>Save</strong> <strong>the</strong> <strong>Children</strong> staff visited Anthony<br />
<strong>in</strong> March 2012, and found him healthy,<br />
playful and laugh<strong>in</strong>g with his sisters and<br />
bro<strong>the</strong>rs. “Anthony is no longer malnour-<br />
ished,” said Chisomo. “He is fully recovered<br />
and he is even pick<strong>in</strong>g up weight.”
36 SaviNg liveS aND BUilDiNg a Better FUtUre: loW-coSt SolUtioNS that WorK<br />
• Brazil has more than 246,<strong>000</strong> community health agents serv<strong>in</strong>g 120 million<br />
people (63 percent of <strong>the</strong> population). The health agents make home visits<br />
where <strong>the</strong>y promote healthy practices such as breastfeed<strong>in</strong>g, monitor <strong>the</strong><br />
growth of children and counsel on follow up, and provide simple treatments<br />
such as oral rehydration solution for diarrhea. These health workers are<br />
residents of <strong>the</strong> communities <strong>the</strong>y serve and are selected <strong>in</strong> a public process<br />
with strong community engagement. The health worker program has been<br />
<strong>in</strong> place nationally s<strong>in</strong>ce <strong>the</strong> early 1990s.123 S<strong>in</strong>ce that time <strong>the</strong>re has been<br />
over a 90 percent decl<strong>in</strong>e <strong>in</strong> diarrhea-related mortality,124 and stunt<strong>in</strong>g has<br />
been reduced from 19 to 7 percent.125<br />
• Pakistan began tra<strong>in</strong><strong>in</strong>g and deploy<strong>in</strong>g “Lady Health Workers” <strong>in</strong> 1994.<br />
There are now more than 90,<strong>000</strong> female health workers throughout <strong>the</strong><br />
country, serv<strong>in</strong>g 70 percent of <strong>the</strong> rural population.126 Lady Health Workers<br />
focus largely on essential maternal and newborn care. Their tra<strong>in</strong><strong>in</strong>g emphasizes<br />
maternal nutrition, iron and folate use, rest dur<strong>in</strong>g pregnancy and<br />
promotion of breastfeed<strong>in</strong>g. Each<br />
Lady Health Worker looks after<br />
a population of about 1,<strong>000</strong> <strong>in</strong>dividuals.<br />
At group meet<strong>in</strong>gs, she will<br />
discuss issues related to better health,<br />
hygiene, nutrition, sanitation and<br />
family plann<strong>in</strong>g, emphasiz<strong>in</strong>g <strong>the</strong>ir<br />
benefits towards improved quality<br />
of life. In household visits, she<br />
will treat iron deficiency anemia <strong>in</strong><br />
women and young children, and<br />
provide nutritional education with<br />
emphasis on breastfeed<strong>in</strong>g and complementary<br />
feed<strong>in</strong>g practices, and<br />
maternal nutrition, <strong>in</strong>clud<strong>in</strong>g ways<br />
to reduce micronutrient malnutrition.127<br />
Pakistan still does poorly on<br />
breastfeed<strong>in</strong>g <strong>in</strong>dicators, but trends<br />
are mov<strong>in</strong>g <strong>in</strong> <strong>the</strong> right direction.<br />
Exclusive breastfeed<strong>in</strong>g rates <strong>in</strong>creased<br />
from 23 percent <strong>in</strong> 1990/91 to 37 percent<br />
<strong>in</strong> 2006/07. Dur<strong>in</strong>g that same<br />
period, rates of early <strong>in</strong>itiation rose<br />
three-fold, from 9 to 29 percent.128<br />
Over roughly <strong>the</strong> same period (1990-<br />
2008), maternal mortality dropped by<br />
nearly half.129<br />
Greater <strong>in</strong>vestments are needed to<br />
recruit, tra<strong>in</strong> and supervise/support<br />
more frontl<strong>in</strong>e health workers to build<br />
on <strong>the</strong>se successes. WHO estimates<br />
<strong>the</strong>re is a shortage of at least 1 million<br />
frontl<strong>in</strong>e health workers <strong>in</strong> <strong>the</strong><br />
develop<strong>in</strong>g world.130 And many exist<strong>in</strong>g<br />
health workers could do more to<br />
fight malnutrition if <strong>the</strong>y had better<br />
tra<strong>in</strong><strong>in</strong>g, equipment and support.131<br />
Brazil
S av e t h e c h i l D r e N · S tat e o F t h e Wo r l D ’ S M ot h e r S 2 0 1 2 37<br />
afghanistan<br />
Roshan Gul is <strong>the</strong> mo<strong>the</strong>r of five children<br />
and <strong>the</strong> wife of a day laborer who used to<br />
work <strong>in</strong> <strong>the</strong> fields of local farmers <strong>in</strong> north-<br />
ern Afghanistan. Then <strong>the</strong> drought started,<br />
and harvests failed three years <strong>in</strong> a row, so<br />
her husband couldn’t f<strong>in</strong>d work anymore.<br />
Sometimes her family doesn’t have food for<br />
days. If <strong>the</strong>re is food, it mostly consists of<br />
rice, bread and tea. Vegetables and meat are<br />
too expensive. Roshan Gul’s youngest child,<br />
Naweeda, became severely malnourished.<br />
She was 9 months old and weighed 9.9<br />
pounds when <strong>Save</strong> <strong>the</strong> <strong>Children</strong> community<br />
mobilizers weighed her for <strong>the</strong> first time <strong>in</strong><br />
January 2012.<br />
“When my baby Naweeda was born, she<br />
was round and healthy. She was pretty,” said<br />
Roshan Gul. “But <strong>the</strong>n she stopped grow-<br />
<strong>in</strong>g. Look: she cannot cry properly and she<br />
cannot move like o<strong>the</strong>r little babies.<br />
“I was very happy when <strong>the</strong> women<br />
[<strong>Save</strong> <strong>the</strong> <strong>Children</strong> community mobilizers]<br />
came to my house, weighed <strong>the</strong> baby and<br />
said <strong>the</strong>y would help me to feed her. Now I<br />
go to a neighbor’s house four times a week<br />
and we cook toge<strong>the</strong>r for <strong>the</strong> children.<br />
Everybody br<strong>in</strong>gs a child and a little bit of<br />
food from home – a tea glass full of rice, a<br />
carrot, a potato… We have teachers and we<br />
learn from <strong>the</strong>m what children must eat to<br />
“Naweeda is gett<strong>in</strong>g fatter day by day,” said roshan gul.<br />
“i am so happy.” Photo by Elissa Bogos<br />
Cop<strong>in</strong>g with Food Crisis <strong>in</strong> afghanistan<br />
become stronger. We cook rice with beans,<br />
eggs, carrots, turnips, potatoes and oil. We<br />
clean our hands before we start to cook so<br />
that <strong>the</strong> children don’t become sick. It is<br />
good to know that this helps to keep my<br />
children healthy.<br />
“In <strong>the</strong> beg<strong>in</strong>n<strong>in</strong>g Naweeda didn’t eat<br />
much, but her appetite is becom<strong>in</strong>g better<br />
and she is eat<strong>in</strong>g more now. Her face looks<br />
beautiful aga<strong>in</strong>, like when she was born.”<br />
When <strong>the</strong> doctor weighed Naweeda <strong>in</strong><br />
April 2012, she was up to 13.2 pounds. “He<br />
also measured my daughter’s upper arm,<br />
and it is fatter. It is at 11.3 centimeters,” said<br />
Roshan Gul. “They say it was 9.5 <strong>in</strong> <strong>the</strong><br />
beg<strong>in</strong>n<strong>in</strong>g. She wasn’t like a baby <strong>the</strong>n. She<br />
was like a bird so light. She is heavier <strong>in</strong> my<br />
arms now.<br />
“Naweeda is gett<strong>in</strong>g fatter day by day.<br />
I am so happy. We don’t sleep so much<br />
anymore, because she is often awake at<br />
night now. She wakes up and looks around<br />
and tells me th<strong>in</strong>gs, <strong>the</strong>n she sleeps, <strong>the</strong>n<br />
she wakes up aga<strong>in</strong>. She has more energy,<br />
more like a normal baby, but she still doesn’t<br />
want to play very much. I th<strong>in</strong>k she needs<br />
to eat more and recover. She is still too light<br />
for her age. The doctor says she must ga<strong>in</strong><br />
ano<strong>the</strong>r 4 pounds soon.”
Sweden<br />
38 chapter title goeS here
S av e t h e c h i l D r e N · S tat e o F t h e Wo r l D ’ S M ot h e r S 2 0 1 2 39<br />
BreaStFeeDiNg iN <strong>the</strong> iNDUStrialiZeD WorlD<br />
In developed countries, breastfeed<strong>in</strong>g usually is not critical to an <strong>in</strong>fant’s survival,<br />
as it often is <strong>in</strong> impoverished develop<strong>in</strong>g countries. Uncontam<strong>in</strong>ated,<br />
nutritious alternatives to breast milk are readily available <strong>in</strong> wealthier countries,<br />
and while malnutrition does exist, it is relatively uncommon. Still, breastfeed<strong>in</strong>g<br />
has many benefits for mo<strong>the</strong>rs and babies, and more can be done to support<br />
mo<strong>the</strong>rs who want to breastfeed.<br />
Accord<strong>in</strong>g <strong>the</strong> World Health Organization, exclusive breastfeed<strong>in</strong>g for <strong>the</strong><br />
first six months is best for babies everywhere.132 Babies who are fed formula and<br />
stop breastfeed<strong>in</strong>g early have higher risks of illness, obesity, allergies and sudden<br />
<strong>in</strong>fant death syndrome (SIDS).133 They tend to require more doctor visits,<br />
hospitalizations and prescriptions.134 Various studies also suggest breastfeed<strong>in</strong>g<br />
enhances a child’s cognitive development.135 While health professionals agree<br />
that human milk provides <strong>the</strong> most complete form of nutrition for <strong>in</strong>fants,<br />
<strong>the</strong>re are a few exceptions when breastfeed<strong>in</strong>g is not advised, such as when<br />
<strong>the</strong> mo<strong>the</strong>r is tak<strong>in</strong>g certa<strong>in</strong> drugs or is <strong>in</strong>fected with HIV or tuberculosis.136<br />
Mo<strong>the</strong>rs who breastfeed have lower risks of breast137 and ovarian138 cancers.<br />
Breastfeed<strong>in</strong>g delays <strong>the</strong> return to fertility and helps a mo<strong>the</strong>r lose <strong>the</strong> weight<br />
she ga<strong>in</strong>ed while pregnant. In <strong>the</strong> long term, breastfeed<strong>in</strong>g reduces <strong>the</strong> risk of<br />
type 2 diabetes.139 It also <strong>in</strong>creases <strong>the</strong> physical and emotional bond between<br />
a mo<strong>the</strong>r and her child.<br />
In all countries of <strong>the</strong> world, it is cheaper to breastfeed than to feed a baby<br />
formula or o<strong>the</strong>r milk. Breastfeed<strong>in</strong>g is also <strong>the</strong> most environment-friendly way<br />
to feed a baby. Breast milk does not require packag<strong>in</strong>g, storage, transportation<br />
or refrigeration. It generates no waste, is a renewable resource, and requires no<br />
energy to produce (except of course, <strong>the</strong> calories burned by <strong>the</strong> mo<strong>the</strong>r’s body).<br />
Op<strong>in</strong>ions vary on <strong>the</strong> benefits of breastfeed<strong>in</strong>g mixed with o<strong>the</strong>r foods <strong>in</strong><br />
<strong>the</strong> early months of a baby’s life. While some breast milk is seen as better than<br />
none, a number of recent studies have suggested that <strong>the</strong> immunity benefits<br />
for babies come only with exclusive breastfeed<strong>in</strong>g.140<br />
Despite <strong>the</strong>se many known benefits of breastfeed<strong>in</strong>g for mo<strong>the</strong>rs and <strong>the</strong>ir<br />
children, significant percentages of women <strong>in</strong> developed countries do not<br />
breastfeed optimally.<br />
In Belgium and <strong>the</strong> United K<strong>in</strong>gdom, only about 1 percent of children are<br />
exclusively breastfed for <strong>the</strong> first 6 months. In Australia, Canada, F<strong>in</strong>land, Italy,<br />
Norway, Sweden, <strong>the</strong> United States and several o<strong>the</strong>r countries, 15 percent or<br />
fewer of children have 6 months of exclusive breastfeed<strong>in</strong>g. Even <strong>the</strong> “best”<br />
countries <strong>in</strong> <strong>the</strong> <strong>in</strong>dustrialized world have exclusive breastfeed<strong>in</strong>g rates well<br />
below 50 percent.141<br />
Poor compliance with breastfeed<strong>in</strong>g recommendations costs <strong>the</strong> world economy<br />
billions of dollars each year. In <strong>the</strong> United States alone, it is estimated that<br />
low rates of breastfeed<strong>in</strong>g add $13 billion to medical costs and lead to 911 excess<br />
deaths every year.142 In <strong>the</strong> United K<strong>in</strong>gdom, it was estimated <strong>in</strong> 1995 that <strong>the</strong><br />
National Health Service spent £35 million per year <strong>in</strong> England and Wales treat<strong>in</strong>g<br />
gastroenteritis <strong>in</strong> formula-fed <strong>in</strong>fants and that, for every 1 percent <strong>in</strong>crease<br />
<strong>in</strong> breastfeed<strong>in</strong>g at 13 weeks, £500,<strong>000</strong> would be saved.143<br />
The reasons why women don’t breastfeed are varied and complex. In most<br />
developed countries, <strong>the</strong> majority of women report <strong>the</strong>y try to breastfeed, but<br />
<strong>the</strong>n at 3 months a significant percentage are not breastfeed<strong>in</strong>g exclusively, and<br />
at 6 months many have stopped nurs<strong>in</strong>g (see table on p.43). Mo<strong>the</strong>rs who want<br />
to breastfeed may become frustrated by physical challenges or <strong>the</strong> amount of<br />
<strong>the</strong> double Burden:<br />
hunger and obesity<br />
Childhood overweight and obesity are on<br />
<strong>the</strong> rise <strong>the</strong> world over. This is a grow<strong>in</strong>g<br />
problem <strong>in</strong> both rich and poor countries<br />
alike, with <strong>the</strong> poorest people <strong>in</strong> both<br />
affected most. People with lower <strong>in</strong>comes<br />
tend to consume more fat, meat and sugar,<br />
while those with higher <strong>in</strong>comes consume<br />
more fruit and vegetables. <strong>Children</strong> who are<br />
not breastfed are at higher risk of obesity.<br />
In addition, breastfeed<strong>in</strong>g for at least <strong>the</strong><br />
first six months of life appears to be a factor<br />
protect<strong>in</strong>g aga<strong>in</strong>st obesity. obesity.144 144<br />
In <strong>the</strong> United States, 10 percent of<br />
children under age 5 are overweight and an<br />
additional 10 percent of 2- to 5-year-olds<br />
are at risk of overweight. overweight.145 145 Among o<strong>the</strong>r<br />
developed countries with available data, <strong>the</strong><br />
highest levels of child overweight (around<br />
20 percent or more) are found <strong>in</strong> Albania,<br />
Bosnia and Herzegov<strong>in</strong>a, Georgia and<br />
Serbia. Serbia.146 146<br />
Some of <strong>the</strong>se countries also have large<br />
numbers or high percentages of stunted<br />
children. In <strong>the</strong> United States, for example,<br />
4 percent of young children are estimated to<br />
be stunted, which translates <strong>in</strong>to 840,<strong>000</strong><br />
stunted children. children.147 147 Stunt<strong>in</strong>g rates are over<br />
10 percent <strong>in</strong> Bosnia and Herzegov<strong>in</strong>a and<br />
Georgia. In Albania, <strong>the</strong> rate is over 20<br />
percent. percent.148 148<br />
Although be<strong>in</strong>g overweight is a problem<br />
most often associated with <strong>in</strong>dustrialized<br />
countries, obesity has been on <strong>the</strong> rise <strong>in</strong><br />
develop<strong>in</strong>g countries <strong>in</strong> recent years as<br />
well. This has lead to a “double burden” of<br />
malnutrition, where countries have high<br />
rates of both stunt<strong>in</strong>g and overweight. In<br />
Comoros, for example, 22 percent of young<br />
children are overweight, while around half<br />
are stunted. In Egypt, 21 percent of children<br />
under 5 are overweight while 31 percent are<br />
stunted. Libya has stunt<strong>in</strong>g and overweight<br />
rates above 20 percent. O<strong>the</strong>r countries<br />
with serious levels of both extremes of<br />
malnutrition <strong>in</strong>clude: Azerbaijan, Belize,<br />
Ben<strong>in</strong>, Botswana, Central African Republic,<br />
Djibouti, Indonesia, Iraq, Malawi,<br />
Mongolia, Morocco, Nigeria, Peru, Sierra<br />
Leone and Syria. Syria.149 149
40 BreaStFeeDiNg iN <strong>the</strong> iNDUStrialiZeD WorlD<br />
australia<br />
time required. They may lose confidence if <strong>the</strong>ir baby has difficulty latch<strong>in</strong>g<br />
and <strong>the</strong>re is not a lactation consultant or support group <strong>the</strong>y can turn to for<br />
advice. If she has a demand<strong>in</strong>g work schedule, or lack of support at home, a<br />
mo<strong>the</strong>r may be forced to stop breastfeed<strong>in</strong>g or start us<strong>in</strong>g formula sooner than<br />
she would like.<br />
Breastfeed<strong>in</strong>g practices tend to vary widely across race, ethnicity, education<br />
and <strong>in</strong>come levels. Often, disadvantaged mo<strong>the</strong>rs breastfeed less that <strong>the</strong>ir more<br />
privileged counterparts.<br />
In <strong>the</strong> United States, more than 80 percent of Hispanics and Asians beg<strong>in</strong><br />
breastfeed<strong>in</strong>g, but only 74 percent of whites and 54 percent of blacks do so.150<br />
Women with higher levels of education are more likely to breastfeed, but racial<br />
differences are apparent across education levels. For example, even among women<br />
with a college degree, blacks are less likely to breastfeed than whites.151 There<br />
are sharp geographical differences as well: <strong>in</strong> eight states, most <strong>in</strong> <strong>the</strong> Sou<strong>the</strong>ast,<br />
less than 10 percent of <strong>in</strong>fants are exclusively breastfed at 6 months.152<br />
Similar trends are found <strong>in</strong> Australia, where Aborig<strong>in</strong>al mo<strong>the</strong>rs are less<br />
likely to breastfeed than non-Aborig<strong>in</strong>al mo<strong>the</strong>rs. Poorer, less educated, women<br />
breastfeed less than women with post-school qualifications. And mo<strong>the</strong>rs over<br />
30 are twice as likely to be breastfeed<strong>in</strong>g <strong>the</strong>ir babies at 12 months of age (28<br />
percent) compared with mo<strong>the</strong>rs aged 18-29 years (14 percent).153<br />
In <strong>the</strong> United K<strong>in</strong>gdom, <strong>the</strong> highest <strong>in</strong>cidences of breastfeed<strong>in</strong>g are found<br />
among mo<strong>the</strong>rs from managerial and professional occupations, those with<br />
<strong>the</strong> highest education levels and those age 30 and older.154 South Asian and<br />
black mo<strong>the</strong>rs are more likely than white mo<strong>the</strong>rs to breastfeed <strong>in</strong>itially, and<br />
to cont<strong>in</strong>ue breastfeed<strong>in</strong>g through six months. However, among mo<strong>the</strong>rs who<br />
breastfeed exclusively at birth, <strong>the</strong> fall-off is greater among South Asian and<br />
black mo<strong>the</strong>rs than among white mo<strong>the</strong>rs. For example, 70 percent of white<br />
mo<strong>the</strong>rs who nursed exclusively at birth were still exclusive at one week, compared<br />
with 62 percent of South Asian and 52 percent of black mo<strong>the</strong>rs. At<br />
four months, 12 percent of white mo<strong>the</strong>rs were still exclusively breastfeed<strong>in</strong>g,<br />
compared with 7 percent of South Asians and 5 percent of blacks.155
S av e t h e c h i l D r e N · S tat e o F t h e Wo r l D ’ S M ot h e r S 2 0 1 2 41<br />
A recent study <strong>in</strong> <strong>the</strong> United States found that less than 2 percent of low<strong>in</strong>come<br />
mo<strong>the</strong>rs who planned to breastfeed were able to meet <strong>the</strong>ir goals, while<br />
50 percent of women from a more affluent population did. The low-<strong>in</strong>come<br />
women reported <strong>the</strong> obstacles <strong>the</strong>y encountered when breastfeed<strong>in</strong>g led <strong>the</strong>m<br />
to stop sooner than <strong>the</strong>y had planned. The study suggested better support is<br />
needed from medical professionals to help low-<strong>in</strong>come mo<strong>the</strong>rs succeed <strong>in</strong><br />
<strong>the</strong>ir breastfeed<strong>in</strong>g plans.156<br />
Experts agree that much of breastfeed<strong>in</strong>g success h<strong>in</strong>ges on gett<strong>in</strong>g off<br />
to a good start. The Baby-Friendly Hospital Initiative, launched <strong>in</strong> 1991 by<br />
UNICEF and <strong>the</strong> WHO, is an effort to ensure that more hospitals and maternity<br />
units provide breastfeed<strong>in</strong>g support. A maternity facility can be designated<br />
“baby-friendly” when it does not accept free or low-cost breast milk substitutes,<br />
feed<strong>in</strong>g bottles or teats, and has implemented 10 specific steps to support<br />
successful breastfeed<strong>in</strong>g. These steps <strong>in</strong>clude: tra<strong>in</strong><strong>in</strong>g staff to encourage and<br />
support breastfeed<strong>in</strong>g; <strong>in</strong>form<strong>in</strong>g all pregnant women about <strong>the</strong> benefits of<br />
breastfeed<strong>in</strong>g; help<strong>in</strong>g mo<strong>the</strong>rs to beg<strong>in</strong> nurs<strong>in</strong>g with<strong>in</strong> half an hour of birth;<br />
and establish<strong>in</strong>g breastfeed<strong>in</strong>g groups to support mo<strong>the</strong>rs after <strong>the</strong>y leave <strong>the</strong><br />
hospital.157 In many areas where hospitals have been designated Baby-Friendly,<br />
more mo<strong>the</strong>rs are breastfeed<strong>in</strong>g <strong>the</strong>ir <strong>in</strong>fants, and child health has improved.158<br />
The implementation of <strong>the</strong> Baby-Friendly Hospital Initiative has been difficult<br />
and slow <strong>in</strong> many countries. Three countries – Norway, Slovenia and<br />
Sweden – report very high percentages of births <strong>in</strong> baby-friendly hospitals.159<br />
Sweden is considered <strong>the</strong> global leader <strong>in</strong> terms of Baby-Friendly Hospital<br />
Initiative implementation: just four years after <strong>the</strong> program was <strong>in</strong>troduced <strong>in</strong><br />
1993, all of <strong>the</strong> <strong>the</strong>n 65 maternity centers <strong>in</strong> <strong>the</strong> country had been designated<br />
as “baby-friendly.”160 Today, Sweden rema<strong>in</strong>s <strong>the</strong> only <strong>in</strong>dustrialized country<br />
where all <strong>the</strong> hospitals are baby-friendly.<br />
Perhaps <strong>the</strong> most effective way to improve breastfeed<strong>in</strong>g rates is to provide<br />
longer periods of paid maternity leave. Countries with generous maternity and<br />
parental leave policies – such as Denmark, Norway and Sweden – tend to have<br />
high breastfeed<strong>in</strong>g rates. Public health researchers <strong>in</strong> <strong>the</strong> United States recently<br />
found that women whose maternity leave lasted longer than six weeks were<br />
more likely to <strong>in</strong>itiate breastfeed<strong>in</strong>g, cont<strong>in</strong>ue for more than six months and<br />
rely mostly on exclusive breastfeed<strong>in</strong>g beyond three months, compared with<br />
women who returned to work between one and six weeks after giv<strong>in</strong>g birth.161<br />
Apart from <strong>the</strong> United States, all developed countries now have laws mandat<strong>in</strong>g<br />
some form of paid compensation for women after giv<strong>in</strong>g birth. Depend<strong>in</strong>g<br />
on <strong>the</strong> country, maternity leave can range from 12 to 46 weeks, with pay from<br />
55 to 100 percent of regular salary.<br />
Many countries have also enacted laws giv<strong>in</strong>g work<strong>in</strong>g women <strong>the</strong> right<br />
to take nurs<strong>in</strong>g breaks while on <strong>the</strong> job. Although research has shown that<br />
return<strong>in</strong>g to work is associated with early discont<strong>in</strong>uation of breastfeed<strong>in</strong>g,<br />
a supportive work environment may make a difference <strong>in</strong> whe<strong>the</strong>r mo<strong>the</strong>rs<br />
are able to cont<strong>in</strong>ue to nurse. Under <strong>the</strong> best policies – <strong>in</strong> countries such as<br />
Germany, Poland and Portugal – women may take an hour or more of paid<br />
nurs<strong>in</strong>g breaks each day, for as long as <strong>the</strong>y need <strong>the</strong>m. Laws <strong>in</strong> France, Japan,<br />
New Zealand, Norway, Sweden, Switzerland and <strong>the</strong> United States give women<br />
<strong>the</strong> right to nurs<strong>in</strong>g breaks, but without guaranteed pay. In Australia, Canada,<br />
Denmark, F<strong>in</strong>land, Iceland and <strong>the</strong> United K<strong>in</strong>gdom, women do not have <strong>the</strong><br />
explicit right to nurs<strong>in</strong>g breaks, paid or unpaid.<br />
USa
42 BreaStFeeDiNg iN <strong>the</strong> iNDUStrialiZeD WorlD<br />
BReastFeed<strong>in</strong>g PoLiCy sCoReCaRd<br />
<strong>Save</strong> <strong>the</strong> <strong>Children</strong> exam<strong>in</strong>ed maternity leave laws, <strong>the</strong> right to nurs<strong>in</strong>g breaks<br />
at work and several o<strong>the</strong>r <strong>in</strong>dicators to create a rank<strong>in</strong>g of 36 <strong>in</strong>dustrialized<br />
countries measur<strong>in</strong>g which ones have <strong>the</strong> most – and <strong>the</strong> least – supportive<br />
policies for women who want to breastfeed.<br />
Norway tops <strong>the</strong> Breastfeed<strong>in</strong>g Policy Scorecard rank<strong>in</strong>g. Norwegian mo<strong>the</strong>rs<br />
enjoy one of <strong>the</strong> most generous parental leave policies <strong>in</strong> <strong>the</strong> developed world.<br />
After giv<strong>in</strong>g birth, mo<strong>the</strong>rs can take up to 36 weeks off work with 100 percent<br />
of <strong>the</strong>ir pay, or <strong>the</strong>y may opt for 46 weeks with 80 percent pay (or less if <strong>the</strong><br />
leave period is shared with <strong>the</strong> fa<strong>the</strong>r). In addition, Norwegian law provides<br />
for up to 12 months of additional child care leave, which can be taken by both<br />
fa<strong>the</strong>rs and mo<strong>the</strong>rs. When <strong>the</strong>y return to work, mo<strong>the</strong>rs have <strong>the</strong> right to<br />
nurs<strong>in</strong>g breaks as <strong>the</strong>y need <strong>the</strong>m. Nearly 80 percent of hospitals have been<br />
certified as “baby-friendly” and many provisions of <strong>the</strong> International Code of<br />
Market<strong>in</strong>g of Breast-milk Substitutes have been enacted <strong>in</strong>to law. Breastfeed<strong>in</strong>g<br />
practices <strong>in</strong> Norway reflect this supportive environment: 99 percent of babies<br />
<strong>the</strong>re are breastfed <strong>in</strong>itially and 70 percent are breastfed exclusively at 3 months.<br />
The United States ranks last on <strong>the</strong> Breastfeed<strong>in</strong>g Policy Scorecard. It is <strong>the</strong><br />
only economically advanced country – and one of just a handful of countries<br />
worldwide – where employers are not required to provide any paid maternity<br />
leave after a woman gives birth. There is also no paid parental leave required<br />
by U.S. law. Mo<strong>the</strong>rs may take breaks<br />
from work to nurse, but employers<br />
are not required to pay <strong>the</strong>m for this<br />
time. Only 2 percent of hospitals <strong>in</strong><br />
<strong>the</strong> United States have been certified<br />
as “baby-friendly” and none of <strong>the</strong><br />
provisions of <strong>the</strong> International Code<br />
of Market<strong>in</strong>g of Breast-milk Substitutes<br />
has been enacted <strong>in</strong>to law. While 75<br />
percent of American babies are <strong>in</strong>itially<br />
breastfed, only 35 percent are be<strong>in</strong>g<br />
breastfed exclusively at 3 months.<br />
Norway
S av e t h e c h i l D r e N · S tat e o F t h e Wo r l D ’ S M ot h e r S 2 0 1 2 43<br />
Breastfeed<strong>in</strong>g Policy scorecard for developed Countries Countries<br />
‐– No data<br />
(x) Unpaid period of leave<br />
† paid up to a ceil<strong>in</strong>g<br />
(4m) Data refer to exclusive<br />
breastfeed<strong>in</strong>g at 4 months<br />
BreaStFeeDiNg<br />
policy SUMMary<br />
1 <strong>in</strong> some countries, different<br />
sectors provide different lengths of<br />
leave. <strong>the</strong> m<strong>in</strong>imum standards for<br />
leave are <strong>in</strong>dicated here. <strong>in</strong> addition<br />
to maternity leave, most countries<br />
offer parental leave which is paid<br />
<strong>in</strong> part or full or <strong>in</strong> some cases<br />
not at all. country performance is<br />
scored and rated accord<strong>in</strong>g to <strong>the</strong><br />
full length of paid leave‐– <strong>in</strong>clud<strong>in</strong>g<br />
both maternity and parental leaves –<br />
available to mo<strong>the</strong>rs. For more<br />
on maternity leave policies, see<br />
country footnotes for tier i of <strong>the</strong><br />
Mo<strong>the</strong>rs’ Index. Detailed <strong>in</strong>formation<br />
on leave policies can be found<br />
at: leavenetwork.org/lp_and_r_<br />
reports/review_2011/<br />
2 <strong>the</strong>se countries do not provide<br />
maternity leave as such. Figures<br />
given are for <strong>the</strong> period of paid<br />
parental leave available to mo<strong>the</strong>rs.<br />
<strong>in</strong> many countries (e.g. Norway),<br />
fa<strong>the</strong>rs take little more than <strong>the</strong>ir<br />
quota, leav<strong>in</strong>g benefits for <strong>the</strong> most<br />
part to be taken by <strong>the</strong> mo<strong>the</strong>r.<br />
Score rat<strong>in</strong>g length<br />
(weeks)<br />
paiD MaterNity<br />
leave¹<br />
%<br />
Wages paid<br />
3 <strong>in</strong>dicates <strong>the</strong> child’s age when<br />
breastfeed<strong>in</strong>g breaks end. “No limit”<br />
means mo<strong>the</strong>rs can take breaks as<br />
long as <strong>the</strong>y cont<strong>in</strong>ue to breastfeed.<br />
* <strong>the</strong> ilo’s Maternity protection<br />
convention (No. 183) calls for paid<br />
breastfeed<strong>in</strong>g breaks. although <strong>the</strong>se<br />
countries guarantee <strong>the</strong> right to<br />
breastfeed at work, legislation does<br />
not explicitly provide for payment.<br />
<strong>in</strong> some countries, breaks are paid<br />
<strong>in</strong> certa<strong>in</strong> sectors (e.g. <strong>the</strong> public<br />
sector <strong>in</strong> Norway) and/or <strong>in</strong>dustries<br />
due to collective agreements <strong>in</strong> <strong>the</strong><br />
workplace (e.g. Japan).<br />
‡ Women are not entitled to<br />
breastfeed<strong>in</strong>g breaks by statutory<br />
law, although some workplaces may<br />
allow breaks.<br />
ß Figures are for all facilities (i.e. not<br />
just hospitals) provid<strong>in</strong>g maternal<br />
care. Data listed as “> x %” are<br />
sourced from Who graphics<br />
which were used to determ<strong>in</strong>e<br />
performance rat<strong>in</strong>gs; graphics did<br />
not allow for precise estimates.<br />
4 this column summarizes <strong>the</strong> status<br />
of national measures with respect to<br />
<strong>the</strong> International Code of Market<strong>in</strong>g of<br />
Breast-milk Substitutes. For category<br />
def<strong>in</strong>itions, see Methodology and<br />
research Notes.<br />
right to Daily<br />
NUrSiNg BreaKS<br />
y/N length of<br />
coverage<br />
(months) 3<br />
% hoSpitalS<br />
that are<br />
BaBy‐<br />
FrieNDly<br />
Note: F<strong>in</strong>d<strong>in</strong>gs are reported for<br />
36 <strong>in</strong>dustrialized (as identified by<br />
UNiceF) countries with available<br />
data. countries miss<strong>in</strong>g one, but<br />
not more than one, data po<strong>in</strong>t were<br />
<strong>in</strong>lcuded <strong>in</strong> <strong>the</strong> analysis. For rat<strong>in</strong>g<br />
and scor<strong>in</strong>g methodology please see<br />
Methodology and research Notes.<br />
to ensure comparability across<br />
countries, data were taken from a<br />
s<strong>in</strong>gle source where possible. Where<br />
sources differed, <strong>the</strong> most recent (<strong>in</strong><br />
<strong>the</strong> case of policy data) or <strong>the</strong> most<br />
reliable (<strong>in</strong> <strong>the</strong> case of breastfeed<strong>in</strong>g<br />
data) estimates were used.<br />
State oF<br />
policy<br />
SUpport<br />
For <strong>the</strong><br />
coDe 4<br />
ever<br />
breastfed<br />
%<br />
Sources: ilo Database on<br />
conditions of Work and<br />
employment laws; UNSD. Statistics<br />
and <strong>in</strong>dicators on women and men.<br />
table 5g. (Updated December 2011);<br />
<strong>in</strong>ternational Network on leave<br />
policies and research. International<br />
Review of Leave Policies and Related<br />
Research 2011. ed. peter Moss;<br />
WaBa. Status of Maternity Protection<br />
by Country. (Updated September<br />
2011); World legal rights Data<br />
centre: adult labour Database;<br />
ela<strong>in</strong>e cote, iBFaN-giFa, geneva,<br />
Switzerland; Who Department<br />
of <strong>Nutrition</strong> for health and<br />
Development. Data presented at <strong>the</strong><br />
2010 BFhi coord<strong>in</strong>ators meet<strong>in</strong>g.<br />
Florence, italy (unpublished);<br />
UNiceF BFhi 2006 records update;<br />
iBFaN. State of <strong>the</strong> Code by Country<br />
2011. (penang, Malaysia: 2011);<br />
adriano cattaneo, <strong>in</strong>stitute for<br />
Maternal and child health irccS<br />
Burlo garofolo, trieste, italy;<br />
Who global Data Bank on <strong>in</strong>fant<br />
and young child Feed<strong>in</strong>g (who.<strong>in</strong>t/<br />
nutrition/databases/<strong>in</strong>fantfeed<strong>in</strong>g/);<br />
oecD (2011), oecD Family<br />
Database, oecD, paris; and recent<br />
national <strong>in</strong>fant feed<strong>in</strong>g surveys.<br />
BreaStFeeDiNg<br />
practiceS<br />
<strong>in</strong>dicator rat<strong>in</strong>gs<br />
■ very good<br />
■ good<br />
■ Fair<br />
■ poor<br />
overall performance scores +<br />
≥ 9 very good<br />
7-8 good<br />
5-6 Fair<br />
exclusive at<br />
3 months<br />
%<br />
Norway 9.8 very good 36 or 462 100, 80% y* no limit 79% good 99 70 80<br />
Slovenia 9.6 very good 15 100% y no limit 79% good 97 —‐ —‐<br />
Sweden 9.6 very good 602 80% † y* no limit 100% good 98 60 (4 m) 72<br />
luxembourg 9.4 very good 16 100% y no limit >50% ß good 90 26 (4 m) 41<br />
austria 9.0 good 16 100% y no limit >15% ß good 93 60 55<br />
lithuania 9.0 good 18 100% y no limit >15% ß good 98 41 31<br />
latvia 8.8 good 16 100% y 18 47% good 92 63 46<br />
czech republic 8.6 good 28 60% y ≥12 55% good 96 —‐ 53<br />
Ne<strong>the</strong>rlands 8.6 good 16 100% † y 9 63% good 81 30 37<br />
germany 8.4 good 14 100% † y no limit 4% good 96 33 (4 m) 48<br />
estonia 8.2 good 20 100% y 18 0% ß good 82 —‐ 40<br />
poland 8.2 good 20 100% y no limit 15% good 71 31 —‐<br />
portugal 8.2 good 17 or 212 100, 80% y no limit 2% good 90 52 29<br />
France 8.0 good 16 100% † y* 12 1% good 65 —‐ —‐<br />
Belgium 7.8 good 15 82,75% † y 7 6% good 72 25 25<br />
ireland 7.8 good 26 (16) 80% † y 6.5 35% good 46 —‐ ‐—<br />
italy 7.8 good 20 80% y 12 2% good 91 47 47<br />
Switzerland 7.8 good 14 80% † y* 12 >50% ß Fair 92 —‐ 41<br />
New Zealand 7.6 good 142 100% † y* – >75% ß Fair 88 56 —‐<br />
cyprus 7.5 good 18 75% y 6 — good 79 52 —‐<br />
Denmark 7.4 good 18 100% † no right to breaks ‡ 39% good 98 48 —‐<br />
greece 7.4 good 17 100% y 12 0% good 86 —‐ —‐<br />
Slovak republic 7.4 good 28 55% y 12 29% good 92 57 (4 m) —‐<br />
Spa<strong>in</strong> 7.4 good 16 100% y 9 3% good 76 44 40<br />
United K<strong>in</strong>gdom 7.2 good 39 (13) 90% no right to breaks ‡ 17% good 81 13 25<br />
F<strong>in</strong>land 6.8 Fair 18 70+% no right to breaks ‡ 12% good 93 51 60<br />
israel 6.8 Fair 12 100% y 7.5 0% ß good —‐ —‐ —‐<br />
Japan 6.8 Fair 14 67% y* 12 6% ß Fair 97 38 —‐<br />
hungary 6.6 Fair 24 70% y 9 7% ß good 96 62 (4 m) —‐<br />
liechtenste<strong>in</strong> 6.2 Fair 20 80% y no limit 0% ß poor —‐ —‐ —‐<br />
canada 5.4 Fair 17 55% † no right to breaks ‡ 4% ß Fair 90 52 54<br />
iceland 5.4 Fair 132 80% no right to breaks ‡ 0% poor 98 48 (4 m) 65<br />
Monaco 5.4 Fair 16 90% y 12 0% ß poor —‐ —‐ —‐<br />
australia 4.8 poor 182 flat rate no right to breaks ‡ >15% ß Fair 96 39 60<br />
Malta 4.4 poor 14 100% no right to breaks ‡ 0% ß poor 62 ‐—‐ —‐<br />
United States 4.2 poor (12) unpaid y* 12 2% ß poor 75 35 44<br />
3-4 poor<br />
any at<br />
6 months<br />
%<br />
+ <strong>in</strong> order to receive a "very good"<br />
overall, countries had to have a<br />
rat<strong>in</strong>g of "good" or better across all<br />
<strong>in</strong>dicators.
Niger<br />
44 chapter title goeS here
S av e t h e c h i l D r e N · S tat e o F t h e Wo r l D ’ S M ot h e r S 2 0 1 2 45<br />
taKe actioN NoW to eNSUre every chilD getS <strong>the</strong><br />
NUtritioN <strong>the</strong>y NeeD For <strong>the</strong> right Start iN liFe<br />
<strong>Children</strong> who get <strong>the</strong> right nutrition <strong>in</strong> <strong>the</strong>ir first 1,<strong>000</strong><br />
days – from pregnancy to age 2 – have a foundation that<br />
lasts <strong>the</strong>ir entire lives. Their bodies and bra<strong>in</strong>s develop,<br />
<strong>the</strong>y do better <strong>in</strong> school, and <strong>the</strong>y even have higher lifelong<br />
earn<strong>in</strong>gs.<br />
For children who don’t get this adequate <strong>in</strong>vestment,<br />
<strong>the</strong> opposite is true; <strong>the</strong> impacts are often irreversible. Even<br />
worse, malnutrition is an underly<strong>in</strong>g cause of more than a<br />
third of child deaths before <strong>the</strong> age of 5.<br />
Every child deserves a fair start <strong>in</strong> life. Gett<strong>in</strong>g children<br />
<strong>the</strong> right nutrition – especially <strong>in</strong> this 1,<strong>000</strong> day w<strong>in</strong>dow<br />
– pays for itself and is one of <strong>the</strong> most cost-effective development<br />
<strong>in</strong>terventions.<br />
All Countries:<br />
• Malnutrition impacts both wealthy and develop<strong>in</strong>g<br />
countries <strong>in</strong> serious ways. All governments must make<br />
fight<strong>in</strong>g malnutrition and stunt<strong>in</strong>g a priority, sett<strong>in</strong>g<br />
targets for progress <strong>in</strong> <strong>the</strong>ir own countries and around<br />
<strong>the</strong> world. Toge<strong>the</strong>r, countries should set and monitor a<br />
global target for reduc<strong>in</strong>g stunt<strong>in</strong>g as a key way to accelerate<br />
<strong>in</strong>vestment and accountability for malnutrition.<br />
• Countries should endorse and support <strong>the</strong> Scal<strong>in</strong>g<br />
Up <strong>Nutrition</strong> (SUN) movement, which provides a<br />
framework for donor and develop<strong>in</strong>g countries, multilateral<br />
agencies and NGOs to work toge<strong>the</strong>r to advance<br />
nutrition.<br />
• Leaders attend<strong>in</strong>g <strong>the</strong> Call to Action forum, A Promise<br />
to Keep: End<strong>in</strong>g Preventable Child Deaths <strong>in</strong> Wash<strong>in</strong>gton<br />
<strong>in</strong> June should commit to end<strong>in</strong>g preventable child<br />
deaths and focus<strong>in</strong>g on nutrition as an underly<strong>in</strong>g cause<br />
of a third of child deaths.<br />
• Governments, donors and <strong>in</strong>ternational agencies should<br />
prioritize <strong>in</strong>vest<strong>in</strong>g <strong>in</strong> frontl<strong>in</strong>e health workers and girls’<br />
education. Both of <strong>the</strong>se are essential to break<strong>in</strong>g <strong>the</strong><br />
cycle of malnutrition.<br />
Develop<strong>in</strong>g Countries:<br />
• Develop<strong>in</strong>g country governments must commit and<br />
fund national nutrition plans of action that are <strong>in</strong>tegrated<br />
with plans for maternal and child health. Aga<strong>in</strong>,<br />
<strong>the</strong> SUN movement provides a framework for develop<strong>in</strong>g<br />
country leadership.<br />
• African governments must <strong>in</strong>vest <strong>in</strong> health by meet<strong>in</strong>g<br />
<strong>the</strong> Abuja target set <strong>in</strong> 2001 to devote at least 15<br />
percent of government spend<strong>in</strong>g to <strong>the</strong> health sector.<br />
This must <strong>in</strong>clude resources for <strong>the</strong> implementation<br />
of a national action plan for nutrition which is supported<br />
by accountable leadership and good stewardship<br />
of resources.<br />
Donor Countries:<br />
• With global economic turmoil, many <strong>in</strong>ternational<br />
assistance budgets are under pressure. However, most<br />
countries spend less than 1 percent of <strong>the</strong>ir GDP on<br />
<strong>in</strong>ternational assistance. Citizens <strong>in</strong> developed countries<br />
need to tell <strong>the</strong>ir governments to cont<strong>in</strong>ue to <strong>in</strong>vest <strong>in</strong><br />
global health and development – <strong>in</strong>clud<strong>in</strong>g nutrition.<br />
• Donor countries and <strong>in</strong>ternational agencies must keep<br />
<strong>the</strong>ir fund<strong>in</strong>g commitments to achiev<strong>in</strong>g MDGs 1, 4<br />
and 5. They should endorse <strong>the</strong> SUN movement and<br />
support country plans to reduce malnutrition.<br />
• Nations participat<strong>in</strong>g <strong>in</strong> <strong>the</strong> G-8 Summit <strong>in</strong> May 2012<br />
at Camp David <strong>in</strong> <strong>the</strong> United States must set a global<br />
target for prevent<strong>in</strong>g stunt<strong>in</strong>g and, at a m<strong>in</strong>imum, cont<strong>in</strong>ue<br />
support for food security at levels agreed to under<br />
<strong>the</strong> L’Aquila Food Security Initiative.<br />
• Nations attend<strong>in</strong>g <strong>the</strong> G20 <strong>in</strong> Mexico <strong>in</strong> June must<br />
endorse <strong>the</strong> SUN movement, direct <strong>the</strong>ir Agriculture<br />
M<strong>in</strong>isters to identify policies and practices that maximize<br />
<strong>the</strong> impact on nutrition; and support low-<strong>in</strong>come<br />
countries to establish, develop and f<strong>in</strong>ance social protection<br />
systems that can be scaled up to protect poor and<br />
vulnerable populations.<br />
Individuals:<br />
• Citizens everywhere should urge <strong>the</strong>ir governments –<br />
national governments and donors alike – to <strong>in</strong>vest <strong>in</strong><br />
nutrition for mo<strong>the</strong>rs and all children, especially <strong>in</strong> <strong>the</strong><br />
first 1,<strong>000</strong> days, and live up to <strong>the</strong> commitments made<br />
to achieve Millennium Development Goals 1, 4 and 5.<br />
• Jo<strong>in</strong> <strong>Save</strong> <strong>the</strong> <strong>Children</strong>’s newborn and child survival<br />
campaign. Visit www.save<strong>the</strong>children.net to f<strong>in</strong>d <strong>the</strong><br />
campaign <strong>in</strong> your country, take action to let your leaders<br />
know that preventable child deaths and malnutrition<br />
are unacceptable, and jo<strong>in</strong> our movement.
Norway<br />
46 chapter title goeS here
S av e t h e c h i l D r e N · S tat e o F t h e Wo r l D ’ S M ot h e r S 2 0 1 2 47<br />
appeNDix: <strong>the</strong> Mo<strong>the</strong>rS’ iNDex<br />
aND coUNtry raNKiNgS<br />
The thirteenth annual Mo<strong>the</strong>rs’ Index helps document conditions for mo<strong>the</strong>rs<br />
and children <strong>in</strong> 165 countries – 43 developed nations162 and 122 <strong>in</strong> <strong>the</strong><br />
develop<strong>in</strong>g world – and shows where mo<strong>the</strong>rs fare best and where <strong>the</strong>y face<br />
<strong>the</strong> greatest hardships. All countries for which sufficient data are available are<br />
<strong>in</strong>cluded <strong>in</strong> <strong>the</strong> Index.<br />
Why should <strong>Save</strong> <strong>the</strong> <strong>Children</strong> be so concerned with mo<strong>the</strong>rs? Because<br />
more than 90 years of field experience have taught us that <strong>the</strong> quality of children’s<br />
lives depends on <strong>the</strong> health, security and well-be<strong>in</strong>g of <strong>the</strong>ir mo<strong>the</strong>rs. In<br />
short, provid<strong>in</strong>g mo<strong>the</strong>rs with access to education, economic opportunities and<br />
maternal and child health care, gives <strong>the</strong>m and <strong>the</strong>ir children <strong>the</strong> best chance<br />
to survive and thrive.<br />
The Index relies on <strong>in</strong>formation published by governments, research <strong>in</strong>stitutions<br />
and <strong>in</strong>ternational agencies. The Complete Mo<strong>the</strong>rs’ Index, based on a<br />
composite of separate <strong>in</strong>dices for women’s and children’s well-be<strong>in</strong>g, appears <strong>in</strong><br />
<strong>the</strong> fold-out table <strong>in</strong> this appendix. A full description of <strong>the</strong> research methodology<br />
and <strong>in</strong>dividual <strong>in</strong>dicators appears after <strong>the</strong> fold-out.<br />
Mo<strong>the</strong>rs’ Index Rank<strong>in</strong>gs<br />
European countries – along with Australia and New Zealand – dom<strong>in</strong>ate<br />
<strong>the</strong> top positions while countries <strong>in</strong> sub-Saharan Africa dom<strong>in</strong>ate <strong>the</strong> lowest<br />
tier. The United States places 25th this year.<br />
Most <strong>in</strong>dustrialized countries cluster tightly at <strong>the</strong> top of <strong>the</strong> Index – with<br />
<strong>the</strong> majority of <strong>the</strong>se countries perform<strong>in</strong>g well on all <strong>in</strong>dicators – <strong>the</strong> highest<br />
rank<strong>in</strong>g countries atta<strong>in</strong> very high scores for mo<strong>the</strong>rs’ and children’s health,<br />
educational and economic status.<br />
The 10 bottom-ranked countries <strong>in</strong> this year’s Mo<strong>the</strong>rs’ Index are a reverse<br />
image of <strong>the</strong> top 10, perform<strong>in</strong>g poorly on all <strong>in</strong>dicators. Conditions for mo<strong>the</strong>rs<br />
and <strong>the</strong>ir children <strong>in</strong> <strong>the</strong>se countries are devastat<strong>in</strong>g.<br />
2012 mo<strong>the</strong>rs’ <strong>in</strong>dex Rank<strong>in</strong>gs<br />
top 10 – Best places to be a mo<strong>the</strong>r Bottom 10 – worst places to be a mo<strong>the</strong>r<br />
raNK coUNtry raNK coUNtry<br />
1 Norway 156 Dr congo<br />
2 iceland 156 South Sudan<br />
3 Sweden 156 Sudan<br />
4 New Zealand 159 chad<br />
5 Denmark 160 eritrea<br />
6 F<strong>in</strong>land 161 Mali<br />
7 australia 162 gu<strong>in</strong>ea-Bissau<br />
8 Belgium 163 yemen<br />
9 ireland 164 afghanistan<br />
10 Ne<strong>the</strong>rlands / United K<strong>in</strong>gdom 165 Niger<br />
Niger
48 appeNDix: <strong>the</strong> Mo<strong>the</strong>rS’ iNDex aND coUNtry raNKiNgS<br />
what <strong>the</strong> numbers don’t<br />
tell you<br />
The national-level data presented <strong>in</strong> <strong>the</strong><br />
Mo<strong>the</strong>rs’ Index provide an overview of many<br />
countries. However, it is important to<br />
remember that <strong>the</strong> condition of geographic<br />
or ethnic sub-groups <strong>in</strong> a country may vary<br />
greatly from <strong>the</strong> national average. Remote<br />
rural areas tend to have fewer services and<br />
more dire statistics. War, violence and law-<br />
lessness also do great harm to <strong>the</strong> well-be<strong>in</strong>g<br />
of mo<strong>the</strong>rs and children, and often affect<br />
certa<strong>in</strong> segments of <strong>the</strong> population dispro-<br />
portionately. These details are hidden when<br />
only broad national-level data are available.<br />
• Over half of all births are not attended by skilled health personnel.<br />
• On average, 1 <strong>in</strong> 30 women will die from pregnancy-related causes.<br />
• 1 child <strong>in</strong> 7 dies before his or her fifth birthday.<br />
• Nearly a third of all children suffer from malnutrition.<br />
• 1 child <strong>in</strong> 6 is not enrolled <strong>in</strong> primary school.<br />
• Fewer than 4 girls are enrolled <strong>in</strong> primary school for every 5 boys.<br />
• On average, females receive about 6 years of formal education.<br />
• Women earn less than 40 percent of what men do.<br />
• 8 out of 10 women are likely to suffer <strong>the</strong> loss of a child <strong>in</strong> <strong>the</strong>ir lifetime.<br />
The contrast between <strong>the</strong> top-ranked country, Norway, and <strong>the</strong> lowestranked<br />
country, Niger, is strik<strong>in</strong>g. Skilled health personnel are present at<br />
virtually every birth <strong>in</strong> Norway, while only 1 <strong>in</strong> 3 births are attended <strong>in</strong> Niger.<br />
In Norway, nearly 40 percent of parliamentary seats are held by women; <strong>in</strong><br />
Niger only 13 percent are. A typical Norwegian girl can expect to receive 18 years<br />
of formal education and will live to be over 83 years old. Eighty-two percent of<br />
women are us<strong>in</strong>g some modern method of contraception, and only 1 mo<strong>the</strong>r <strong>in</strong><br />
175 is likely to lose a child before his or her fifth birthday. At <strong>the</strong> opposite end<br />
of <strong>the</strong> spectrum, <strong>in</strong> Niger, a typical girl receives only 4 years of education and<br />
lives to only 56. Only 5 percent of women are us<strong>in</strong>g modern contraception, and<br />
1 child <strong>in</strong> 7 dies before his or her fifth birthday. This means that every mo<strong>the</strong>r<br />
<strong>in</strong> Niger is likely to suffer <strong>the</strong> loss of a child.<br />
chad
afghanistan<br />
S av e t h e c h i l D r e N · S tat e o F t h e Wo r l D ’ S M ot h e r S 2 0 1 2 49<br />
The data collected for <strong>the</strong> Mo<strong>the</strong>rs’ Index document <strong>the</strong> tremendous gaps<br />
between rich and poor countries and <strong>the</strong> urgent need to accelerate progress <strong>in</strong><br />
<strong>the</strong> health and well-be<strong>in</strong>g of mo<strong>the</strong>rs and <strong>the</strong>ir children. The data also highlight<br />
<strong>the</strong> regional dimension of this tragedy. Eight of <strong>the</strong> bottom 10 countries are <strong>in</strong><br />
sub-Saharan Africa. Sub-Saharan Africa also accounts for 18 of <strong>the</strong> 20 lowestrank<strong>in</strong>g<br />
countries.<br />
Individual country comparisons are especially startl<strong>in</strong>g when one considers<br />
<strong>the</strong> human suffer<strong>in</strong>g beh<strong>in</strong>d <strong>the</strong> statistics:<br />
• Less than 25 percent of births are attended by skilled health personnel <strong>in</strong><br />
Afghanistan, Chad, Lao PDR and Nepal. In Ethiopia only 6 percent of<br />
births are attended. Compare that to 99 percent <strong>in</strong> Sri Lanka and 95 percent<br />
<strong>in</strong> Botswana.<br />
• Accord<strong>in</strong>g to <strong>the</strong> most recent estimates, 1 woman <strong>in</strong> 11 dies <strong>in</strong> pregnancy or<br />
childbirth <strong>in</strong> Afghanistan. The risk is 1 <strong>in</strong> 14 <strong>in</strong> Chad and Somalia. In Italy<br />
and Ireland <strong>the</strong> risk of maternal death is less than 1 <strong>in</strong> 15,<strong>000</strong> and <strong>in</strong> Greece<br />
it’s 1 <strong>in</strong> 31,800.<br />
• A girl born today isn’t likely to live much past <strong>the</strong> age of 50 <strong>in</strong> Botswana,<br />
Central African Republic, Democratic Republic of <strong>the</strong> Congo, Gu<strong>in</strong>ea-<br />
Bissau and Zambia. In Afghanistan, Lesotho, Sierra Leone and Swaziland,<br />
<strong>the</strong> average girl won’t live to see her 50th birthday, while <strong>in</strong> Japan female life<br />
expectancy is over 87 years old.<br />
• In Somalia, only 1 percent of women use modern contraception. Rates are<br />
5 percent or less <strong>in</strong> Angola, Chad, Eritrea, Gu<strong>in</strong>ea and Niger. And less than<br />
10 percent of women use modern contraception <strong>in</strong> 13 o<strong>the</strong>r develop<strong>in</strong>g<br />
countries. By contrast, at least 80 percent of women <strong>in</strong> Norway, Portugal<br />
and Thailand and 84 percent of women <strong>in</strong> Ch<strong>in</strong>a and <strong>the</strong> United K<strong>in</strong>gdom<br />
use some form of modern contraception.<br />
• In Afghanistan, Jordan, Lebanon, Libya, Morocco, Oman, Pakistan, Syria<br />
and Yemen, women earn 25 cents or less for every dollar men earn. Saudi<br />
and Palest<strong>in</strong>ian women earn only 16 and 12 cents respectively to <strong>the</strong> male<br />
dollar. In Mongolia, women earn 87 cents for every dollar men earn and <strong>in</strong><br />
Mozambique <strong>the</strong>y earn 90 cents.<br />
Progress <strong>in</strong> afghanistan<br />
After two years as <strong>the</strong> worst place <strong>in</strong> <strong>the</strong><br />
world to be a mo<strong>the</strong>r, Afghanistan has<br />
moved up one notch on <strong>the</strong> Mo<strong>the</strong>rs’ Index<br />
this year. Afghanistan has made note-<br />
worthy improvements <strong>in</strong> maternal and<br />
child health and well-be<strong>in</strong>g. Skilled birth<br />
attendance has risen from 14 to 24 percent.<br />
Female life expectancy is up by almost 5<br />
years. The average number of years girls<br />
are <strong>in</strong> school has <strong>in</strong>creased by a year and<br />
a half. Child mortality has dropped from<br />
around 200 deaths per 1,<strong>000</strong> live births to<br />
149. And enrollment <strong>in</strong> primary school has<br />
been climb<strong>in</strong>g steadily. In 2<strong>000</strong>, only 20<br />
percent of primary-school-age children were<br />
enrolled <strong>in</strong> school, and twice as many boys<br />
as girls were <strong>in</strong> school. Today, enrollment <strong>in</strong><br />
primary school is at 97 percent.<br />
What expla<strong>in</strong>s Afghanistan’s progress?<br />
One answer is that it has <strong>in</strong>vested <strong>in</strong> tra<strong>in</strong>-<br />
<strong>in</strong>g and deploy<strong>in</strong>g more frontl<strong>in</strong>e health<br />
workers. With support from <strong>in</strong>ternational<br />
partners, Afghanistan <strong>in</strong>creased its cadre of<br />
community health workers from 2,500 <strong>in</strong><br />
2004 to about 22,<strong>000</strong> today. And <strong>the</strong>re are<br />
now 3,<strong>000</strong> tra<strong>in</strong>ed midwives, up from about<br />
500 <strong>in</strong> 2003.<br />
Despite this progress, Afghanistan still<br />
has a long way to go. Half of <strong>the</strong> population<br />
does not have access to safe dr<strong>in</strong>k<strong>in</strong>g water.<br />
Only 7 girls for every 10 boys are enrolled <strong>in</strong><br />
primary school – <strong>the</strong> second largest gender<br />
disparity <strong>in</strong> education <strong>in</strong> <strong>the</strong> world. One<br />
child <strong>in</strong> 3 is underweight. One child <strong>in</strong> 7<br />
dies before reach<strong>in</strong>g age 5. Only 1 <strong>in</strong> 4 births<br />
is attended by skilled personnel. Just 1<br />
woman <strong>in</strong> 6 is us<strong>in</strong>g modern contraception.<br />
And, accord<strong>in</strong>g to <strong>the</strong> latest <strong>in</strong>ternational<br />
estimates, 1 woman <strong>in</strong> 11 will die of a preg-<br />
nancy-related cause – <strong>the</strong> highest lifetime<br />
risk of maternal mortality <strong>in</strong> <strong>the</strong> world.<br />
Results from a recent national survey<br />
suggest that Afghanistan’s maternal mortal-<br />
ity rate is on <strong>the</strong> decl<strong>in</strong>e, but Afghanistan<br />
still has <strong>the</strong> highest lifetime risk of maternal<br />
mortality <strong>in</strong> <strong>the</strong> world. It also places second<br />
to last on female life expectancy and gender<br />
disparity <strong>in</strong> primary education.
50 appeNDix: <strong>the</strong> Mo<strong>the</strong>rS’ iNDex aND coUNtry raNKiNgS<br />
• In Qatar, Saudi Arabia and <strong>the</strong> Solomon Islands, not one parliamentary<br />
seat is occupied by a woman. In Comoros and Papua New Gu<strong>in</strong>ea, women<br />
have only 1 seat. Compare that to Rwanda, where women hold over half of<br />
all seats <strong>in</strong> parliament.<br />
• A typical female <strong>in</strong> Central African Republic, Côte d’Ivoire, Djibouti,<br />
Gu<strong>in</strong>ea-Bissau, Papua New Gu<strong>in</strong>ea and Tanzania receives only 5 years of<br />
formal education. In Eritrea and Niger, it’s 4 years and <strong>in</strong> Somalia, girls<br />
receive less than 2 years of education. In Australia, Iceland and New Zealand,<br />
however, <strong>the</strong> average woman stays <strong>in</strong> school for 20 years.<br />
• In Somalia, 2 out of 3 children are not enrolled <strong>in</strong> primary school. More<br />
than half (55 percent) of all children <strong>in</strong> Eritrea are not <strong>in</strong> school. In Djibouti<br />
and Papua New Gu<strong>in</strong>ea, out-of-school rates are 40 percent. In comparison,<br />
nearly all children <strong>in</strong> France, Norway, Spa<strong>in</strong> and Sweden make it from<br />
preschool all <strong>the</strong> way to high school.<br />
• In Central African Republic and Chad, fewer than 3 girls for every 4 boys<br />
are enrolled <strong>in</strong> primary school. In Afghanistan, it’s close to 2 girls for every<br />
3 boys. And <strong>in</strong> Somalia, boys outnumber girls by almost 2 to 1.<br />
• More than 1 child <strong>in</strong> 6 does not reach his or her fifth birthday <strong>in</strong> Burk<strong>in</strong>a<br />
Faso, Chad, Democratic Republic of <strong>the</strong> Congo, Mali,<br />
Sierra Leone and Somalia. In Iceland only 1 child <strong>in</strong> 500<br />
dies before age 5.<br />
• Over 40 percent of children under age 5 suffer from malnutrition<br />
<strong>in</strong> Bangladesh, India, Madagascar, Niger and<br />
Yemen. In Timor-Leste, 45 percent of children are moderately<br />
or severely underweight.<br />
• More than half of <strong>the</strong> population <strong>in</strong> Democratic Republic<br />
of <strong>the</strong> Congo, Equatorial Gu<strong>in</strong>ea, Ethiopia, Madagascar,<br />
Mozambique, Niger and Papua New Gu<strong>in</strong>ea lack access<br />
to safe dr<strong>in</strong>k<strong>in</strong>g water. In Somalia, 70 percent of people<br />
lack access to safe water.<br />
Statistics are far more than numbers. It is <strong>the</strong> human<br />
despair and lost opportunities beh<strong>in</strong>d <strong>the</strong>se numbers that<br />
call for changes to ensure that mo<strong>the</strong>rs everywhere have<br />
<strong>the</strong> basic tools <strong>the</strong>y need to break <strong>the</strong> cycle of poverty and<br />
improve <strong>the</strong> quality of life for <strong>the</strong>mselves, <strong>the</strong>ir children,<br />
and for generations to come.<br />
<strong>in</strong>dia
S av e t h e c h i l D r e N · S tat e o F t h e Wo r l D ’ S M ot h e r S 2 0 1 2 51<br />
Frequently asked Questions about <strong>the</strong> Mo<strong>the</strong>rs’ Index<br />
Why doesn’t <strong>the</strong> United States do better <strong>in</strong><br />
<strong>the</strong> rank<strong>in</strong>gs?<br />
This year <strong>the</strong> United States moved up six spots, from<br />
31st to 25th place. Improvements across education <strong>in</strong>di-<br />
cators are largely responsible for <strong>the</strong> movement. Despite<br />
<strong>the</strong>se ga<strong>in</strong>s, however, <strong>the</strong> U.S. still performs below aver-<br />
age overall and quite poorly on a number of measures:<br />
• One of <strong>the</strong> key <strong>in</strong>dicators of maternal well-be<strong>in</strong>g is<br />
lifetime risk of maternal mortality. In <strong>the</strong> United<br />
States, mo<strong>the</strong>rs face a 1 <strong>in</strong> 2,100 risk of maternal death<br />
– <strong>the</strong> highest of any <strong>in</strong>dustrialized nation. In fact, only<br />
three developed countries – Albania, Moldova and <strong>the</strong><br />
Russian Federation – perform worse than <strong>the</strong> United<br />
States on this <strong>in</strong>dicator. A woman <strong>in</strong> <strong>the</strong> U.S. is more<br />
than 7 times as likely as a woman <strong>in</strong> Ireland or Italy<br />
to die from a pregnancy-related cause and her risk of<br />
maternal death is 15 times that of a woman <strong>in</strong> Greece.<br />
• Similarly, <strong>the</strong> United States does not do as well as<br />
most o<strong>the</strong>r developed countries with regard to under-5<br />
mortality. The U.S. under-5 mortality rate is 8 per<br />
1,<strong>000</strong> births. This is on par with rates <strong>in</strong> Bosnia and<br />
Herzegov<strong>in</strong>a, Montenegro, Slovakia and Qatar. Forty<br />
countries performed better than <strong>the</strong> U.S. on this<br />
<strong>in</strong>dicator. This means that a child <strong>in</strong> <strong>the</strong> U.S. is four<br />
times as likely as a child <strong>in</strong> Iceland to die before his or<br />
her 5th birthday.<br />
• The United States has <strong>the</strong> least generous maternity<br />
leave policy of any wealthy nation. It is <strong>the</strong> only devel-<br />
oped country – and one of only a handful of countries<br />
<strong>in</strong> <strong>the</strong> world – that does not guarantee work<strong>in</strong>g moth-<br />
ers paid leave.<br />
• The United States is also lagg<strong>in</strong>g beh<strong>in</strong>d with regard<br />
to preschool enrollment and <strong>the</strong> political status of<br />
women. Performance <strong>in</strong> both areas places it among<br />
<strong>the</strong> bottom 10 <strong>in</strong> <strong>the</strong> developed world.<br />
Why is Norway number one?<br />
Norway generally performed as well as or better<br />
than o<strong>the</strong>r countries <strong>in</strong> <strong>the</strong> rank<strong>in</strong>gs on all <strong>in</strong>dicators. It<br />
ranks among <strong>the</strong> very best (i.e. top 5) on contraceptive<br />
use, female education and political representation and<br />
has one of <strong>the</strong> most generous maternity leave policies<br />
<strong>in</strong> <strong>the</strong> developed world. It also has <strong>the</strong> highest ratio of<br />
female-to-male earned <strong>in</strong>come and <strong>the</strong> second lowest<br />
under-5 mortality rate (tied with five o<strong>the</strong>r countries) <strong>in</strong><br />
<strong>the</strong> developed world.<br />
Why is Niger last?<br />
It is <strong>the</strong> cumulative effect of underperformance that<br />
lands Niger at <strong>the</strong> bottom of <strong>the</strong> Index Index. . Unlike many<br />
o<strong>the</strong>r least-developed countries, which perform “well”<br />
with respect to <strong>the</strong>ir peers on at least one measure,<br />
Niger performs very poorly across all <strong>in</strong>dicators of<br />
maternal and child health and well-be<strong>in</strong>g. Levels of<br />
maternal mortality and education, contraceptive use,<br />
women’s <strong>in</strong>come relative to men’s, as well as primary<br />
school enrollment and rates of child malnutrition are<br />
among <strong>the</strong> very worst <strong>in</strong> <strong>the</strong> world.<br />
Why are some countries not <strong>in</strong>cluded <strong>in</strong> <strong>the</strong><br />
Mo<strong>the</strong>rs’ Index?<br />
Rank<strong>in</strong>gs were based on a country's performance<br />
with respect to a def<strong>in</strong>ed set of <strong>in</strong>dicators related<br />
primarily to health, nutrition, education, economic<br />
and political status. There were 165 countries for<br />
which published <strong>in</strong>formation regard<strong>in</strong>g performance<br />
on <strong>the</strong>se <strong>in</strong>dicators existed. All 165 were <strong>in</strong>cluded <strong>in</strong><br />
<strong>the</strong> study. The only basis for exclud<strong>in</strong>g countries was<br />
<strong>in</strong>sufficient or unavailable data or national population<br />
below 250,<strong>000</strong>.<br />
Why can’t country performance be compared across<br />
development tiers?<br />
Indicators for <strong>the</strong> three tiers were selected to best<br />
represent factors of maternal well-be<strong>in</strong>g specific to<br />
each level of development. Because <strong>the</strong> set of <strong>in</strong>dicators<br />
tracked for each tier is different, a s<strong>in</strong>gle Index rank<strong>in</strong>g<br />
cannot be generated and performance on <strong>the</strong> rank<strong>in</strong>gs<br />
should not be compared across tiers.<br />
What should be done to bridge <strong>the</strong> divide between<br />
countries that meet <strong>the</strong> needs of <strong>the</strong>ir mo<strong>the</strong>rs and<br />
those that don’t?<br />
• Governments and <strong>in</strong>ternational agencies need to<br />
<strong>in</strong>crease fund<strong>in</strong>g to improve education levels for<br />
women and girls, provide access to maternal and<br />
child health care and advance women’s economic<br />
opportunities.<br />
• The <strong>in</strong>ternational community also needs to improve<br />
current research and conduct new studies that focus<br />
specifically on mo<strong>the</strong>rs’ and children’s well-be<strong>in</strong>g.<br />
• In <strong>the</strong> United States and o<strong>the</strong>r <strong>in</strong>dustrialized nations,<br />
governments and communities need to work toge<strong>the</strong>r<br />
to improve education and health care for disadvan-<br />
taged mo<strong>the</strong>rs and children.
2012 2012 mo<strong>the</strong>rs’ mo<strong>the</strong>rs’ <strong>in</strong>dex Rank<strong>in</strong>gs<br />
52 appeNDix: <strong>the</strong> Mo<strong>the</strong>rS’ iNDex aND coUNtry raNKiNgS<br />
tieR i: moRe deVeLoPed CoUntRies<br />
coUNtry Mo<strong>the</strong>rS’<br />
iNDex raNK*<br />
tieR ii: Less deVeLoPed CoUntRies<br />
coUNtry Mo<strong>the</strong>rS’<br />
iNDex raNK*<br />
WoMeN’S<br />
iNDex raNK**<br />
WoMeN’S<br />
iNDex raNK**<br />
chilDreN’S<br />
iNDex raNK***<br />
Norway 1 1 11<br />
iceland 2 5 1<br />
Sweden 3 7 2<br />
New Zealand 4 2 25<br />
Denmark 5 4 25<br />
F<strong>in</strong>land 6 6 19<br />
australia 7 3 32<br />
Belgium 8 10 14<br />
ireland 9 9 8<br />
Ne<strong>the</strong>rlands 10 8 27<br />
United K<strong>in</strong>gdom 10 11 16<br />
germany 12 16 7<br />
Slovenia 13 12 12<br />
France 14 14 6<br />
portugal 15 13 13<br />
Spa<strong>in</strong> 16 14 20<br />
estonia 17 18 10<br />
Switzerland 18 20 17<br />
canada 19 17 24<br />
greece 20 21 18<br />
italy 21 25 5<br />
hungary 22 23 22<br />
lithuania 23 22 28<br />
Belarus 24 29 21<br />
United States 25 19 31<br />
czech republic 26 28 22<br />
austria 27 32 4<br />
poland 28 27 29<br />
croatia 29 26 30<br />
Japan 30 36 3<br />
luxembourg 30 35 9<br />
latvia 32 24 34<br />
Slovakia 33 30 33<br />
Malta 34 41 14<br />
romania 35 31 39<br />
Serbia 36 38 37<br />
Bulgaria 37 33 40<br />
russian Federation 37 34 38<br />
Ukra<strong>in</strong>e 39 39 36<br />
Bosnia and herzegov<strong>in</strong>a 40 37 41<br />
Moldova 41 40 42<br />
Macedonia, tFyr 42 42 43<br />
albania 43 43 44<br />
chilDreN’S<br />
iNDex raNK***<br />
cuba 1 3 12<br />
israel 2 1 4<br />
Barbados 3 2 16<br />
argent<strong>in</strong>a 4 5 8<br />
cyprus 5 4 1<br />
Korea, republic of 6 6 2<br />
Uruguay 7 8 8<br />
Kazakhstan 8 9 26<br />
Mongolia 8 7 45<br />
Bahamas 10 11 14<br />
colombia 11 10 28<br />
Brazil 12 14 7<br />
costa rica 13 20 3<br />
ch<strong>in</strong>a 14 13 34<br />
chile 15 20 5<br />
thailand 16 15 35<br />
Jamaica 17 18 29<br />
venezuela, Bolivarian republic of 17 17 41<br />
Mexico 19 26 18<br />
ecuador 20 30 33<br />
Kuwait 20 26 18<br />
vietnam 20 16 61<br />
peru 23 22 36<br />
panama 24 22 32<br />
tr<strong>in</strong>idad and tobago 24 31 31<br />
Bahra<strong>in</strong> 26 33 22<br />
Dom<strong>in</strong>ican republic 26 19 51<br />
Kyrgyzstan 26 28 36<br />
tunisia 26 38 18<br />
armenia 30 36 14<br />
paraguay 31 25 43<br />
Uzbekistan 31 24 48<br />
Bolivia, plur<strong>in</strong>ational State of 33 28 54<br />
South africa 33 31 56<br />
Mauritius 35 34 36<br />
cape verde 36 36 56<br />
el Salvador 37 41 46<br />
Qatar 37 53 6<br />
United arab emirates 37 49 25<br />
Fiji 40 47 22<br />
* Due to different <strong>in</strong>dicator weights and round<strong>in</strong>g, it is<br />
possible for a country to rank high on <strong>the</strong> women’s or<br />
children’s <strong>in</strong>dex but not score among <strong>the</strong> very highest<br />
countries <strong>in</strong> <strong>the</strong> overall Mo<strong>the</strong>rs’ Index. For a complete<br />
explanation of <strong>the</strong> <strong>in</strong>dicator weight<strong>in</strong>g, please see <strong>the</strong><br />
Methodology and research Notes.<br />
tieR ii: Less deVeLoPed CoUntRies<br />
coUNtry Mo<strong>the</strong>rS’<br />
iNDex raNK*<br />
tieR iii: Least deVeLoPed CoUntRies<br />
coUNtry Mo<strong>the</strong>rS’<br />
iNDex raNK*<br />
** rank<strong>in</strong>gs for tiers i, ii and iii are out of <strong>the</strong> 43, 81 and 42<br />
countries respectively for which sufficient data existed to<br />
calculate <strong>the</strong> Women’s Index.<br />
WoMeN’S<br />
iNDex raNK**<br />
WoMeN’S<br />
iNDex raNK**<br />
chilDreN’S<br />
iNDex raNK***<br />
Malaysia 41 45 39<br />
Belize 42 51 24<br />
georgia 42 55 10<br />
Sri lanka 42 35 61<br />
Maldives 45 40 54<br />
Namibia 46 39 67<br />
lebanon 47 59 17<br />
turkey 47 63 10<br />
Nicaragua 49 54 59<br />
algeria 50 49 44<br />
iran, islamic republic of 50 57 26<br />
libya 52 42 60<br />
philipp<strong>in</strong>es 52 42 64<br />
guyana 54 58 52<br />
Sur<strong>in</strong>ame 54 51 49<br />
Jordan 56 67 13<br />
oman 57 64 29<br />
Botswana 58 55 58<br />
<strong>in</strong>donesia 59 46 70<br />
honduras 60 64 52<br />
azerbaijan 61 62 65<br />
tajikistan 62 44 73<br />
Saudi arabia 63 69 39<br />
Swaziland 64 48 72<br />
egypt 65 72 21<br />
occupied palest<strong>in</strong>ian territory 66 70 42<br />
ghana 67 59 71<br />
guatemala 68 71 63<br />
Syrian arab republic 69 75 50<br />
Zimbabwe 70 68 74<br />
gabon 71 59 79<br />
Kenya 72 66 78<br />
Morocco 72 77 66<br />
congo 74 73 75<br />
cameroon 75 74 81<br />
<strong>in</strong>dia 76 76 77<br />
papua New gu<strong>in</strong>ea 77 78 83<br />
pakistan 78 80 76<br />
côte d’ivoire 79 81 80<br />
Nigeria 80 79 82<br />
chilDreN’S<br />
iNDex raNK***<br />
rwanda 1 1 7<br />
Bhutan 2 7 1<br />
Malawi 3 4 3<br />
lesotho 4 6 4<br />
Uganda 5 8 10<br />
cambodia 6 3 13<br />
Myanmar 7 10 9<br />
Burundi 8 2 24<br />
Solomon islands 9 13 2<br />
Mozambique 10 5 29<br />
lao people’s Democratic republic 11 11 20<br />
Nepal 12 14 16<br />
timor-leste 13 12 25<br />
comoros 14 17 5<br />
Madagascar 15 8 35<br />
Bangladesh 16 16 13<br />
tanzania, United republic of 17 18 12<br />
Senegal 18 21 8<br />
gambia 19 19 6<br />
angola 20 15 33<br />
Mauritania 21 21 20<br />
liberia 22 25 11<br />
Djibouti 23 24 18<br />
togo 24 23 19<br />
ethiopia 25 20 32<br />
Ben<strong>in</strong> 26 28 17<br />
Zambia 27 30 13<br />
gu<strong>in</strong>ea 28 25 22<br />
Burk<strong>in</strong>a Faso 29 27 28<br />
Sierra leone 30 29 36<br />
equatorial gu<strong>in</strong>ea 31 34 27<br />
central african republic 32 33 34<br />
Democratic republic of <strong>the</strong> congo 33 32 40<br />
South Sudan 33 36 30<br />
Sudan 33 38 30<br />
chad 36 31 42<br />
eritrea 37 36 37<br />
Mali 38 35 38<br />
gu<strong>in</strong>ea-Bissau 39 40 26<br />
yemen 40 39 39<br />
afghanistan 41 41 41<br />
Niger 42 42 43<br />
*** rank<strong>in</strong>gs for tiers i, ii and iii are out of <strong>the</strong> 44, 83 and<br />
44 countries respectively for which sufficient data existed to<br />
calculate <strong>the</strong> <strong>Children</strong>’s Index.
THE COMPLETE MOTHERS’ INDEX 2012<br />
TIER I Women’s Index <strong>Children</strong>’s Index Rank<strong>in</strong>gs<br />
Development Group Health Status<br />
MORE DEVELOPED<br />
COUNTRIES<br />
Lifetime risk<br />
of maternal<br />
death<br />
(1 <strong>in</strong><br />
number<br />
stated)<br />
Percent of<br />
women us<strong>in</strong>g<br />
modern<br />
contraception<br />
To copy this table onto 8 1 ⁄2 x 11" paper, set your photocopier reduction to 85%<br />
Female life<br />
expectancy<br />
at birth<br />
(years)<br />
Educational<br />
Status<br />
Expected<br />
number of<br />
years of<br />
formal<br />
female<br />
school<strong>in</strong>g<br />
Economic Status<br />
Maternity leave benefits<br />
2011<br />
Ratio of<br />
estimated<br />
female<br />
to male<br />
earned<br />
<strong>in</strong>come<br />
Political Status <strong>Children</strong>’s Status SOWM 2012<br />
Participation<br />
of women<br />
<strong>in</strong> national<br />
government<br />
(% seats held<br />
by women)<br />
Albania 1,700 10 80 11 365 days 1 80, 50 (a) 0.54 16 18 56 89 43 43 44<br />
Australia 7,400 71 84 20 18 weeks flat (b) 0.70 29 5 81 129 7 3 32<br />
Austria 14,300 47 84 16 16* weeks 100 0.40 29 4 96 100 27 32 4<br />
Belarus 5,100 56 76 15 126 days 1 100 0.63 32 6 99 96 24 29 21<br />
Belgium 10,900 73 83 17 15 weeks 82, 75 (c,d) 0.64 39 4 118 111 8 10 14<br />
Bosnia and Herzegov<strong>in</strong>a 9,300 11 78 14 1 year 50-100 (r) 0.61 19 8 17 90 40 37 41<br />
Bulgaria 5,800 40 77 14 135 days 90 0.68 21 13 79 88 37 33 40<br />
Canada 5,600 72 83 16 52 weeks 55 (d,e,r) 0.65 28 6 71 101 19 17 24<br />
Croatia 5,200 –– 80 14 1+ year 100 (f,g) 0.67 24 6 58 95 29 26 30<br />
Czech Republic 8,500 63 81 16 28* weeks 60 0.57 21 4 106 90 26 28 22<br />
Denmark 10,900 72 81 17 52 weeks 100 (d) 0.74 39 4 96 117 5 4 25<br />
Estonia 5,300 56 80 17 140* days 1 100 0.65 20 5 96 104 17 18 10<br />
F<strong>in</strong>land 7,600 75 83 17 105* days 11 70 (h) 0.73 43 3 66 108 6 6 19<br />
France 6,600 75 85 16 16* weeks 100 (d) 0.61 20 4 110 113 14 14 6<br />
Germany 11,100 66 83 16 (z) 14* weeks 100 (d) 0.59 32 4 114 103 12 16 7<br />
Greece 31,800 46 83 16 119 days 50+ (j,s) 0.51 19 4 67 101 20 21 18<br />
Hungary 5,500 71 78 16 24* weeks 70 0.75 9 6 85 98 22 23 22<br />
Iceland 9,400 –– 84 20 3 months 80 0.62 40 2 97 107 2 5 1<br />
Ireland 17,800 61 83 19 26 weeks 80 (h,d) 0.56 19 4 — 117 9 9 8<br />
Italy 15,200 41 85 17 5 months 80 0.49 21 4 97 99 21 25 5<br />
Japan 12,200 44 87 15 14 weeks 67 0.45 13 3 90 102 30 36 3<br />
Latvia 3,600 56 79 16 112 days 1 100 0.67 23 10 84 95 32 24 34<br />
Lithuania 5,800 33 78 17 126 days 1 100 0.70 19 7 75 98 23 22 28<br />
Luxembourg 3,800 –– 83 14 16 weeks 100 0.57 25 3 87 98 30 35 9<br />
Macedonia, <strong>the</strong> former Yugoslav Republic of 7,300 10 77 13 9 months — (k) 0.49 31 12 25 83 42 42 43<br />
Malta 9,200 46 82 14 14 weeks 100 (l) 0.45 9 6 111 105 34 41 14<br />
Moldova, Republic of 2,<strong>000</strong> 43 73 12 126 days 1 100 0.73 20 19 76 88 41 40 42<br />
Montenegro 4,<strong>000</strong> 17 77 15 –– –– 0.58 12 8 31 104 — — 35<br />
Ne<strong>the</strong>rlands 7,100 67 83 17 16 weeks 100 (d) 0.67 39 4 96 120 10 8 27<br />
New Zealand 3,800 72 83 20 14 weeks 100 (d) 0.69 32 6 93 119 4 2 25<br />
Norway 7,600 82 83 18 36-46* weeks 80,100 (m) 0.77 40 3 98 110 1 1 11<br />
Poland 13,300 28 81 16 20* weeks 100 0.59 22 6 66 97 28 27 29<br />
Portugal 9,800 83 83 16 120-150 days 80,100 (m) 0.60 29 4 82 107 15 13 13<br />
Romania 2,700 38 78 15 126 days 1 85 0.68 10 14 77 95 35 31 39<br />
Russian Federation 1,900 65 75 15 140 days 1 100 (d,s) 0.64 11 12 90 89 37 34 38<br />
Serbia 7,500 19 77 14 365 days 100 (n) 0.59 22 7 53 91 36 38 37<br />
Slovakia 13,300 66 80 15 28* weeks 55 0.58 16 8 91 89 33 30 33<br />
Slovenia 4,100 63 83 18 105 days 1 100 0.61 23 3 86 97 13 12 12<br />
Spa<strong>in</strong> 11,400 62 85 17 16* weeks 100 0.52 35 5 126 119 16 14 20<br />
Sweden 11,400 65 84 17 420 days 1 80 (o,d) 0.67 45 3 95 100 3 7 2<br />
Switzerland 7,600 78 85 15 14 weeks 80 (d) 0.62 27 5 102 95 18 20 17<br />
Ukra<strong>in</strong>e 3,<strong>000</strong> 48 75 15 126 days 100 0.59 8 13 97 96 39 39 36<br />
United K<strong>in</strong>gdom 4,700 84 1 82 17 52 weeks 90 (p) 0.67 22 5 81 102 10 11 16<br />
United States 2,100 73 81 18 12 weeks 0 (q) 0.62 17 (i)<br />
8 69 96 25 19 31<br />
Under-5<br />
mortality<br />
rate<br />
(per 1,<strong>000</strong><br />
live births)<br />
Gross<br />
pre-primary<br />
enrollment<br />
ratio<br />
(% of total)<br />
Gross<br />
secondary<br />
enrollment<br />
ratio<br />
(% of total)<br />
2008 2010 2010 2011 Length<br />
% Wages<br />
2007 2011 2010 2011 2011<br />
paid<br />
Mo<strong>the</strong>rs’<br />
Index Rank<br />
(out of 43<br />
countries) +<br />
Women’s<br />
Index Rank<br />
(out of 43<br />
countries) +<br />
<strong>Children</strong>’s<br />
Index Rank<br />
(out of 44<br />
countries) +
TIER II Women’s Index <strong>Children</strong>’s Index Rank<strong>in</strong>gs<br />
Development Group Health Status<br />
LESS DEVELOPED<br />
COUNTRIES and<br />
TERRITORIES<br />
(m<strong>in</strong>us least<br />
developed countries)<br />
Lifetime risk<br />
of maternal<br />
death<br />
(1 <strong>in</strong><br />
number<br />
stated)<br />
Percent of<br />
births<br />
attended by<br />
skilled health<br />
personnel<br />
Percent of<br />
women us<strong>in</strong>g<br />
modern<br />
contraception<br />
Female life<br />
expectancy<br />
at birth<br />
(years)<br />
Educational<br />
Status<br />
Expected<br />
number of<br />
years of<br />
formal<br />
female<br />
school<strong>in</strong>g<br />
Economic<br />
Status<br />
Ratio of<br />
estimated<br />
female to<br />
male earned<br />
<strong>in</strong>come<br />
Political<br />
Status<br />
Participation<br />
of women<br />
<strong>in</strong> national<br />
government<br />
(% seats held<br />
by women)<br />
Under-5<br />
mortality<br />
rate<br />
(per 1,<strong>000</strong><br />
live births)<br />
Percent of<br />
children under<br />
5 moderately<br />
or severely<br />
underweight<br />
for age<br />
<strong>Children</strong>’s Status SOWM 2012<br />
Gross<br />
primary<br />
enrollment<br />
ratio<br />
(% of total)<br />
Gross<br />
secondary<br />
enrollment<br />
ratio<br />
(% of total)<br />
Percent of<br />
population<br />
with access<br />
to safe<br />
dr<strong>in</strong>k<strong>in</strong>g water<br />
2008 2010 2010 2010 2011 2007 2011 2010 2010 2011 2011 2010<br />
Algeria 340 95 52 75 14 0.36 7 36 3 110 95 83 50 49 44<br />
Argent<strong>in</strong>a 600 98 64 80 17 0.51 38 14 2 118 89 97 (z) 4 5 8<br />
Armenia 1,900 100 19 77 13 0.57 8 20 5 103 92 98 30 36 14<br />
Azerbaijan 1,200 88 13 74 12 0.44 16 46 8 94 85 80 61 62 65<br />
Bahamas 1,<strong>000</strong> 99 60 79 13 0.72 (y) 18 16 –– 114 96 97 (z) 10 11 14<br />
Bahra<strong>in</strong> 2,200 97 31 2 76 13 (z) 0.51 19 10 9 (z) 107 103 94 (z) 26 33 22<br />
Barbados 1,100 100 53 80 18 0.65 20 20 6 (z) 120 101 100 3 2 16<br />
Belize 330 95 31 78 13 0.43 11 17 4 121 75 98 42 51 24<br />
Bolivia, Plur<strong>in</strong>ational State of 150 71 34 69 13 0.61 30 54 4 105 80 88 33 28 54<br />
Botswana 180 95 42 51 12 0.58 8 48 11 108 80 96 58 55 58<br />
Brazil 860 97 77 77 14 0.60 10 19 2 127 101 98 12 14 7<br />
Brunei Darussalam 2,<strong>000</strong> 100 –– 81 15 0.59 –– (ii) 7 –– 108 110 –– — 11 —<br />
Cameroon 35 63 12 54 10 0.53 14 136 16 120 42 77 75 74 81<br />
Cape Verde 350 78 57 78 13 0.49 21 36 9 (z) 110 88 88 36 36 56<br />
Chile 2,<strong>000</strong> 100 58 (y) 82 15 0.42 14 9 1 (z) 106 88 96 15 20 5<br />
Ch<strong>in</strong>a 1,500 99 84 76 12 0.68 21 18 4 111 81 91 14 13 34<br />
Colombia 460 98 68 78 14 0.71 14 19 3 115 96 92 11 10 28<br />
Congo 39 83 13 59 10 0.51 10 93 11 115 45 71 74 73 75<br />
Costa Rica 1,100 99 72 82 12 0.46 39 10 1 110 100 97 13 20 3<br />
Côte d’Ivoire 44 57 8 58 5 (z) 0.34 11 123 16 88 27 80 79 81 80<br />
Cuba 1,400 100 72 81 17 0.49 45 6 4 (z) 103 89 94 1 3 12<br />
Cyprus 6,600 100 (y) –– 82 15 0.58 11 4 –– 105 98 100 5 4 1<br />
Dom<strong>in</strong>ican Republic 320 98 70 77 13 0.59 19 27 7 108 76 86 26 19 51<br />
Ecuador 270 98 59 79 12 (z) 0.51 32 20 6 114 80 94 20 30 33<br />
Egypt 380 79 58 76 11 0.27 2 (iii) 22 6 106 85 99 65 72 21<br />
El Salvador 350 96 66 77 12 0.46 19 16 6 114 65 88 37 41 46<br />
Fiji 1,300 99 –– 72 14 0.38 –– (iv) 17 8 (z) 105 86 98 40 47 22<br />
Gabon 110 86 12 64 11 (z)<br />
0.59 16 74 12 (z) 182 53 87 71 59 79<br />
Georgia 1,300 100 27 77 13 0.38 7 22 1 109 86 98 42 55 10<br />
Ghana 66 57 17 66 10 0.74 8 74 14 107 58 86 67 59 71<br />
Guatemala 210 51 34 75 10 0.42 18 32 13 116 59 92 68 71 63<br />
Guyana 150 92 40 73 11 0.41 31 30 11 85 91 94 54 58 52<br />
Honduras 240 67 56 76 12 0.34 20 24 8 116 73 87 60 64 52<br />
India 140 53 49 68 10 0.32 11 63 43 118 60 92 76 76 77<br />
Indonesia 190 79 57 72 13 0.44 18 35 18 118 77 82 59 46 70<br />
Iran, Islamic Republic of 1,500 97 59 75 13 0.32 3 26 5 (z) 108 84 96 50 57 26<br />
Iraq 300 80 33 73 9 –– 25 39 6 105 53 79 — — 67<br />
Israel 5,100 99 52 3 84 16 0.64 20 5 –– 113 91 100 2 1 4<br />
Jamaica 450 98 66 76 13 0.58 15 24 2 89 93 93 17 18 29<br />
Jordan 510 99 41 75 14 0.19 11 22 2 97 91 97 56 67 13<br />
Kazakhstan 950 100 49 73 16 0.68 14 33 4 111 100 95 8 9 26<br />
Kenya 38 44 39 59 11 0.65 10 85 16 113 60 59 72 66 78<br />
Korea, Democratic People’s Republic of 230 100 58 72 –– –– 16 33 19 –– 98 (z) 98 — — 47<br />
Korea, Republic of 4,700 100 (y) 70 84 16 0.52 15 5 –– 104 97 98 6 6 2<br />
Kuwait 4,500 100 39 2 76 15 0.36 8 11 10 (z) 106 101 99 20 26 18<br />
Mo<strong>the</strong>rs’<br />
Index Rank<br />
(out of 80<br />
countries) +<br />
Women’s<br />
Index Rank<br />
(out of 81<br />
countries) +<br />
<strong>Children</strong>’s<br />
Index Rank<br />
(out of 83<br />
countries) +
THE COMPLETE MOTHERS’ INDEX 2012<br />
TIER II cont<strong>in</strong>ued Women’s Index <strong>Children</strong>’s Index Rank<strong>in</strong>gs<br />
Development Group Health Status<br />
LESS DEVELOPED<br />
COUNTRIES and<br />
TERRITORIES<br />
(m<strong>in</strong>us least developed<br />
countries)<br />
Lifetime risk<br />
of maternal<br />
death<br />
(1 <strong>in</strong><br />
number<br />
stated)<br />
Percent of<br />
births<br />
attended by<br />
skilled health<br />
personnel<br />
Percent of<br />
women us<strong>in</strong>g<br />
modern<br />
contraception<br />
Female life<br />
expectancy<br />
at birth<br />
(years)<br />
Educational<br />
Status<br />
Expected<br />
number of<br />
years of<br />
formal<br />
female<br />
school<strong>in</strong>g<br />
Economic<br />
Status<br />
Ratio of<br />
estimated<br />
female to<br />
male earned<br />
<strong>in</strong>come<br />
Political<br />
Status<br />
Participation<br />
of women<br />
<strong>in</strong> national<br />
government<br />
(% seats held<br />
by women)<br />
Under-5<br />
mortality<br />
rate<br />
(per 1,<strong>000</strong><br />
live births)<br />
Percent of<br />
children under<br />
5 moderately<br />
or severely<br />
underweight<br />
for age<br />
<strong>Children</strong>’s Status SOWM 2012<br />
Gross<br />
primary<br />
enrollment<br />
ratio<br />
(% of total)<br />
Gross<br />
secondary<br />
enrollment<br />
ratio<br />
(% of total)<br />
Percent of<br />
population<br />
with access<br />
to safe<br />
dr<strong>in</strong>k<strong>in</strong>g water<br />
2008 2010 2010 2010 2011 2007 2011 2010 2010 2011 2011 2010<br />
Kyrgyzstan 450 99 46 72 13 0.55 23 38 2 100 84 90 26 28 36<br />
Lebanon 2,<strong>000</strong> 98 34 75 14 0.25 3 22 4 (z) 105 81 100 47 59 17<br />
Libya 540 100 26 78 16 0.25 8 17 5 (z) 114 110 72 (z) 52 42 60<br />
Malaysia 1,200 99 30 4 77 13 0.42 13 6 13 96 68 100 41 45 39<br />
Maldives 1,200 95 27 79 13 0.54 7 15 17 109 71 98 45 40 54<br />
Mauritius 1,600 98 39 77 14 0.42 19 15 15 (z) 99 89 99 35 34 36<br />
Mexico 500 95 67 80 14 0.42 25 17 3 115 87 96 19 26 18<br />
Mongolia 730 100 61 73 15 0.87 4 32 5 100 93 82 8 7 45<br />
Morocco 360 63 52 75 10 0.24 11 36 9 114 56 83 72 77 66<br />
Namibia 160 81 54 63 11 0.63 25 40 17 107 64 93 46 39 67<br />
Nicaragua 300 74 69 77 11 0.34 40 27 6 118 69 85 49 54 59<br />
Nigeria 23 39 8 53 8 0.42 7 143 23 83 44 58 80 79 82<br />
Occupied Palest<strong>in</strong>ian Territory — 99 39 75 14 0.12 (y) –– (v) 22 3 (z) 91 86 85 66 70 42<br />
Oman 1,600 99 25 76 14 0.23 10 9 9 105 100 89 57 64 29<br />
Pakistan 93 39 19 67 6 0.18 21 87 31 95 34 92 78 80 76<br />
Panama 520 89 54 79 14 0.58 9 20 4 108 74 93 (z) 24 22 32<br />
Papua New Gu<strong>in</strong>ea 94 53 20 (y) 66 5 0.74 1 61 18 60 19 40 77 78 83<br />
Paraguay 310 82 70 75 12 0.64 14 25 3 100 67 86 31 25 43<br />
Peru 370 84 50 77 13 0.59 22 19 4 109 92 85 23 22 36<br />
Philipp<strong>in</strong>es 320 62 34 73 12 0.58 22 29 22 106 85 92 52 42 64<br />
Qatar 4,400 100 32 2 78 14 0.28 0 8 6 (z) 103 94 100 37 53 6<br />
Saudi Arabia 1,300 97 29 (y) 2 76 14 0.16 0 18 14 (z) 106 101 95 (z) 63 69 39<br />
S<strong>in</strong>gapore 10,<strong>000</strong> 100 (y) 55 84 –– 0.53 22 3 3 (z) — — 100 — — —<br />
South Africa 100 91 60 54 12 (z) 0.60 41(vi) 57 9 102 94 91 33 31 56<br />
Sri Lanka 1,100 99 53 5 78 12 (z) 0.56 6 17 21 99 87 91 42 35 61<br />
Sur<strong>in</strong>ame 400 90 45 74 13 (z) 0.44 12 31 7 113 75 92 54 51 49<br />
Swaziland 75 82 47 49 10 0.71 22 78 6 116 58 71 64 48 72<br />
Syrian Arab Republic 610 96 43 78 10 (z) 0.20 12 16 10 118 72 90 69 75 50<br />
Tajikistan 430 83 32 71 11 0.65 18 63 15 102 87 64 62 44 73<br />
Thailand 1,200 100 80 78 13 0.63 16 13 7 91 79 96 16 15 35<br />
Tr<strong>in</strong>idad and Tobago 1,100 98 38 74 12 0.55 27 27 6 (z) 105 90 94 24 31 31<br />
Tunisia 860 95 52 77 15 0.28 27 16 3 109 90 94 (z) 26 38 18<br />
Turkey 1,900 91 46 77 12 0.26 14 18 2 102 78 100 47 63 10<br />
Turkmenistan 500 100 45 69 –– 0.65 17 56 8 99 (z) 84 (z) 72 (z) — — 69<br />
United Arab Emirates 4,200 100 24 2 78 13 0.27 18 7 14 (z) 104 92 100 37 49 25<br />
Uruguay 1,700 100 75 6 81 17 0.55 12 11 5 113 90 100 7 8 8<br />
Uzbekistan 1,400 100 59 72 11 0.64 19 52 4 95 106 87 31 24 48<br />
Venezuela, Bolivarian Republic of 540 95 62 78 15 0.48 17 18 4 103 83 83 (z) 17 17 41<br />
Vietnam 850 88 68 77 12 0.69 24 23 20 106 77 95 20 16 61<br />
Zimbabwe 42 66 58 53 10 0.58 (y) 18 80 10 91 (z) 45 (z)<br />
80 70 68 74<br />
Note: Data refer to <strong>the</strong> year specified <strong>in</strong> <strong>the</strong> column head<strong>in</strong>g or <strong>the</strong> most recently available. (y) Data are from an earlier publication of <strong>the</strong> same source. (z) Data differ from <strong>the</strong> standard def<strong>in</strong>ition and/or are from a secondary source. – No data ' Calendar days '' Work<strong>in</strong>g days (all o<strong>the</strong>r days unspecified)<br />
+ The Mo<strong>the</strong>rs’ Index rank<strong>in</strong>gs <strong>in</strong>clude only <strong>the</strong> countries for which sufficient data were available to calculate both <strong>the</strong> Women’s and <strong>Children</strong>’s Indexes. The Women’s Index and <strong>Children</strong>’s Index ranks, however, <strong>in</strong>clude additional countries for which adequate data were available to present f<strong>in</strong>d<strong>in</strong>gs on ei<strong>the</strong>r women’s or children's<br />
<strong>in</strong>dicators, but not both. For complete methodology see Methodology and Research Notes.<br />
‡ Apart from political status, <strong>the</strong> data presented are pre-cession estimates.<br />
(i) The total <strong>in</strong>cludes all vot<strong>in</strong>g members of <strong>the</strong> House; (ii) There is no parliament; (iii) Results of elections to <strong>the</strong> lower or upper house only, not both; (iv) Parliament has been dissolved or suspended for an <strong>in</strong>def<strong>in</strong>ite period; (v) The legislative council has been unable to meet and govern s<strong>in</strong>ce 2007; (vi) Figures calculated on <strong>the</strong><br />
basis of permanent seats only; (vii) The parliament was dissolved follow<strong>in</strong>g <strong>the</strong> December 2008 coup.<br />
(a) 80% prior to birth and for 150 days after; 50% for <strong>the</strong> rest of <strong>the</strong> leave period; (b) Each parent can take up to 12 months of leave, of which 18 weeks are paid; (c) 82% for <strong>the</strong> first 30 days; 75% for <strong>the</strong> rema<strong>in</strong><strong>in</strong>g period; (d) Up to a ceil<strong>in</strong>g; (e) Federal = 17 weeks maternity leave, additional 35 weeks parental leave shared<br />
between both parents; (f) 45 days before delivery and 1 year after; (g) 100% until <strong>the</strong> child reaches 6 months, <strong>the</strong>n at a flat rate for <strong>the</strong> rema<strong>in</strong><strong>in</strong>g period; (h) Benefits vary, but <strong>the</strong>re is a m<strong>in</strong>imum flat rate; (j) 50% plus a dependent's supplement (m<strong>in</strong>imum benefit = 67%); a maternity supplement of up to 33% may also be<br />
provided (i.e. most mo<strong>the</strong>rs get 100% replacement of earn<strong>in</strong>gs); (k) Paid amount not specified; (l) Paid only <strong>the</strong> first 13 weeks; (m) Parental benefits paid at 100% for <strong>the</strong> shorter duration of leave; 80% for <strong>the</strong> longer option; (n) 100% of earn<strong>in</strong>gs paid for <strong>the</strong> first 6 months; 60% from <strong>the</strong> 6th-9th month; 30% for <strong>the</strong> last 3 months;<br />
(o) 480 days paid parental leave, 60 days reserved for each parent: 80% for 390 days, flat rate for rema<strong>in</strong><strong>in</strong>g 90; (p) 90% for <strong>the</strong> first 6 weeks and a flat rate for <strong>the</strong> rema<strong>in</strong><strong>in</strong>g weeks; (q) No national program; cash benefits may be provided at <strong>the</strong> state level; (r) Benefits vary by prov<strong>in</strong>ce/canton; (s) A birth grant is also paid <strong>in</strong> lump sum.<br />
(1) Data excludes Nor<strong>the</strong>rn Ireland; (2) Data perta<strong>in</strong> to nationals of <strong>the</strong> country; (3) Data perta<strong>in</strong> to <strong>the</strong> Jewish population; (4) Data perta<strong>in</strong> to Pen<strong>in</strong>sular Malaysia; (5) Data exclude <strong>the</strong> Nor<strong>the</strong>rn Prov<strong>in</strong>ce; (6) Data perta<strong>in</strong> to men and women.<br />
* These countries also offer prolonged periods of leave of at least two years ei<strong>the</strong>r as parental leave alone or by tak<strong>in</strong>g parental leave <strong>in</strong> addition to o<strong>the</strong>r child-related leave. For additional <strong>in</strong>formation on leave entitlements see <strong>the</strong> OECD Family Database: oecd.org/dataoecd/45/26/37864482.pdf<br />
Mo<strong>the</strong>rs’<br />
Index Rank<br />
(out of 80<br />
countries) +<br />
Women’s<br />
Index Rank<br />
(out of 81<br />
countries) +<br />
<strong>Children</strong>’s<br />
Index Rank<br />
(out of 83<br />
countries) +
TIER III Women’s Index <strong>Children</strong>’s Index Rank<strong>in</strong>gs<br />
Development Group Health Status<br />
LEAST DEVELOPED<br />
COUNTRIES<br />
Lifetime risk<br />
of maternal<br />
death<br />
(1 <strong>in</strong><br />
number<br />
stated)<br />
Percent of<br />
births<br />
attended by<br />
skilled health<br />
personnel<br />
Percent of<br />
women us<strong>in</strong>g<br />
modern<br />
contraception<br />
To copy this table onto 8 1 ⁄2 x 11" paper, set your photocopier reduction to 85%<br />
Female life<br />
expectancy<br />
at birth<br />
(years)<br />
Educational<br />
Status<br />
Expected<br />
number of<br />
years of<br />
formal<br />
female<br />
school<strong>in</strong>g<br />
Economic<br />
Status<br />
Ratio of<br />
estimated<br />
female to<br />
male earned<br />
<strong>in</strong>come<br />
Political<br />
Status<br />
Participation<br />
of women<br />
<strong>in</strong> national<br />
government<br />
(% seats held<br />
by women)<br />
Under-5<br />
mortality<br />
rate<br />
(per 1,<strong>000</strong><br />
live births)<br />
Percent of<br />
children under<br />
5 moderately<br />
or severely<br />
underweight<br />
for age<br />
<strong>Children</strong>’s Status SOWM 2012<br />
Gross<br />
primary<br />
enrollment<br />
ratio<br />
(% of total)<br />
Ratio of<br />
girls to boys<br />
enrolled <strong>in</strong><br />
primary<br />
school<br />
Percent of<br />
population<br />
with access<br />
to safe<br />
dr<strong>in</strong>k<strong>in</strong>g water<br />
2008 2010 2010 2010 2011 2007 2011 2010 2010 2011 2011 2010<br />
Afghanistan 11 24 16 49 6 0.24 28 149 33 97 0.69 50 41 41 41<br />
Angola 29 47 5 53 9 0.64 38 161 16 124 0.81 51 20 15 33<br />
Bangladesh 110 27 48 70 8 (y) 0.51 20 48 41 95 (z) 1.04 (z)<br />
81 16 16 13<br />
Ben<strong>in</strong> 43 74 6 59 7 0.52 8 115 18 126 0.87 75 26 28 17<br />
Bhutan 170 65 31 70 12 0.39 14 56 13 111 1.01 96 2 7 1<br />
Burk<strong>in</strong>a Faso 28 54 13 57 6 0.66 15 176 26 79 0.93 79 29 27 28<br />
Burundi 25 60 8 53 11 0.77 35 142 29 156 0.99 72 8 2 24<br />
Cambodia 110 71 27 65 10 0.68 18 51 28 127 0.95 64 6 3 13<br />
Central African Republic 27 44 9 51 5 0.59 13 159 24 93 0.71 67 32 33 34<br />
Chad 14 23 2 52 6 0.70 13 173 30 90 0.73 51 36 31 42<br />
Comoros 71 62 19 63 9 0.58 3 86 25 (z) 104 0.92 95 14 17 5<br />
Congo, Democratic Republic of <strong>the</strong> 24 74 6 51 7 0.46 5 (iii) 170 24 94 0.87 45 33 32 40<br />
Djibouti 93 93 17 60 5 0.57 14 91 23 59 0.90 88 23 24 18<br />
Equatorial Gu<strong>in</strong>ea 73 65 6 53 7 0.36 10 121 19 (z) 87 0.97 43 (z) 31 34 27<br />
Eritrea 72 28 5 64 4 0.50 22 61 35 45 0.84 61 (z) 37 36 37<br />
Ethiopia 40 6 14 62 8 0.67 26 106 33 102 0.91 44 25 20 32<br />
Gambia 49 57 13 60 8 0.63 8 98 18 83 1.02 89 19 19 6<br />
Gu<strong>in</strong>ea 26 46 4 56 7 0.68 — (vii) 130 21 94 0.84 74 28 25 22<br />
Gu<strong>in</strong>ea-Bissau 18 44 6 50 5 0.46 10 150 18 123 0.94 64 39 40 26<br />
Haiti 93 26 24 64 –– 0.37 4 165 18 111 (z) 0.98 (z) 69 — — 23<br />
Lao People’s Democratic Republic 49 20 29 69 9 0.76 25 54 31 121 0.90 67 11 11 20<br />
Lesotho 62 62 46 48 10 0.73 24 85 13 103 0.98 78 4 6 4<br />
Liberia 20 46 10 59 9 0.50 11 103 15 96 0.91 73 22 25 11<br />
Madagascar 45 44 28 69 10 0.71 12 62 42 (z) 149 0.98 46 15 8 35<br />
Malawi 36 54 38 55 10 0.74 22 92 13 135 1.04 83 3 4 3<br />
Mali 22 49 6 53 6 0.44 10 178 27 82 0.88 64 38 35 38<br />
Mauritania 41 61 8 61 8 0.58 19 111 15 102 1.05 50 21 21 20<br />
Mozambique 37 55 12 52 8 0.90 39 135 18 115 0.90 47 10 5 29<br />
Myanmar 180 64 38 68 10 0.61 3 66 23 126 1.00 83 7 10 9<br />
Nepal 80 19 44 70 8 0.61 33 50 39 115 0.86 89 12 14 16<br />
Niger 16 33 5 56 4 0.34 13 143 40 71 0.84 49 42 42 43<br />
Rwanda 35 69 26 57 11 0.79 52 91 11 143 1.02 65 1 1 7<br />
Senegal 46 52 10 61 8 0.55 30 75 14 87 1.06 72 18 21 8<br />
Sierra Leone 21 42 6 49 6 0.74 13 174 21 125 0.93 55 30 29 36<br />
Solomon Islands 230 70 27 70 9 0.51 0 27 12 109 0.97 70 (z) 9 13 2<br />
Somalia 14 33 1 53 2 –– 7 180 32 32 0.55 29 — — 44<br />
South Sudan ‡ 32 49 (y) 6 64 6 0.33 24 103 31 (z) 73 0.90 58 33 36 30<br />
Sudan ‡ 32 49 (y) 6 64 6 0.33 24 103 31 (z) 73 0.90 58 33 38 30<br />
Tanzania, United Republic of 23 49 26 60 5 (z) 0.74 36 76 16 102 1.02 53 17 18 12<br />
Timor-Leste 44 29 21 64 11 0.53 32 55 45 117 0.96 69 13 12 25<br />
Togo 67 60 11 59 9 0.45 11 103 17 140 0.90 61 24 23 19<br />
Uganda 35 42 18 55 11 0.69 35 99 16 121 1.01 72 5 8 10<br />
Yemen 91 36 19 68 7 0.25 1 77 43 87 0.82 55 40 39 39<br />
Zambia 38 47 27 50 7 (y) 0.56 12 111 15 115 1.01 61 27 30 13<br />
Mo<strong>the</strong>rs’<br />
Index Rank<br />
(out of 42<br />
countries) +<br />
Women’s<br />
Index Rank<br />
(out of 42<br />
countries) +<br />
<strong>Children</strong>’s<br />
Index Rank<br />
(out of 44<br />
countries) +
S av e t h e c h i l D r e N · S tat e o F t h e Wo r l D ’ S M ot h e r S 2 0 1 2 53<br />
MethoDology aND reSearch NoteS<br />
COMPLETE MOTHERS’ INDEx<br />
1. In <strong>the</strong> first year of <strong>the</strong> Mo<strong>the</strong>rs’ Index (2<strong>000</strong>), a review<br />
of literature and consultation with members of <strong>the</strong><br />
<strong>Save</strong> <strong>the</strong> <strong>Children</strong> staff identified health status, educational<br />
status, political status and children’s well-be<strong>in</strong>g as<br />
key factors related to <strong>the</strong> well-be<strong>in</strong>g of mo<strong>the</strong>rs. In 2007,<br />
<strong>the</strong> Mo<strong>the</strong>rs’ Index was revised to <strong>in</strong>clude <strong>in</strong>dicators of economic<br />
status. All countries with populations over 250,<strong>000</strong><br />
were placed <strong>in</strong>to one of three tiers accord<strong>in</strong>g to United<br />
Nations regional development groups: more developed<br />
countries, less developed countries and least developed<br />
countries. Indicators for each development group were<br />
selected to best represent factors of maternal well-be<strong>in</strong>g<br />
specific to that group, and published data sources for each<br />
<strong>in</strong>dicator were <strong>the</strong>n identified. To facilitate <strong>in</strong>ternational<br />
comparisons, <strong>in</strong> addition to reliability and validity, <strong>in</strong>dicators<br />
were selected based on <strong>in</strong>clusivity (availability across<br />
countries) and variability (ability to differentiate between<br />
countries). To adjust for variations <strong>in</strong> data availability,<br />
when calculat<strong>in</strong>g <strong>the</strong> f<strong>in</strong>al <strong>in</strong>dex, <strong>in</strong>dicators for maternal<br />
health and children’s well-be<strong>in</strong>g were grouped <strong>in</strong>to sub<strong>in</strong>dices<br />
(see step 7). This procedure allowed researchers to<br />
draw on <strong>the</strong> wealth of useful <strong>in</strong>formation on those topics<br />
without giv<strong>in</strong>g too little weight to <strong>the</strong> factors for which less<br />
abundant data were available. Data presented <strong>in</strong> this report<br />
<strong>in</strong>cludes <strong>in</strong>formation available through 01 April 2012.<br />
Sources: 2011 Population: United Nations Population Fund (UNFPA). The State of World Population<br />
2011. (New York: 2011); Classification of development regions: United Nations Population Division.<br />
World Population Prospects: The 2008 Revision. (New York: 2009)<br />
2. In Tier I, data were ga<strong>the</strong>red for seven <strong>in</strong>dicators of women’s<br />
status and three <strong>in</strong>dicators of children’s status. Sufficient<br />
data existed to <strong>in</strong>clude analyses of two additional <strong>in</strong>dicators<br />
of children’s well-be<strong>in</strong>g <strong>in</strong> Tiers II and III. Indicators unique<br />
to specific development groups are noted below.<br />
<strong>the</strong> <strong>in</strong>dicators that represent women’s<br />
health status are:<br />
Lifetime risk of maternal death<br />
A woman’s risk of death <strong>in</strong> childbirth is a function of<br />
many factors, <strong>in</strong>clud<strong>in</strong>g <strong>the</strong> number of children she has<br />
and <strong>the</strong> spac<strong>in</strong>g of births as well as <strong>the</strong> conditions under<br />
which she gives birth and her own health and nutritional<br />
status. The lifetime risk of maternal mortality is <strong>the</strong> probability<br />
that a 15-year-old female will die eventually from a<br />
maternal cause. This <strong>in</strong>dicator reflects not only <strong>the</strong> risk of<br />
maternal death per pregnancy or per birth, but also <strong>the</strong> level<br />
of fertility <strong>in</strong> <strong>the</strong> population. Compet<strong>in</strong>g causes of maternal<br />
death are also taken <strong>in</strong>to account. Estimates are periodically<br />
calculated by an <strong>in</strong>ter-agency group <strong>in</strong>clud<strong>in</strong>g WHO,<br />
UNICEF, UNFPA and <strong>the</strong> World Bank. Data are for 2008<br />
and represent <strong>the</strong> most recent of <strong>the</strong>se estimates available at<br />
<strong>the</strong> time of this analysis.<br />
Source: WHO, UNICEF, UNFPA and <strong>the</strong> World Bank. Trends <strong>in</strong> Maternal Mortality: 1990 to 2008.<br />
(Geneva: 2010) Available onl<strong>in</strong>e at: whqlibdoc.who.<strong>in</strong>t/publications/2010/9789241500265_eng.pdf<br />
Percent of women us<strong>in</strong>g modern contraception<br />
Access to family plann<strong>in</strong>g resources, <strong>in</strong>clud<strong>in</strong>g modern<br />
contraception, allows women to plan <strong>the</strong>ir pregnancies.<br />
This helps ensure that a mo<strong>the</strong>r is physically and psychologically<br />
prepared to give birth and care for her child.<br />
Data are derived from sample survey reports and estimate<br />
<strong>the</strong> proportion of married women (<strong>in</strong>clud<strong>in</strong>g women<br />
<strong>in</strong> consensual unions) currently us<strong>in</strong>g modern methods<br />
of contraception, which <strong>in</strong>clude: male and female sterilization,<br />
IUD, <strong>the</strong> pill, <strong>in</strong>jectables, hormonal implants,<br />
condoms and female barrier methods. Contraceptive prevalence<br />
data are <strong>the</strong> most recent available as of April 2011.<br />
Source: United Nations Population Division. World Contraceptive Use 2011. Available onl<strong>in</strong>e at: un.org/<br />
esa/population/publications/contraceptive2011/contraceptive2011.htm<br />
Skilled attendant at delivery<br />
The presence of a skilled attendant at birth reduces<br />
<strong>the</strong> likelihood of both maternal and <strong>in</strong>fant mortality. The<br />
attendant can help create a hygienic environment and<br />
recognize complications that require urgent medical care.<br />
Skilled attendance at delivery is def<strong>in</strong>ed as those births<br />
attended by physicians, nurses or midwives. Data are from<br />
2006-2010. As nearly every birth is attended <strong>in</strong> <strong>the</strong> more<br />
developed countries, this <strong>in</strong>dicator is not <strong>in</strong>cluded <strong>in</strong> Tier I.<br />
Source: United Nations <strong>Children</strong>’s Fund (UNICEF). The State of <strong>the</strong> World’s <strong>Children</strong> 2012. (New<br />
York: 2012) Table 8, pp.116-119 Available onl<strong>in</strong>e at: unicef.org/sowc2012/pdfs/SOWC-2012-TABLE-<br />
8-WOMEN.pdf<br />
Female life expectancy<br />
<strong>Children</strong> benefit when mo<strong>the</strong>rs live longer, healthier<br />
lives. Life expectancy reflects <strong>the</strong> health, social and economic<br />
status of a mo<strong>the</strong>r and captures trends <strong>in</strong> fall<strong>in</strong>g<br />
life expectancy associated with <strong>the</strong> fem<strong>in</strong>ization of HIV<br />
and AIDS. Female life expectancy is def<strong>in</strong>ed as <strong>the</strong> average<br />
number of years of life that a female can expect to live if she<br />
experiences <strong>the</strong> current mortality rate of <strong>the</strong> population at<br />
each age. Data estimates are for 2010-2015.<br />
Source: UNFPA. The State of World Population 2011. (New York: 2011) pp. 116-120. Available onl<strong>in</strong>e<br />
at: unfpa.org/swp/
54 MethoDology aND reSearch NoteS<br />
The <strong>in</strong>dicator that represents women’s<br />
educational status is:<br />
Expected number of years of formal female school<strong>in</strong>g<br />
Education is s<strong>in</strong>gularly effective <strong>in</strong> enhanc<strong>in</strong>g maternal<br />
health, women’s freedom of movement and decision-mak<strong>in</strong>g<br />
power with<strong>in</strong> households. Educated women are more<br />
likely to be able to earn a livelihood and support <strong>the</strong>ir<br />
families. They are also more likely than uneducated women<br />
to ensure that <strong>the</strong>ir children eat well, f<strong>in</strong>ish school and<br />
receive adequate health care. Female school life expectancy<br />
is def<strong>in</strong>ed as <strong>the</strong> number of years a female child of school<br />
entrance age is expected to spend at school or university,<br />
<strong>in</strong>clud<strong>in</strong>g years spent on repetition. It is <strong>the</strong> sum of <strong>the</strong><br />
age-specific enrollment ratios for primary, secondary, postsecondary<br />
non-tertiary and tertiary education. Primary to<br />
secondary estimates are used where primary to tertiary<br />
are not available. Data are from 2011 or <strong>the</strong> most recent<br />
year available.<br />
Sources: UNESCO Institute for Statistics (UIS). Data Centre. stats.uis.unesco.org, supplemented with<br />
data from UNESCO. Global Education Digest 2011. (Montreal: 2011) Table 14, pp.216-225. Available<br />
onl<strong>in</strong>e at: uis.unesco.org/Education/Documents/ged-2011-en.pdf<br />
The <strong>in</strong>dicators that represent women’s<br />
economic status are:<br />
Ratio of estimated female to male earned <strong>in</strong>come<br />
Mo<strong>the</strong>rs are likely to use <strong>the</strong>ir <strong>in</strong>fluence and <strong>the</strong> resources<br />
<strong>the</strong>y control to promote <strong>the</strong> needs of <strong>the</strong>ir children.<br />
Where mo<strong>the</strong>rs are able to earn a decent standard of liv<strong>in</strong>g<br />
and wield power over economic resources, children survive<br />
and thrive. The ratio of estimated female earned <strong>in</strong>come to<br />
estimated male earned <strong>in</strong>come – how much women earn<br />
relative to men for equal work – reveals gender <strong>in</strong>equality<br />
<strong>in</strong> <strong>the</strong> workplace. Female and male earned <strong>in</strong>come are<br />
crudely estimated based on <strong>the</strong> ratio of <strong>the</strong> female nonagricultural<br />
wage to <strong>the</strong> male nonagricultural wage, <strong>the</strong> female<br />
and male shares of <strong>the</strong> economically active population, <strong>the</strong><br />
total female and male population, and GDP per capita <strong>in</strong><br />
purchas<strong>in</strong>g power parity terms <strong>in</strong> US dollars. Estimates are<br />
based on data for <strong>the</strong> most recent year available between<br />
1996 and 2007.<br />
Source: United Nations Development Programme (UNDP). Human Development Report 2009.<br />
(New York: 2009) Table K, pp.186-189. Available onl<strong>in</strong>e at: hdrstats.undp.org/en/<strong>in</strong>dicators/130.html<br />
Maternity leave benefits<br />
The maternity leave <strong>in</strong>dicator <strong>in</strong>cludes both <strong>the</strong> length<br />
of time for which benefits are provided and <strong>the</strong> extent of<br />
compensation. The data are compiled by <strong>the</strong> International<br />
Labour Office and <strong>the</strong> United States Social Security<br />
Adm<strong>in</strong>istration from a variety of legislative and non-legislative<br />
sources as of December 2011. Where parental leave<br />
entitlements are paid at <strong>the</strong> same level, <strong>the</strong> total length of<br />
leave available to mo<strong>the</strong>rs is reported. Data on maternity<br />
leave benefits are reported for only Tier I countries, where<br />
women comprise a considerable share of <strong>the</strong> non-agricul-<br />
tural workforce and thus most work<strong>in</strong>g mo<strong>the</strong>rs are free to<br />
enjoy <strong>the</strong> benefits of maternity leave.<br />
Sources: ILO Database on Conditions of Work and Employment Laws, ilo.org/dyn/travail/travma<strong>in</strong>.home;<br />
United Nations Statistics Division. Statistics and Indicators on Women and Men. Table 5g. Updated<br />
December 2011. Available onl<strong>in</strong>e at: unstats.un.org/unsd/demographic/products/<strong>in</strong>dwm/<br />
The <strong>in</strong>dicator that represents women’s<br />
political status is:<br />
Participation of women <strong>in</strong> national government<br />
When women have a voice <strong>in</strong> public <strong>in</strong>stitutions, <strong>the</strong>y<br />
can participate directly <strong>in</strong> governance processes and advocate<br />
for issues of particular importance to women and<br />
children. This <strong>in</strong>dicator represents <strong>the</strong> percentage of seats<br />
occupied by women <strong>in</strong> s<strong>in</strong>gle or, <strong>in</strong> <strong>the</strong> case of bicameral<br />
legislatures, upper and lower houses of national parliaments.<br />
Data are as of 31 December 2011.<br />
Source: Inter-Parliamentary Union (IPU). Women <strong>in</strong> National Parliaments. Available onl<strong>in</strong>e at:<br />
ipu.org/wmn-e/classif.htm<br />
The <strong>in</strong>dicators that represent children’s<br />
well-be<strong>in</strong>g are:<br />
Under-5 mortality rate<br />
Under-five mortality rates are likely to <strong>in</strong>crease dramatically<br />
when mo<strong>the</strong>rs receive little or no prenatal care and<br />
give birth under difficult circumstances, when <strong>in</strong>fants are<br />
not exclusively breastfed, when few children are immunized<br />
and when fewer receive preventive or curative treatment<br />
for common childhood diseases. Under-five mortality rate<br />
is <strong>the</strong> probability of dy<strong>in</strong>g between birth and exactly five<br />
years of age, expressed per 1,<strong>000</strong> live births. Estimates are<br />
for 2010.<br />
Source: UNICEF. The State of <strong>the</strong> World’s <strong>Children</strong> 2012. (New York: 2012) Table 1, pp.88-91 Available<br />
onl<strong>in</strong>e at: unicef.org/sowc2012/pdfs/SOWC-2012-TABLE-1-BASIC-INDICATORS.pdf<br />
Percentage of children under age 5 moderately or<br />
severely underweight<br />
Poor nutrition affects children <strong>in</strong> many ways, <strong>in</strong>clud<strong>in</strong>g<br />
mak<strong>in</strong>g <strong>the</strong>m more susceptible to a variety of illnesses<br />
and impair<strong>in</strong>g <strong>the</strong>ir physical and cognitive development.<br />
<strong>Children</strong> moderately or severely underweight are more than<br />
two and three standard deviations below median weightfor-age<br />
of <strong>the</strong> WHO Child Growth Standards respectively.<br />
Data are for <strong>the</strong> most recent year available between 2006<br />
and 2010. Where WHO data are not available, estimates<br />
based on <strong>the</strong> NCHS/WHO reference population are used.<br />
Please note that <strong>in</strong> years past NCHS/WHO data were <strong>the</strong><br />
primary source; <strong>the</strong>se estimates are no longer reported. Due<br />
to this change, <strong>the</strong>se underweight data are not comparable<br />
to estimates <strong>in</strong>cluded <strong>in</strong> previous editions of <strong>the</strong> Mo<strong>the</strong>rs’<br />
Index. This <strong>in</strong>dicator is <strong>in</strong>cluded <strong>in</strong> Tier II and Tier III<br />
only, as few more developed countries have available data.<br />
Source: UNICEF. The State of <strong>the</strong> World’s <strong>Children</strong> 2012. (New York: 2012) Table 2, pp.92-95 Available<br />
onl<strong>in</strong>e at: unicef.org/sowc2012/pdfs/SOWC-2012-TABLE-2-NUTRITION.pdf
S av e t h e c h i l D r e N · S tat e o F t h e Wo r l D ’ S M ot h e r S 2 0 1 2 55<br />
Gross pre-primary enrollment ratio<br />
Early childhood care and education, <strong>in</strong>clud<strong>in</strong>g pre-primary<br />
school<strong>in</strong>g, supports children’s growth, development,<br />
learn<strong>in</strong>g and survival. It also contributes to proper health<br />
and poverty reduction and can provide essential support<br />
for work<strong>in</strong>g parents, particularly mo<strong>the</strong>rs. The pre-primary<br />
gross enrollment ratio is <strong>the</strong> total number of children<br />
enrolled <strong>in</strong> pre-primary education, regardless of age,<br />
expressed as a percentage of <strong>the</strong> total number of children<br />
of official pre-primary school age. The ratio can be higher<br />
than 100 percent when children enter school later than<br />
<strong>the</strong> official enrollment age or do not advance through<br />
<strong>the</strong> grades at expected rates. Data are for <strong>the</strong> school year<br />
end<strong>in</strong>g <strong>in</strong> 2011 or <strong>the</strong> most recently available. Pre-primary<br />
enrollment is analyzed across Tier I countries only.<br />
Source: UNESCO Institute for Statistics (UIS). Data Centre. stats.uis.unesco.org<br />
Gross primary enrollment ratio<br />
The gross primary enrollment ratio (GER) is <strong>the</strong> total<br />
number of children enrolled <strong>in</strong> primary school, regardless<br />
of age, expressed as a percentage of <strong>the</strong> total number of<br />
children of official primary school age. Where GERs are<br />
not available, net attendance ratios are used. Data are for<br />
<strong>the</strong> school year end<strong>in</strong>g <strong>in</strong> 2011 or <strong>the</strong> most recently available.<br />
This <strong>in</strong>dicator is not tracked <strong>in</strong> Tier I, where nearly<br />
all children complete primary school.<br />
Sources: UNESCO Institute for Statistics (UIS). Data Centre. stats.uis.unesco.org, supplemented with<br />
data from UNESCO. Global Education Digest 2011. (Montreal: 2011) Table 3, pp.112-121. Available onl<strong>in</strong>e<br />
at: uis.unesco.org/Education/Documents/ged-2011-en.pdf and UNICEF. Primary school enrolment<br />
(updated Jan 2012), child<strong>in</strong>fo.org/education_enrolment.php<br />
Gender parity <strong>in</strong>dex<br />
Educat<strong>in</strong>g girls is one of <strong>the</strong> most effective means of<br />
improv<strong>in</strong>g <strong>the</strong> well-be<strong>in</strong>g of women and children. The ratio<br />
of gross enrollment of girls to boys <strong>in</strong> primary school – or<br />
Gender Parity Index (GPI) – measures gender disparities <strong>in</strong><br />
primary school participation. It is calculated as <strong>the</strong> number<br />
of girls enrolled <strong>in</strong> primary school for every 100 enrolled<br />
boys, regardless of age. A score of 1 means equal numbers<br />
of girls and boys are enrolled; a score between 0 and 1<br />
<strong>in</strong>dicates a disparity <strong>in</strong> favor of boys; a score greater than<br />
1 <strong>in</strong>dicates a disparity <strong>in</strong> favor of girls. Where GERs are<br />
not available, net attendance ratios are used to calculate<br />
<strong>the</strong> GPI. Data are for <strong>the</strong> school year end<strong>in</strong>g <strong>in</strong> 2011 or <strong>the</strong><br />
most recently available. GPI is <strong>in</strong>cluded <strong>in</strong> Tier III, where<br />
gender equity gaps disadvantag<strong>in</strong>g girls <strong>in</strong> access to education<br />
are <strong>the</strong> largest <strong>in</strong> <strong>the</strong> world.<br />
Source: UNESCO Institute for Statistics (UIS). Data Centre. stats.uis.unesco.org, supplemented with<br />
data from UNESCO. Global Education Digest 2011. (Montreal: 2011) Table 3, pp.112-121. Available onl<strong>in</strong>e<br />
at: uis.unesco.org/Education/Documents/ged-2011-en.pdf<br />
Gross secondary enrollment ratio<br />
The gross secondary enrollment ratio is <strong>the</strong> total number<br />
of children enrolled <strong>in</strong> secondary school, regardless of age,<br />
expressed as a percentage of <strong>the</strong> total number of children of<br />
official secondary school age. Data are for <strong>the</strong> school year<br />
end<strong>in</strong>g <strong>in</strong> 2011 or <strong>the</strong> most recently available. This <strong>in</strong>dicator<br />
is not tracked <strong>in</strong> Tier III where many children still do not<br />
attend primary school, let alone transition to higher levels.<br />
Sources: UNESCO Institute for Statistics (UIS). Data Centre. stats.uis.unesco.org, supplemented with<br />
data from UNICEF. Secondary School Participation (updated Jan 2012), child<strong>in</strong>fo.org/education_secondary.php<br />
Percent of population with access to safe water<br />
Safe water is essential to good health. Families need an<br />
adequate supply for dr<strong>in</strong>k<strong>in</strong>g as well as cook<strong>in</strong>g and wash<strong>in</strong>g.<br />
Access to safe and affordable water also br<strong>in</strong>gs ga<strong>in</strong>s for<br />
gender equity, especially <strong>in</strong> rural areas where women and<br />
young girls spend considerable time collect<strong>in</strong>g water. This<br />
<strong>in</strong>dicator reports <strong>the</strong> percentage of <strong>the</strong> population with<br />
access to an adequate amount of water from an improved<br />
source with<strong>in</strong> a convenient distance from a user’s dwell<strong>in</strong>g,<br />
as def<strong>in</strong>ed by country-level standards. “Improved” water<br />
sources <strong>in</strong>clude household connections, public standpipes,<br />
boreholes, protected dug wells, protected spr<strong>in</strong>gs and ra<strong>in</strong>water<br />
collection. In general, “reasonable access” is def<strong>in</strong>ed<br />
as at least 20 liters (5.3 gallons) per person per day, from<br />
a source with<strong>in</strong> one kilometer (0.62 miles) of <strong>the</strong> user’s<br />
dwell<strong>in</strong>g. Data are for 2010.<br />
Source: WHO/UNICEF Jo<strong>in</strong>t Monitor<strong>in</strong>g Programme for Water Supply and Sanitation. Progress on<br />
Dr<strong>in</strong>k<strong>in</strong>g Water and Sanitation - 2012 Update. (UNICEF and WHO: New York: 2012) Available onl<strong>in</strong>e<br />
at: child<strong>in</strong>fo.org/files/JMPreport2012.pdf , supplemented with data from UNICEF. The State of <strong>the</strong><br />
World’s <strong>Children</strong> 2012. (New York: 2012) Table 3, pp.96-99 Available onl<strong>in</strong>e at: unicef.org/sowc2012/<br />
pdfs/SOWC-2012-TABLE-3-HEALTH.pdf<br />
3. Miss<strong>in</strong>g data were supplemented when possible with<br />
data from <strong>the</strong> same source published <strong>in</strong> a previous year, as<br />
noted <strong>in</strong> <strong>the</strong> fold-out table <strong>in</strong> this appendix.<br />
4. Data po<strong>in</strong>ts expressed as percentages were rounded to<br />
<strong>the</strong> nearest tenth of one percent for analysis purposes. Data<br />
analysis was conducted us<strong>in</strong>g Microsoft Excel software.<br />
5. Standard scores, or Z-scores, were created for each of <strong>the</strong><br />
<strong>in</strong>dicators us<strong>in</strong>g <strong>the</strong> follow<strong>in</strong>g formula: z = (x-x-)/s where:<br />
z = The standard, or z-score<br />
x = The score to be converted<br />
x- = The mean of <strong>the</strong> distribution<br />
s = The standard deviation of <strong>the</strong> distribution<br />
6. The standard scores of <strong>in</strong>dicators of ill-be<strong>in</strong>g were <strong>the</strong>n<br />
multiplied by (-1) so that a higher score <strong>in</strong>dicated <strong>in</strong>creased<br />
well-be<strong>in</strong>g on all <strong>in</strong>dicators.<br />
Notes on specific <strong>in</strong>dicators<br />
• To facilitate cross-country comparisons, length of<br />
maternity leave was converted <strong>in</strong>to days and allowances<br />
were averaged over <strong>the</strong> entire pay period.<br />
• To report f<strong>in</strong>d<strong>in</strong>gs for <strong>the</strong> greatest number of countries<br />
possible, countries without a parliament, or where it<br />
has been dissolved, suspended or o<strong>the</strong>rwise unable to<br />
meet, are given a “0” for political representation when<br />
calculat<strong>in</strong>g <strong>in</strong>dex scores.
56 MethoDology aND reSearch NoteS<br />
• To avoid reward<strong>in</strong>g school systems where pupils do<br />
not start on time or fail to progress through <strong>the</strong> system<br />
at expected rates, gross enrollment ratios between<br />
100 and 105 percent were discounted to 100 percent.<br />
Gross enrollment ratios over 105 percent were ei<strong>the</strong>r<br />
discounted to 100 with any amount over 105 percent<br />
subtracted from 100 (for example, a country with a<br />
gross enrollment rate of 107 percent would be discounted<br />
to 100-(107-105), or 98) or <strong>the</strong> respective country’s<br />
net enrollment ratio, whichever was higher.<br />
• To avoid reward<strong>in</strong>g countries <strong>in</strong> which girls’ educational<br />
progress is made at <strong>the</strong> expense of boys’, countries with<br />
gender parity <strong>in</strong>dices greater than 1.02 (an <strong>in</strong>dication<br />
of gender <strong>in</strong>equity disfavor<strong>in</strong>g boys) were discounted<br />
to 1.00 with any amount over 1.02 <strong>the</strong>n subtracted<br />
from 1.00.<br />
7. The z-scores of <strong>the</strong> four <strong>in</strong>dicators related to women’s<br />
health were averaged to create an <strong>in</strong>dex score of women’s<br />
health status. In Tier I, an <strong>in</strong>dex score of women’s economic<br />
status was similarly calculated as a weighted average<br />
of <strong>the</strong> ratio of female to male earned <strong>in</strong>come (75 percent),<br />
length of maternity leave (12.5 percent) and percent of<br />
wages paid (12.5 percent). An <strong>in</strong>dex of child well-be<strong>in</strong>g-<br />
<strong>the</strong> <strong>Children</strong>’s Index- was also created by first averag<strong>in</strong>g<br />
<strong>in</strong>dicators of education, <strong>the</strong>n averag<strong>in</strong>g across all z-scores.<br />
At this stage, cases (countries) miss<strong>in</strong>g more than one <strong>in</strong>dicator<br />
on ei<strong>the</strong>r <strong>in</strong>dex were elim<strong>in</strong>ated from <strong>the</strong> sample.<br />
Countries miss<strong>in</strong>g any one of <strong>the</strong> o<strong>the</strong>r <strong>in</strong>dicators (that is<br />
educational, economic or political status) were also elim<strong>in</strong>ated.<br />
A Women’s Index was <strong>the</strong>n calculated as a weighted<br />
average of health status (30 percent), educational status<br />
(30 percent), economic status (30 percent) and political<br />
status (10 percent).<br />
8. The Mo<strong>the</strong>rs’ Index was calculated as a weighted average<br />
of children’s well-be<strong>in</strong>g (30 percent), women’s health<br />
status (20 percent), women’s educational status (20 percent),<br />
women’s economic status (20), and women’s political<br />
status (10 percent). The scores on <strong>the</strong> Mo<strong>the</strong>rs’ Index were<br />
<strong>the</strong>n ranked.<br />
NOTE: Data exclusive to mo<strong>the</strong>rs are not available for<br />
many important <strong>in</strong>dicators (school life expectancy and government<br />
positions held, for example). In <strong>the</strong>se <strong>in</strong>stances,<br />
data on women’s status have been used to approximate<br />
maternal status, s<strong>in</strong>ce all mo<strong>the</strong>rs are women. In areas such<br />
as health, where a broader array of <strong>in</strong>dicators is available,<br />
<strong>the</strong> <strong>in</strong>dex emphasizes <strong>in</strong>dicators that address uniquely<br />
maternal issues.<br />
STUNTING TREND ANALYSIS<br />
The analysis of country progress <strong>in</strong> reduc<strong>in</strong>g child stunt<strong>in</strong>g<br />
was done by calculat<strong>in</strong>g <strong>the</strong> average annual rate of reduction<br />
(AARR)163 from about 1990 to 2010, or <strong>the</strong> most recent<br />
year available. Where data for 1990 was absent, <strong>the</strong> closest<br />
data po<strong>in</strong>t was used. When two po<strong>in</strong>ts were equidistant,<br />
<strong>the</strong> earlier basel<strong>in</strong>e was used to more closely approximate<br />
a 20-year time period. Trend data was available for 71 of 75<br />
Countdown priority countries, <strong>in</strong>clud<strong>in</strong>g Sudan pre-cession.<br />
Countries mak<strong>in</strong>g <strong>the</strong> Fastest and<br />
slowest ga<strong>in</strong>s aga<strong>in</strong>st Child malnutrition<br />
% children<br />
under-5 stunted<br />
average annual rate<br />
of reduction<br />
coUNtry BaSeliNe eNDliNe yearS %<br />
1 Uzbekistan 39 20 1996-2006 6.7%<br />
2 angola 62 29 1996-2007 6.6%<br />
3 ch<strong>in</strong>a 32 9 1990-2010 6.3%<br />
3 Kyrgyzstan 33 18 1997-2006 6.3%<br />
3 turkmenistan 28 19 2<strong>000</strong>-2006 6.3%<br />
6 Dpr Korea 64 32 1998-2009 5.6%<br />
7 Brazil 19 7 1989-2007 5.5%<br />
8 Mauritania 55 23 1990-2010 4.6%<br />
9 eritrea 70 44 1993-2002 4.4%<br />
10 vietnam 61 23 1989-2010 4.3%<br />
11 Mexico 26 16 1989-2006 3.1%<br />
12 Bangladesh 63 41 1990-2011 2.9%<br />
13 <strong>in</strong>donesia 48 40 1995-2007 2.6%<br />
13 Nepal 65 41 1995-2010 2.6%<br />
15 cambodia 59 41 1996-2011 2.5%<br />
57 Sierra leone 41 37 1990-2008 0.0%<br />
58 Niger 48 47 1992-2010 -0.2%<br />
59 Djibouti 28 31 1989-2010 -0.4%<br />
60 Burundi 52 58 1987-2010 -0.5%<br />
60 lesotho 39 39 1992-2009 -0.5%<br />
60 Zimbabwe 31 32 1988-2011 -0.5%<br />
63 gu<strong>in</strong>ea 35 40 1995-2008 -0.8%<br />
64 Mali 33 39 1987-2006 -0.9%<br />
65 yemen 52 58 1992-2003 -1.0%<br />
66 central african<br />
republic<br />
40 43 1995-2006 -1.4%<br />
67 afghanistan 53 59 1997-2004 -1.6%<br />
68 comoros 39 47 1992-2<strong>000</strong> -2.3%<br />
69 Ben<strong>in</strong> 35 45 1996-2006 -2.6%<br />
69 côte d’ivoire 23 39 1986-2007 -2.6%<br />
71 Somalia 29 42 2<strong>000</strong>-2006 -6.3%<br />
—<br />
Note: <strong>the</strong>se results differ considerably from those published previously by <strong>Save</strong> <strong>the</strong> children<br />
<strong>in</strong> A Life Free From Hunger (2012). <strong>the</strong> reasons for <strong>the</strong>se differences <strong>in</strong>clude: <strong>the</strong> use of<br />
more recent DhS and MicS data, and <strong>in</strong> some cases, pre-1990 data po<strong>in</strong>ts to more closely<br />
approximate 20 years of change. this analysis was also limited to just <strong>the</strong> 75 Countdown<br />
priority countries for maternal, newborn and child survival.
S av e t h e c h i l D r e N · S tat e o F t h e Wo r l D ’ S M ot h e r S 2 0 1 2 57<br />
Basel<strong>in</strong>e and endl<strong>in</strong>e years and prevalence estimates are<br />
shown here. For complete trend data see sources: WHO<br />
Global Database on Child Growth and Malnutrition (who.<br />
<strong>in</strong>t/nutgrowthdb/); UNICEF (child<strong>in</strong>fo.org); Countdown<br />
INFANT AND TODDLER FEEDING<br />
SCORECARD<br />
Four key <strong>in</strong>fant and young child feed<strong>in</strong>g (IYCF) <strong>in</strong>dicators<br />
were selected for analysis: early <strong>in</strong>itiation of breastfeed<strong>in</strong>g,<br />
exclusive breastfeed<strong>in</strong>g, complementary feed<strong>in</strong>g and<br />
breastfeed<strong>in</strong>g at age 2. These practices were chosen because<br />
<strong>the</strong>y are those most often identified with “optimal” feed<strong>in</strong>g<br />
<strong>in</strong> <strong>the</strong> literature,164 had <strong>the</strong> largest data set of available<br />
IYCF <strong>in</strong>dicators and span <strong>the</strong> cont<strong>in</strong>uum of feed<strong>in</strong>g <strong>in</strong> a<br />
child’s first 1,<strong>000</strong> days.<br />
This analysis was done by compar<strong>in</strong>g current coverage<br />
of <strong>the</strong>se four <strong>in</strong>terventions aga<strong>in</strong>st levels of achievement<br />
established by WHO <strong>in</strong> 2003.165 Achievement thresholds<br />
for breastfeed<strong>in</strong>g at age 2 were not available and so were<br />
estimated by apply<strong>in</strong>g <strong>the</strong> same methodology used by <strong>the</strong><br />
WHO to 2002 data published <strong>in</strong> UNICEF’s The State<br />
of <strong>the</strong> World’s <strong>Children</strong> 2005. As summarized <strong>in</strong> <strong>the</strong> table<br />
below, coverage levels were rated <strong>in</strong> accordance with WHO<br />
iyCF <strong>in</strong>dicator Rat<strong>in</strong>gs and scores<br />
ratiNg Score early iNitiatioN<br />
oF BreaStFeeDiNg<br />
exclUSive<br />
BreaStFeeDiNg<br />
coMpleMeNtary<br />
FeeDiNg<br />
to 2015. Accountability for Maternal, Newborn & Child<br />
Survival: An update on progress <strong>in</strong> priority countries. (WHO:<br />
2012); and recent DHS and MICS surveys (as of April 2012).<br />
BreaStFeeDiNg<br />
at age 2<br />
State oF policy SUpport For <strong>the</strong> coDe<br />
very good 10 90-100% 90-100% 95-100% 90-100% Category 1<br />
(all or nearly all provisions law)<br />
good 9 50-89% 50-89% 80-94% 60-90% Categories 2-3<br />
(Many provisions law; few provisions law)<br />
Fair 6 30-49% 12-49% 60-79% 30-59% Categories 4-6<br />
(voluntary code or policy; some provisions<br />
<strong>in</strong> o<strong>the</strong>r laws; some provisions voluntary)<br />
poor 3 0-29% 0-11% 0-59% 0-29% Categories 7-9<br />
(Mesure drafted; be<strong>in</strong>g studied; no action)<br />
—<br />
Note: For <strong>in</strong>dicator def<strong>in</strong>itions and data sources, see <strong>the</strong> Infant and Toddler Feed<strong>in</strong>g Scorecard, page 31<br />
Mozambique<br />
methodology, and <strong>the</strong>n scored on a scale of 1 to 10. This<br />
scor<strong>in</strong>g scheme was adapted from BPNI/ IBFAN-Asia’s<br />
World Breastfeed<strong>in</strong>g Trends Initiative (WBTi)166 assessment<br />
tool. Scores were <strong>the</strong>n averaged across <strong>in</strong>dicators and<br />
an overall performance rat<strong>in</strong>g was assigned: 3-4 = poor; 5-6<br />
= fair; 7-8 = good; ≥ 9 = very good. In order to receive a<br />
“very good” overall, countries had to have “good” or better<br />
levels of coverage across all <strong>in</strong>dicators. Apart from <strong>the</strong>se<br />
top-performers, any country with <strong>the</strong> same rat<strong>in</strong>g on 3<br />
out of 4 <strong>in</strong>dicators was automatically assigned that same<br />
rat<strong>in</strong>g overall.<br />
This analysis was limited to 2012 Countdown countries167<br />
with latest available data from 2<strong>000</strong>-2011 for at least<br />
3 out of <strong>the</strong> 4 early feed<strong>in</strong>g <strong>in</strong>dicators exam<strong>in</strong>ed. Data was<br />
sufficient to present f<strong>in</strong>d<strong>in</strong>gs for 73 of 75 priority countries,<br />
<strong>in</strong>clud<strong>in</strong>g Sudan pre-cession.
58 MethoDology aND reSearch NoteS<br />
BREASTFEEDING POLICY SCORECARD<br />
The Breastfeed<strong>in</strong>g Policy Scorecard exam<strong>in</strong>es <strong>in</strong>formation<br />
about <strong>the</strong> supportive nature of <strong>the</strong> environment for<br />
breastfeed<strong>in</strong>g <strong>in</strong> <strong>in</strong>dustrialized countries.168 The follow<strong>in</strong>g<br />
set of policy-related <strong>in</strong>dicators were <strong>in</strong>cluded <strong>in</strong> <strong>the</strong> analysis:<br />
duration and wage replacement of paid leave available<br />
for mo<strong>the</strong>rs (which <strong>in</strong>cludes maternity and parental leave,<br />
where available), daily length of breastfeed<strong>in</strong>g breaks and<br />
length of breastfeed<strong>in</strong>g break coverage, <strong>the</strong> percentage of<br />
hospitals and maternities that have been designated babyfriendly<br />
and <strong>the</strong> state of policy support for <strong>the</strong> International<br />
Code of <strong>the</strong> Market<strong>in</strong>g of Breast-milk Substitutes (aka<br />
<strong>the</strong> Code).<br />
Country performance on each <strong>in</strong>dicator was rated and<br />
scored <strong>in</strong> accordance with <strong>the</strong> achievement levels outl<strong>in</strong>ed<br />
<strong>in</strong> <strong>the</strong> table below. Achievement levels for paid leave and<br />
breastfeed<strong>in</strong>g breaks were established by <strong>the</strong> World Legal<br />
Rights Data Centre: Adult Labour Database. Please note<br />
that although country placement accord<strong>in</strong>g to <strong>the</strong>se categories<br />
was publicly available for <strong>the</strong>se <strong>in</strong>dicators, <strong>the</strong> raw<br />
data (i.e. <strong>the</strong> total length of paid leave available to mo<strong>the</strong>rs<br />
and <strong>the</strong> wage replacement over that period of paid leave)<br />
were not. Information on maternity leave was presented<br />
<strong>in</strong>stead <strong>in</strong> <strong>the</strong> table to illustrate <strong>the</strong> variation <strong>in</strong> protection<br />
policies across countries, even though countries are scored<br />
and rated accord<strong>in</strong>g to <strong>the</strong> entire length of paid leave available<br />
to mo<strong>the</strong>rs. Due to <strong>the</strong> nuanced nature of parental<br />
leave policies, which were also exam<strong>in</strong>ed, this data was not<br />
<strong>in</strong>cluded <strong>in</strong> <strong>the</strong> table. Similarly, as all countries guarantee<strong>in</strong>g<br />
breastfeed<strong>in</strong>g breaks permit <strong>the</strong>m to be taken for at<br />
Breastfeed<strong>in</strong>g Policy scorecard <strong>in</strong>dicator Rat<strong>in</strong>gs and scores<br />
ratiNg Score leNgth<br />
oF leave<br />
very good 10 ≥ 52<br />
weeks<br />
good 9 26-51<br />
weeks<br />
Fair 6 14-25<br />
weeks<br />
poor 3 < 14<br />
weeks<br />
paid leave for<br />
mo<strong>the</strong>rs<br />
% WageS paiD BreaStFeeDiNg BreaKS at WorK BaBy-FrieNDly<br />
hoSpitalS (%)<br />
100% Breaks for <strong>the</strong> duration<br />
of breastfeed<strong>in</strong>g (i.e. no<br />
age limit)<br />
75-99% Breaks allowed until child<br />
is ≥ 7 months old<br />
50-74% Breaks of
S av e t h e c h i l D r e N · S tat e o F t h e Wo r l D ’ S M ot h e r S 2 0 1 2 59<br />
eNDNoteS<br />
1 Calculation by <strong>Save</strong> <strong>the</strong> <strong>Children</strong>. Data<br />
sources: Black, Robert E., L<strong>in</strong>dsay Allen,<br />
Zulfiqar Bhutta, Laura Caulfield, Mercedes<br />
de Onis, Majid Ezzati, Col<strong>in</strong> Ma<strong>the</strong>rs<br />
and Juan Rivera, “Maternal and Child<br />
Undernutrition: Global and Regional<br />
Exposures and Health Consequences,” The<br />
Lancet, Vol. 371, Issue 9608, January 19,<br />
2008, pp.243-260, and UNICEF, The State<br />
of <strong>the</strong> World’s <strong>Children</strong> 2012 (New York:<br />
2012) Table. 1. p.91<br />
2 Alive and Thrive. <strong>Nutrition</strong> and<br />
Bra<strong>in</strong> Development <strong>in</strong> Early Life.<br />
(Wash<strong>in</strong>gton, DC: 2012)<br />
3 Calculation by <strong>Save</strong> <strong>the</strong> <strong>Children</strong>.<br />
UNICEF. The State of <strong>the</strong> World’s <strong>Children</strong><br />
2012. Tables 1 and 2<br />
4 Grantham-McGregor, Sally, Y<strong>in</strong> Bun<br />
Cheung, Santiago Cueto, Paul Glewwe,<br />
L<strong>in</strong>da Richter and Barbara Strupp.<br />
“Development Potential for <strong>the</strong> <strong>First</strong> 5 Years<br />
for <strong>Children</strong> <strong>in</strong> Develop<strong>in</strong>g Countries.”<br />
The Lancet.Vol. 369, Issue 9555. January 6,<br />
2007. pp.60-70<br />
5 Horton, Susan. “Opportunities for<br />
Investments <strong>in</strong> Low Income Asia.” Asian<br />
Development Review. Vol.17, Nos.1,2.<br />
pp.246-273. Horton, Susan, Meera Shekar,<br />
Christ<strong>in</strong>e McDonald, Ajay Mahal and Jana<br />
Krystene Brooks. Scal<strong>in</strong>g Up <strong>Nutrition</strong>: What<br />
Will It Cost? (World Bank: Wash<strong>in</strong>gton, DC:<br />
2010)<br />
6 Food and Agriculture Organization. The<br />
State of Food Insecurity <strong>in</strong> <strong>the</strong> World 2004.<br />
(Rome: 2004)<br />
7 Hodd<strong>in</strong>ott, John, John Maluccio, Jere<br />
Behrman, Rafael Flores and Reynaldo<br />
Martorell.“Effect of a <strong>Nutrition</strong> Intervention<br />
Dur<strong>in</strong>g Early Childhood on Economic<br />
Productivity <strong>in</strong> Guatemalan Adults.” The<br />
Lancet. Vol. 371, Issue 9610. February 2,<br />
2008. pp.411-416<br />
8 <strong>Save</strong> <strong>the</strong> <strong>Children</strong>. A Life Free From<br />
Hunger. (London: 2012) Calculated us<strong>in</strong>g<br />
stunt<strong>in</strong>g prevalence rates from Mercedes de<br />
Onis, Monika Blössner and Ela<strong>in</strong>e Borghi,<br />
“Prevalence and Trends of Stunt<strong>in</strong>g Among<br />
Pre-School <strong>Children</strong>, 1990-2020,” Public<br />
Health <strong>Nutrition</strong>, Vol.15, No.1, July 14,<br />
2011. pp.142-148<br />
9 de Onis, Mercedes, et al. “Prevalence and<br />
Trends of Stunt<strong>in</strong>g Among Pre-School<br />
<strong>Children</strong>, 1990-2020,” Public Health<br />
<strong>Nutrition</strong>. p.145<br />
10 Data sources: WHO Global Database on<br />
Child Growth and Malnutrition, UNICEF<br />
global databases, recent MICS and DHS<br />
surveys (as of March 2012)<br />
11 In Afghanistan, 59 percent of children<br />
are stunted. In Burundi, Timor-Leste and<br />
Yemen, 58 percent of children are stunted.<br />
12 UNICEF. The State of <strong>the</strong> World’s <strong>Children</strong><br />
2012. Table 2. p.95<br />
13 de Onis, M, et al. “Prevalence and Trends<br />
of Stunt<strong>in</strong>g Among Pre-School <strong>Children</strong>,<br />
1990-2020,” Public Health <strong>Nutrition</strong>. p.145<br />
14 Ibid.<br />
15 UNICEF. The State of <strong>the</strong> World’s <strong>Children</strong><br />
2012.<br />
16 de Onis, Mercedes, et al. “Prevalence<br />
and Trends of Stunt<strong>in</strong>g Among Pre-School<br />
<strong>Children</strong>, 1990-2020,” Public Health<br />
<strong>Nutrition</strong>. p.145<br />
17 UNICEF. The State of <strong>the</strong> World’s <strong>Children</strong><br />
2012. Tables 2 and 6. pp.95, 111<br />
18 Black, Robert E., et al. “Maternal and<br />
Child Undernutrition: Global and Regional<br />
Exposures and Health Consequences,” The<br />
Lancet.<br />
19 Ibid.<br />
20 UNICEF. The State of <strong>the</strong> World’s <strong>Children</strong><br />
2012. Table 2. p.95<br />
21 Black, Robert E. et al. “Maternal and<br />
Child Undernutrition: Global and Regional<br />
Exposures and Health Consequences,” The<br />
Lancet.<br />
22 Ibid.<br />
23 Abdallah, Saade and Gilbert Burnham<br />
(editors). Public Health Guide for<br />
Emergencies. (The Johns Hopk<strong>in</strong>s School<br />
of Hygiene and Public Health and The<br />
International Federation of Red Cross and<br />
Red Crescent Societies: Boston: 2<strong>000</strong>) p.453<br />
24 WHO. A Review of <strong>Nutrition</strong>al Policies<br />
Background Paper (Geneva: 2011) p.68<br />
25 UNICEF. Undernutrition. Track<strong>in</strong>g Progress<br />
on MDG 1 [Updated Jan 2012]. child<strong>in</strong>fo.<br />
org/undernutrition_mdgprogress.php<br />
26 World Bank. Global Monitor<strong>in</strong>g Report<br />
2011. Improv<strong>in</strong>g <strong>the</strong> Odds of Achiev<strong>in</strong>g <strong>the</strong><br />
MDGs. (Wash<strong>in</strong>gton DC: 2011) p.3<br />
27 Progress assessment by <strong>Save</strong> <strong>the</strong> <strong>Children</strong>.<br />
Sources: Countdown to 2015; UNICEF. The<br />
State of <strong>the</strong> World’s <strong>Children</strong> 2012. Table 10<br />
28 WHO, UNICEF, UNFPA and <strong>the</strong> World<br />
Bank. Trends <strong>in</strong> Maternal Mortality: 1990 to<br />
2008. (WHO: Geneva: 2010) pp.28-32<br />
29 United Nations. The Millennium<br />
Development Goals Report 2011. (New York:<br />
2011) p.35<br />
30 Ibid. p.41<br />
31 United Nations Stand<strong>in</strong>g Committee on<br />
<strong>Nutrition</strong> (SCN). 6th Report on <strong>the</strong> World<br />
<strong>Nutrition</strong> Situation. 2010. p.71<br />
32 Ibid. p.38<br />
33 Ibid.<br />
34 Black, Robert E. et al, “Maternal and<br />
Child Undernutrition: Global and Regional<br />
Exposures and Health Consequences,” The<br />
Lancet. p.244 and Dewey, Kathryn and<br />
Khadija Begum, “Long-Term Consequences<br />
of Stunt<strong>in</strong>g <strong>in</strong> Early Life,” Maternal &<br />
Child <strong>Nutrition</strong>, Vol.7, Issue Supplement s3,<br />
September 19, 2011. p.8<br />
35 Fishman, Steven, Laura Caulfield,<br />
Mercedes de Onis, Monika Blössner, Adnan<br />
Hyder, Luke Mullany and Robert E. Black.<br />
“Childhood and Maternal Underweight.”<br />
Childhood and Maternal Undernutrition.<br />
(WHO: Geneva)<br />
36 UNICEF. Low Birthweight. child<strong>in</strong>fo.org/<br />
low_birthweight.html<br />
37 World Bank. Food Price Watch. February<br />
2011. worldbank.org/foodcrisis/food_price_<br />
watch_report_feb2011.html<br />
38 <strong>Save</strong> <strong>the</strong> <strong>Children</strong>. Cost<strong>in</strong>g Lives: The<br />
Devastat<strong>in</strong>g Impact of Ris<strong>in</strong>g and Volatile Food<br />
Prices. (London: 2011)<br />
39 IFPRI. Food Crisis and F<strong>in</strong>ancial Crisis<br />
Present Double Treat for Poor People. ifpri.<br />
org/pressrelease/food-price-crisis-and-f<strong>in</strong>ancialcrisis-present-double-threat-poor-people<br />
40 United Nations Stand<strong>in</strong>g Committee on<br />
<strong>Nutrition</strong>. The Impact of High Food Prices on<br />
Maternal and Child <strong>Nutrition</strong>, Background<br />
Paper for <strong>the</strong> SCN Side Event at <strong>the</strong> 34th<br />
Session of <strong>the</strong> Committee on World Food<br />
Security. (Rome, 14–17 October 2008)<br />
41 Jones, Gareth, Richard Steketee, Robert<br />
E. Black, Zulfiqar Bhutta, and Saul Morris.<br />
“How Many Child Deaths Can We Prevent<br />
This Year?” The Lancet. Vol. 362, Issue 9377.<br />
July 5, 2003. pp.65-71.<br />
42 United Nations Stand<strong>in</strong>g Committee on<br />
<strong>Nutrition</strong> (SCN), 6th Report on <strong>the</strong> World<br />
<strong>Nutrition</strong> Situation, p.45 and de Onis,<br />
Mercedes, et al. “Prevalence and Trends of<br />
Stunt<strong>in</strong>g Among Pre-School <strong>Children</strong>, 1990-<br />
2020,” Public Health <strong>Nutrition</strong>. p.145<br />
43 de Onis, Mercedes, et al. “Prevalence<br />
and Trends of Stunt<strong>in</strong>g Among Pre-School<br />
<strong>Children</strong>, 1990-2020,” Public Health<br />
<strong>Nutrition</strong>. p.145<br />
44 WHO Global Database on Child<br />
Growth and Malnutrition, UNICEF global<br />
databases, recent MICS and DHS surveys (as<br />
of March 2012)<br />
45 Angola and Uzbekistan are two of 75<br />
countries identified by <strong>the</strong> Countdown to<br />
2015 as priority countries for maternal,<br />
newborn and child survival. See: Countdown<br />
to 2015. Accountability for Maternal,<br />
Newborn & Child Survival: An Update on<br />
Progress <strong>in</strong> Priority Countries. (WHO: 2012)
60 eNDNoteS<br />
4 6 UNICEF. Progress for <strong>Children</strong>: Achiev<strong>in</strong>g<br />
<strong>the</strong> MDGs with Equity. (New York: 2010)<br />
47 Ergo, Alex, Davidson Gwatk<strong>in</strong> and Meera<br />
Shekar. “What Difference Do <strong>the</strong> New<br />
WHO Growth Standards Make for <strong>the</strong><br />
Prevalence and Socioeconomic Distribution<br />
of Malnutrition?” Food <strong>Nutrition</strong> Bullet<strong>in</strong>.<br />
Vol.30, No.1. March 2009. pp.3-15<br />
48 UNICEF. Progress for <strong>Children</strong>: Achiev<strong>in</strong>g<br />
<strong>the</strong> MDGs with Equity. (New York: 2010)<br />
49 F<strong>in</strong>d<strong>in</strong>gs based on an analysis of<br />
data on underweight disparities for 76<br />
countries. Data source: UNICEF Global<br />
Database: child<strong>in</strong>fo.org/undernutrition_<br />
weightbackground.php<br />
50 UNICEF. Track<strong>in</strong>g Progress on Maternal<br />
and Child <strong>Nutrition</strong>: A Survival and<br />
Development Priority. (New York: 2009)<br />
51 Central Statistical Agency [Ethiopia] and<br />
ICF International. Ethiopia Demographic<br />
and Health Survey 2011. (Addis Ababa and<br />
Calverton, MD: 2011) p.159<br />
52 National Institute of Population<br />
Research and Tra<strong>in</strong><strong>in</strong>g (NIPORT), Mitra<br />
and Associates, & Macro International.<br />
Bangladesh Demographic and Health Survey<br />
2007. (NIPORT, Mitra and Associates and<br />
Macro International: Dhaka and Calverton,<br />
MD: 2009)<br />
53 UNICEF. Track<strong>in</strong>g Progress on Maternal<br />
and Child <strong>Nutrition</strong>: A Survival and<br />
Development Priority.<br />
54 Black, Robert E., et al. “Maternal and<br />
Child Undernutrition: Global and Regional<br />
Exposures and Health Consequences.” The<br />
Lancet. Figure 4. p.254<br />
55 This set of <strong>in</strong>terventions were selected<br />
based on <strong>the</strong> potential to save lives under age<br />
5, as estimated by The Lancet (Jones et al.<br />
2003, among o<strong>the</strong>rs) as well as <strong>the</strong> feasibility<br />
of scale up <strong>in</strong> <strong>the</strong> 36 countries most<br />
heavily burdened by child malnutrition, as<br />
assessed by <strong>the</strong> World Bank (Horton et al.<br />
2010). So, for example, while preventive<br />
z<strong>in</strong>c supplementation has been proven<br />
to save lives, it is an <strong>in</strong>tervention that<br />
is not currently available for large-scale<br />
implementation.<br />
56 LiST: The Lives <strong>Save</strong>d Tool was<br />
created by a consortium of academic and<br />
<strong>in</strong>ternational organizations, led by Institute<br />
of International Programs at <strong>the</strong> Johns<br />
Hopk<strong>in</strong>s Bloomberg School, and supported<br />
by a Gates Foundation grant to <strong>the</strong> US Fund<br />
for UNICEF. It allows users to estimate <strong>the</strong><br />
impact of different <strong>in</strong>tervention packages<br />
and coverage levels for countries, states or<br />
districts.<br />
57 Horton, Susan, et al. Scal<strong>in</strong>g Up <strong>Nutrition</strong>:<br />
What Will It Cost?<br />
58 Cost estimates for <strong>the</strong> “lifesav<strong>in</strong>g six”<br />
are as follows: iron folate supplements<br />
for pregnant women: $2 per pregnancy;<br />
community nutrition programs for behavior<br />
change, which <strong>in</strong>clude <strong>the</strong> promotion of<br />
breastfeed<strong>in</strong>g, appropriate complementary<br />
feed<strong>in</strong>g practices and proper hygiene,<br />
especially hand wash<strong>in</strong>g: $7.50 per child<br />
($15 per participat<strong>in</strong>g mo<strong>the</strong>r, who is<br />
assumed to have 2 children); vitam<strong>in</strong> A<br />
supplements: $1.20 per child per year; z<strong>in</strong>c<br />
for diarrhea: $1 per child per year. Therefore<br />
<strong>the</strong> cost of deliver<strong>in</strong>g <strong>the</strong>se lifesav<strong>in</strong>g six<br />
over <strong>the</strong> first 1,<strong>000</strong> days is estimated at $2 +<br />
$7.50 + (2×$1.20) + (2×$1) = $13.90 per<br />
child. (Source: Horton et al. Scal<strong>in</strong>g Up<br />
<strong>Nutrition</strong>: What Cost. (World Bank: 2010))<br />
59 Jones, Gareth, et al. “How Many Child<br />
Deaths Can We Prevent This Year?” The<br />
Lancet.<br />
60 de Benoist, Bruno, Er<strong>in</strong> McLean, Ines<br />
Egli and Mary Cogswell (editors). Worldwide<br />
Prevalence of Anemia 1993-2005: WHO<br />
Global Database on Anemia. (WHO and<br />
Centers for Disease Control and Prevention:<br />
Geneva and Atlanta: 2008) p.7<br />
61 Christian, Parul, Laura Murray-Kolb,<br />
Subarna Khatry, Joanne Katz, Barbara<br />
Schaefer, Pamela Cole, Steven LeClerq and<br />
James Tielsch. “Prenatal Micronutrient<br />
Supplementation and Intellectual and Motor<br />
Function <strong>in</strong> Early School-Aged <strong>Children</strong><br />
<strong>in</strong> Nepal.” Journal of <strong>the</strong> American Medical<br />
Association. 2010. Vol.304, No. 24. pp.2716-<br />
2723<br />
62 Horton, Susan, et al. Scal<strong>in</strong>g Up <strong>Nutrition</strong>:<br />
What Will It Cost? p.29<br />
63 Bhutta, Zulfiqar, Tahmeed Ahmed,<br />
Robert E Black, Simon Cousens, Kathryn<br />
Dewey, Elsa Giugliani, Batool Haider, Betty<br />
Kirkwood, Saul Morris, HPS Sachdev and<br />
Meera Shekar. “What Works? Interventions<br />
for Maternal and Child Undernutrition and<br />
Survival.” The Lancet 2008. Volume 371,<br />
Issue 9610. February 2, 2008. pp.417-440<br />
64 Ibid.<br />
65 WHO Collaborative Study Team on <strong>the</strong><br />
Role of Breastfeed<strong>in</strong>g on <strong>the</strong> Prevention of<br />
Infant Mortality. “Effect of Breastfeed<strong>in</strong>g on<br />
Infant and Child Mortality Due to Infectious<br />
Diseases <strong>in</strong> Less Developed Countries: A<br />
Pooled Analysis.” The Lancet. Vol. 355, Issue<br />
9202. February 5, 2<strong>000</strong>. pp. 451–455.<br />
66 UNICEF. Track<strong>in</strong>g Progress on Maternal<br />
and Child <strong>Nutrition</strong>: A Survival and<br />
Development Priority.<br />
67 WHO. <strong>Nutrition</strong>: Complementary Feed<strong>in</strong>g.<br />
who.<strong>in</strong>t/nutrition/topics/complementary_<br />
feed<strong>in</strong>g/en/<strong>in</strong>dex.html<br />
68 Bhutta, Zulfiqar, et al. “What Works?<br />
Interventions for Maternal and Child<br />
Undernutrition and Survival.” The Lancet.<br />
Web Appendix 3. p.20<br />
69 Ramakrishnan, Usha, Phuong Nguyen,<br />
and Reynaldo Martorell. “Effects of<br />
Micronutrients on Growth of <strong>Children</strong><br />
Under 5 Years of Age: Meta-Analyses of<br />
S<strong>in</strong>gle and Multiple Nutrient Interventions.”<br />
American Journal of Cl<strong>in</strong>ical <strong>Nutrition</strong>. Vol.<br />
89. January 2009. pp.191-203.<br />
70 Bhutta, Zulfiqar, et al. “What Works?<br />
Interventions for Maternal and Child<br />
Undernutrition and Survival.” The Lancet.<br />
71 United Nations Stand<strong>in</strong>g Committee on<br />
<strong>Nutrition</strong> (SCN). 6th Report on <strong>the</strong> World<br />
<strong>Nutrition</strong> Situation. p.8<br />
72 WHO.Global Prevalence of Vitam<strong>in</strong> A<br />
Deficiency <strong>in</strong> Populations at Risk: WHO<br />
Global Database on Vitam<strong>in</strong> A Deficiency.<br />
(Geneva: 2009) p.10<br />
73 Black, Robert E., Simon Cousens, Hope<br />
Johnson, Joy Lawn, Igor Rudan, Diego<br />
Bassani, Prabhat Jha, Harry Campbell,<br />
Christa Fischer Walker, Richard Cibulskis,<br />
Thomas Eisele, Li Liu, Col<strong>in</strong> Ma<strong>the</strong>rs.<br />
“Global, Regional, and National Causes<br />
of Child Mortality <strong>in</strong> 2008: A Systematic<br />
Analysis.” The Lancet. Vol. 375, Issue 9730.<br />
June 5, 2010. p.1973<br />
74 Micronutrient Initiative. Invest<strong>in</strong>g <strong>in</strong> <strong>the</strong><br />
Future: A United Call to Action on Vitam<strong>in</strong><br />
and M<strong>in</strong>eral Deficiencies- Global Report 2009.<br />
(Ottawa: 2009)<br />
75 Jones, Gareth, et al. “How Many Child<br />
Deaths Can We Prevent This Year?” and<br />
Zulfiqar Bhutta, et al. “What Works?<br />
Interventions for Maternal and Child<br />
Undernutrition and Survival.” The Lancet.<br />
76 Black, Robert E., et al. “Global, Regional,<br />
and National Causes of Child Mortality <strong>in</strong><br />
2008: A Systematic Analysis.” The Lancet.<br />
77 WHO. Diarrhoeal Disease. who.<strong>in</strong>t/<br />
mediacentre/factsheets/fs330/en/<strong>in</strong>dex.html<br />
78 Ibid.<br />
79 Bhutta, Zulfiqar, et al. “What Works?<br />
Interventions for Maternal and Child<br />
Undernutrition and Survival.” The Lancet.<br />
80 Micronutrient Initiative. Invest<strong>in</strong>g <strong>in</strong> <strong>the</strong><br />
Future: A United Call to Action on Vitam<strong>in</strong><br />
and M<strong>in</strong>eral Deficiencies- Global Report 2009.<br />
81 Jones, Gareth, et al. “How Many Child<br />
Deaths Can We Prevent This Year?” The<br />
Lancet.<br />
82 Bhutta, Zulfiqar, et al. “What Works?<br />
Interventions for Maternal and Child<br />
Undernutrition and Survival.” The Lancet.<br />
p.421 and Webtable 3<br />
83 Black, Robert E., et al. “Global, Regional,<br />
and National Causes of Child Mortality <strong>in</strong><br />
2008: A Systematic Analysis.” The Lancet.<br />
84 Jones, Gareth, et al. “How Many Child<br />
Deaths Can We Prevent This Year?”<br />
The Lancet.<br />
85 WHO. A Review of <strong>Nutrition</strong> Policies:<br />
Draft Report. December 20, 2010. p.93<br />
86 Countdown to 2015. Somalia. March<br />
2012. who.<strong>in</strong>t/woman_child_accountability/<br />
countries/Somalia.pdf<br />
87 Analysis of birth and child mortality data<br />
<strong>in</strong> UNICEF’s State of <strong>the</strong> World’s <strong>Children</strong><br />
2005-2012.
S av e t h e c h i l D r e N · S tat e o F t h e Wo r l D ’ S M ot h e r S 2 0 1 2 61<br />
88 WHO. Global Data Bank on Infant and<br />
Young Child Feed<strong>in</strong>g (Accessed April 7, 2012)<br />
89 Aguiar, Christ<strong>in</strong>e, Josh Rosenfeld,<br />
Beth Stevens, Sup Thanasombat and<br />
Harika Masud. An Analysis of <strong>Nutrition</strong><br />
Programm<strong>in</strong>g and Policies <strong>in</strong> Peru.<br />
(University of Michigan: 2007)<br />
90 See, for example: xf<strong>in</strong>ity.comcast.net/<br />
slideshow/news-toppix08-27/7/ and news.<br />
x<strong>in</strong>huanet.com/english2010/photo/2011-<br />
08/20/c_131063097.htm<br />
91 Mejíá Acosta, Andrés. Analys<strong>in</strong>g Success<br />
<strong>in</strong> <strong>the</strong> Fight aga<strong>in</strong>st Malnutrition <strong>in</strong> Peru.<br />
(Institute of Development Studies:<br />
Brighton, UK: May 2011) and additional<br />
analysis by <strong>Save</strong> <strong>the</strong> <strong>Children</strong>, sources:<br />
WHO Global Databank on Child Growth<br />
and Malnutrition and Peru 2010 DHS<br />
F<strong>in</strong>al Report.<br />
92 SAACID and Eva Gilliam. UNICEF and<br />
SAACID Promote Exclusive Breastfeed<strong>in</strong>g <strong>in</strong><br />
Somalia’s Drought-Affected Communities.<br />
December 9, 2011. unicef.org/<br />
<strong>in</strong>fobycountry/somalia_60920.html<br />
93 UNICEF. The State of <strong>the</strong> World’s <strong>Children</strong><br />
2012. Table 1, p.90<br />
94 WHO Global Health Observatory. apps.<br />
who.<strong>in</strong>t/ghodata/# (Accessed April 2012)<br />
95 UNICEF. The State of <strong>the</strong> World’s <strong>Children</strong><br />
2012. Table 1, p.88<br />
96 Government of Botswana. Botswana<br />
Family Health Survey II 1988.<br />
(Gaborone: 1989)<br />
97 Shapiro, R.L., et al. “Antiretroviral<br />
Regimens <strong>in</strong> Pregnancy and Breast-Feed<strong>in</strong>g<br />
<strong>in</strong> Botswana.” New England Journal of<br />
Medic<strong>in</strong>e. June 17, 2010. pp.2282-2294<br />
98 Republic of Botswana, <strong>Nutrition</strong> and<br />
Food Control Division, Department of<br />
Public Health, M<strong>in</strong>istry of Health. The<br />
World Breastfeed<strong>in</strong>g Trends Initiative (WBTI):<br />
Botswana Assessment Report 2010.<br />
(Gaborone: 2011) p.22<br />
99 UNICEF. The State of <strong>the</strong> World’s <strong>Children</strong><br />
2012. Table 1, p.88<br />
100 Smith, Lisa, Usha Ramakrishnan,<br />
Aida Ndiaye, Lawrence James Haddad<br />
and Reynaldo Martorell. The Importance<br />
of Women’s Status for Child <strong>Nutrition</strong> <strong>in</strong><br />
Develop<strong>in</strong>g Countries. (IFPRI, Department<br />
of International Health, Emory University:<br />
Wash<strong>in</strong>gton DC: 2003)<br />
101 UNESCO. The Hidden Crisis. Armed<br />
Conflict and Education, EFA Global<br />
Monitor<strong>in</strong>g Report. (Paris: 2011)<br />
102 Copenhagen Consensus. Copenhagen<br />
Consensus 2008. copenhagenconsensus.com/<br />
Home.aspx<br />
103 UNESCO Institute for Statistics. Out-of-<br />
School <strong>Children</strong>: New Data Reveal Persistent<br />
Challenges. uis.unesco.org/FactSheets/<br />
Documents/FS12_2011_OOSC_EN.pdf<br />
104 WHO Global Data Bank on Infant<br />
and Young Child Feed<strong>in</strong>g (Accessed March<br />
2012) and National Institute of Statistics,<br />
Directorate General for Health, and ICF<br />
Macro, 2011. Cambodia Demographic<br />
and Health Survey 2010. (Phnom Penh,<br />
Cambodia and Calverton, Maryland:<br />
National Institute of Statistics, Directorate<br />
General for Health and ICF Macro)<br />
105 WHO. Learn<strong>in</strong>g from Large-Scale<br />
Community-Based Programmes to Improve<br />
Breastfeed<strong>in</strong>g Practices. (Geneva: 2008)<br />
pp.52-54<br />
106 Global Health Workforce Alliance.<br />
Global Experience of Community Health<br />
Workers for Delivery of Health Related<br />
Millennium Development Goals: A<br />
Systematic Review, Country Case Studies, and<br />
Recommendations for Integration <strong>in</strong>to National<br />
Health Systems. (WHO: Geneva: 2010).<br />
p.104<br />
107 Ibid.<br />
108 Pokharel, Raj Kumar, M.R. Maharjan,<br />
Pragya Ma<strong>the</strong>ma and Philip W.J. Harvey.<br />
Success <strong>in</strong> Deliver<strong>in</strong>g Interventions to Reduce<br />
Maternal Anemia <strong>in</strong> Nepal: A Case Study<br />
of <strong>the</strong> Intensification of Maternal and<br />
Neonatal Micronutrient Program. (USAID:<br />
Wash<strong>in</strong>gton, DC: 2011) pp.30-31<br />
109 Ibid., p.22<br />
110 Ibid., p.37<br />
111 UNICEF. Track<strong>in</strong>g Progress on Maternal<br />
and Child <strong>Nutrition</strong>: A Survival and<br />
Development Priority.<br />
112 UNICEF. The State of <strong>the</strong> World’s <strong>Children</strong><br />
2012. Table 2, p.93<br />
113 United Nations Stand<strong>in</strong>g Committee<br />
on <strong>Nutrition</strong> (SCN), 6th Report on <strong>the</strong> World<br />
<strong>Nutrition</strong> Situation.<br />
114 Analysis by <strong>Save</strong> <strong>the</strong> <strong>Children</strong>. Data<br />
source: UNICEF. The State of <strong>the</strong> World’s<br />
<strong>Children</strong> 2012. Table 10<br />
115 WHO, UNICEF, UNFPA and <strong>the</strong> World<br />
Bank. Trends <strong>in</strong> Maternal Mortality: 1990<br />
to 2008.<br />
116 Analysis by <strong>Save</strong> <strong>the</strong> <strong>Children</strong>: Data<br />
sources: WHO Global Database on Child<br />
Growth and Malnutrition; General Statistical<br />
Office (GSO), Vietnam Multiple Indicator<br />
Cluster Survey 2010–2011, F<strong>in</strong>al Report,<br />
2011, Hanoi, Vietnam, p.3<br />
117 Socialist Republic of Vietnam. National<br />
<strong>Nutrition</strong> Strategy for 2011-2020, With a<br />
Vision Toward 2030. (Hanoi: 2012), p.21<br />
118 Aguayo Victor, Diakalia Koné, Sory<br />
Ibrahim Bamba, Baba Diallo, Yacouba<br />
Sidibe, Diakalia Traoré, Piere Signe and<br />
Shawn Baker. “Acceptability of Multiple<br />
Micronutrient Supplements by Pregnant and<br />
Lactat<strong>in</strong>g Women <strong>in</strong> Mali.” Public Health<br />
<strong>Nutrition</strong>, Vol.8, No.1. August 4, 2004.<br />
pp.33-37<br />
119 WHO. Learn<strong>in</strong>g from Large-Scale<br />
Community-Based Programmes to Improve<br />
Breastfeed<strong>in</strong>g Practices. (Geneva: 2008)<br />
pp.71-72<br />
120 WHO Global Data Bank on Infant<br />
and Young Child Feed<strong>in</strong>g (Accessed<br />
March 31, 2012)<br />
121 UNICEF. Track<strong>in</strong>g Progress on Maternal<br />
and Child <strong>Nutrition</strong>: A Survival and<br />
Development Priority. p.30<br />
122 MacDonald, Carolyn and Solongo<br />
Altengeral. National Scale-up of<br />
Micronutrient Powders <strong>in</strong> Mongolian<br />
Integrated Program. World Vision<br />
presentation at IYCN Satellite<br />
Meet<strong>in</strong>g, June 13, 2011. iycn.org/files/<br />
FINALSpr<strong>in</strong>klesGHCJun2011_v5061511.<br />
pdf<br />
123 Barros, Fernando, Alicia Matijasevich,<br />
Jennifer Harris Requejo, Elsa Giugliani, Ana<br />
Goretti Maranhão, Carlos Monteiro, Aluísio,<br />
J.D. Barros, Flavia Bustreo, Mario Merialdi,<br />
and Cesar G. Victora. “Recent Trends <strong>in</strong><br />
Maternal, Newborn, and Child Health<br />
<strong>in</strong> Brazil: Progress Toward Millennium<br />
Development Goals 4 and 5.” American<br />
Journal of Public Health. Vol.100, No.10.<br />
October 2010. pp.1877-1889.<br />
124 The Earth Institute, Colombia University.<br />
One Million Community Health Workers:<br />
Technical Task Force Report (New York:<br />
2011) p.22<br />
125 WHO Global Database on Child Growth<br />
and Malnutrition (Accessed March 31, 2012)<br />
126 Global Health Workforce Alliance.<br />
Global Experience of Community Health<br />
Workers for Delivery of Health Related<br />
Millennium Development Goals: A<br />
Systematic Review, Country Case Studies, and<br />
Recommendations for Integration <strong>in</strong>to National<br />
Health Systems.<br />
127 Ibid.<br />
128 WHO Global Data Bank on Infant and<br />
Young Child Feed<strong>in</strong>g (Accessed March 31,<br />
2012)<br />
129 WHO, UNICEF, UNFPA and <strong>the</strong> World<br />
Bank. Trends <strong>in</strong> Maternal Mortality: 1990<br />
to 2008.<br />
130 High Level Taskforce on Innovative<br />
F<strong>in</strong>anc<strong>in</strong>g for Health Systems. Background<br />
Paper for <strong>the</strong> Global Strategy for Women’s<br />
and <strong>Children</strong>’s Health: Access for All to<br />
Skilled, Motivated and Supported Health<br />
Workers. 2010<br />
131 World Bank. Reposition<strong>in</strong>g <strong>Nutrition</strong> as<br />
Central to Development: A Strategy for Large-<br />
Scale Action. (Wash<strong>in</strong>gton, DC:2006) p.67<br />
and WHO. Global Experience of Community<br />
Health Workers for Delivery of Health<br />
Related Millennium Development Goals: A<br />
Systematic Review, Country Case Studies, and<br />
Recommendations for Integration <strong>in</strong>to National<br />
Health Systems. (Geneva: 20
62<br />
132 WHO. Exclusive Breastfeed<strong>in</strong>g for Six<br />
Months is Best for Babies Everywhere. January<br />
15, 2011. who.<strong>in</strong>t/mediacentre/news/<br />
statements/2011/breastfeed<strong>in</strong>g_20110115/<br />
en/<strong>in</strong>dex.html<br />
133 U.S. Department of Health and Human<br />
Services. The Surgeon General’s Call to Action<br />
to Support Breastfeed<strong>in</strong>g. (U.S. Department<br />
of Health and Human Services, Office of <strong>the</strong><br />
Surgeon General: Wash<strong>in</strong>gton DC: 2011)<br />
134 See, for example: Ladomenou, Fani,<br />
Joanna Moschandreas, Anthony Kafatos,<br />
Yiannis Tselentis and Emmanouil Galanakis.<br />
“Protective Effect of Exclusive Breastfeed<strong>in</strong>g<br />
Aga<strong>in</strong>st Infections Dur<strong>in</strong>g Infancy: A<br />
Prospective Study.” Archives of Disease <strong>in</strong><br />
Childhood. Vol. 95, No.12. September 27,<br />
2010. pp.1004-1008.<br />
135 See, for example: Iacovou, Maria<br />
and Almudena Sevilla-Sanz. The Effect<br />
of Breastfeed<strong>in</strong>g on <strong>Children</strong>’s Cognitive<br />
Development. (Institute for Social &<br />
Economic Research: Essex: December 13,<br />
2010)<br />
136 American Academy of Pediatrics Policy<br />
Statement. “Breastfeed<strong>in</strong>g and <strong>the</strong> Use of<br />
Human Milk.” Pediatrics Vol.115, No. 2.<br />
February 1, 2005. pp.496-506<br />
137 Collaborative Group on Hormonal<br />
Factors <strong>in</strong> Breast Cancer. “Breast Cancer and<br />
Breastfeed<strong>in</strong>g: Collaborative Reanalysis of<br />
Individual Data from 47 Epidemiological<br />
Studies <strong>in</strong> 30 Countries, Includ<strong>in</strong>g 50,302<br />
Women with Breast Cancer and 96,973<br />
Women Without <strong>the</strong> Disease.” The Lancet.<br />
Vol. 360, Issue 9328. July 20, 2002.<br />
pp.187- 195.<br />
138 Ip, Stanley, Mei Chung, Gowri Raman,<br />
Pricilla Chew, Nombulelo Magula, Deiedre<br />
DeV<strong>in</strong>e, Thomas Trikal<strong>in</strong>os and Joseph Lau.<br />
Breastfeed<strong>in</strong>g and Maternal and Infant Health<br />
Outcomes <strong>in</strong> Developed Countries. (Agency for<br />
Healthcare Research and Quality: Rockville,<br />
MD: 2007)<br />
139 See, for example: Schwarz, Eleanor Bimla,<br />
Jeanette Brown, Jennifer Creasman, Alison<br />
Stuebe, Candace McClure, Stephen Van<br />
Den Eeden and David Thom. “Lactation<br />
and Maternal Risk of Type 2 Diabetes: A<br />
Population-Based Study.” American Journal of<br />
Medic<strong>in</strong>e. Vol.123, Issue 9. September 2010.<br />
pp.863e1-863.e6<br />
140 See, for example: Ladomenou, Fani, et al.<br />
“Protective Effect of Exclusive Breastfeed<strong>in</strong>g<br />
Aga<strong>in</strong>st Infections Dur<strong>in</strong>g Infancy: A<br />
Prospective Study.” Archives of Disease <strong>in</strong><br />
Childhood.<br />
141 Data sources: WHO Global Data<br />
Bank on Infant and Young Child Feed<strong>in</strong>g<br />
(Accessed March 2012), Cattaneo, Adriano,<br />
Agneta Yngve, Berthold Koletzko and Luis<br />
Ruiz Guzman. “Protection, Promotion<br />
and Support of Breast-Feed<strong>in</strong>g <strong>in</strong> Europe:<br />
Progress from 2002 to 2007.” Public Health<br />
<strong>Nutrition</strong>. 2009; OECD Family Database<br />
and o<strong>the</strong>r recent national surveys<br />
142 Bartick Melissa and Arnold Re<strong>in</strong>hold.<br />
“The Burden of Suboptimal Breastfeed<strong>in</strong>g <strong>in</strong><br />
<strong>the</strong> United States: A Pediatric Cost Analysis”<br />
Pediatrics. April 5, 2010. pp.e1048–e1056<br />
143 Department of Health (United<br />
K<strong>in</strong>gdom). Breastfeed<strong>in</strong>g: Good Practice<br />
Guidance to <strong>the</strong> NHS. London: 1995)<br />
144 WHO Europe Region. <strong>Nutrition</strong>: Facts<br />
and Figures. euro.who.<strong>in</strong>t/en/what-we-do/<br />
health-topics/disease-prevention/nutrition/<br />
facts-and-figures<br />
145 Ogden, Cynthia, Margaret Carroll, Lester<br />
Curt<strong>in</strong>, Molly Lamb and Ka<strong>the</strong>r<strong>in</strong>e Flegal.<br />
“Prevalence of High Body Mass Index <strong>in</strong><br />
US <strong>Children</strong> and Adolescents, 2007-2008.”<br />
Journal of <strong>the</strong> American Medical Association.<br />
Vol.303, No. 3. January 13, 2010. pp.242-<br />
249<br />
146 WHO. The Global Health Observatory<br />
Data Repository (Accessed April 2012)<br />
147 Calculations by <strong>Save</strong> <strong>the</strong> <strong>Children</strong>.<br />
Sources: WHO Global Database on Child<br />
Growth and Malnutrition (Accessed March<br />
2012) and UNICEF. The State of <strong>the</strong> World’s<br />
<strong>Children</strong> 2012. Table 6, p.111<br />
148 WHO Global Database on Child Growth<br />
and Malnutrition (Accessed March 2012)<br />
149 WHO. The Global Health Observatory<br />
Data Repository (Accessed April 2012)<br />
150 Centers for Disease Control and<br />
Prevention. “Racial and Ethnic Differences<br />
<strong>in</strong> Breastfeed<strong>in</strong>g Initiation and Duration,<br />
by State – National Immunization Survey,<br />
United States, 2004-2008,” Morbidity and<br />
Mortality Weekly Report, Vol. 59, No. 11,<br />
March 26, 2010. pp.327-334.<br />
151 Ibid.<br />
152 U.S. Department of Health and Human<br />
Services, Centers for Disease Control and<br />
Prevention. Breastfeed<strong>in</strong>g Report Card –<br />
United States, 2011. (Atlanta: August 2011)<br />
153 Australian Health M<strong>in</strong>isters Conference.<br />
Australian National Breastfeed<strong>in</strong>g Strategy<br />
2010-2015. (Canberra: 2009) pp.14-15<br />
154 NHS Information Centre. Infant Feed<strong>in</strong>g<br />
Survey 2010: Early Results. June 21, 2011.<br />
ic.nhs.uk/pubs/<strong>in</strong>fantfeed<strong>in</strong>g10<br />
155 Boll<strong>in</strong>g, Keith, Ca<strong>the</strong>r<strong>in</strong>e Grant, Becky<br />
Hamlyn and Alex Thornton. Infant Feed<strong>in</strong>g<br />
Survey 2005. NHS Information Centre.<br />
2007. pp.34, 47<br />
156 Hanna, Jennifer and Mari Douma.<br />
Barriers to Breastfeed<strong>in</strong>g <strong>in</strong> Women of Lower<br />
Socioeconomic Status, Michigan State<br />
University. 2012.<br />
157 UNICEF, The Baby-Friendly Hospital<br />
Initiative. unicef.org/programme/<br />
breastfeed<strong>in</strong>g/baby.htm#10<br />
158 Ibid.<br />
159 Cattaneo, Adriano, Agneta Yngve,<br />
Berthold Koletzko and Luis Ruiz Guzman.<br />
“Promotion of Breastfeed<strong>in</strong>g <strong>in</strong> Europe<br />
Project: Protection, Promotion and Support<br />
of Breast-Feed<strong>in</strong>g <strong>in</strong> Europe: Current<br />
Situation.” Public Health <strong>Nutrition</strong>. Vol. 8,<br />
No.1. 2005. pp.39-46<br />
160 Hofvander, Yngve. “Breastfeed<strong>in</strong>g and <strong>the</strong><br />
Baby Friendly Hospitals Initiative (BFHI):<br />
Organization, Response and Outcome<br />
<strong>in</strong> Sweden and O<strong>the</strong>r Countries.” Acta<br />
Paediatrica. Vol. 94, No. 8. August 2005.<br />
pp.1012–1016<br />
161 Ogbuanu, Ch<strong>in</strong>elo, Saundra Glover,<br />
Janice Probst, Jihong Liu and James Hussey.<br />
“The Effect of Maternity Leave Length and<br />
Time of Return to Work on Breastfeed<strong>in</strong>g.”<br />
Pediatrics. Vol.127, Issue: 6. May 30, 2011.<br />
pp.e1414-e1427<br />
162 The category “more developed” nations<br />
<strong>in</strong>cludes countries <strong>in</strong> all regions of Europe,<br />
<strong>in</strong>clud<strong>in</strong>g Central and Eastern European<br />
countries as well as <strong>the</strong> Baltic States, plus<br />
Nor<strong>the</strong>rn America, Australia, New Zealand<br />
and Japan.<br />
163 Statistics and Monitor<strong>in</strong>g Section/<br />
Division of Policy and Practice/UNICEF.<br />
Technical Note: How to Calculate Average<br />
Annual Rate of Reduction (AARR) of<br />
Underweight Prevalence. Drafted April<br />
2007. child<strong>in</strong>fo.org/files/Technical_Note_<br />
AARR.pdf<br />
164 See, for example, UNICEF. Track<strong>in</strong>g<br />
Progress on Child and Maternal <strong>Nutrition</strong>: A<br />
Survival and Development Priority, p.13<br />
165 WHO and L<strong>in</strong>kages. Infant and Young<br />
Child Feed<strong>in</strong>g: A Tool for Assess<strong>in</strong>g National<br />
Practices, Policy and Programs. (WHO:<br />
Geneva 2003)<br />
166 See, for example, BPNI/ IBFAN-Asia,<br />
The State of Breastfeed<strong>in</strong>g <strong>in</strong> 33 Countries<br />
(Delhi 2010)<br />
167 Countdown to 2015. Accountability for<br />
Maternal, Newborn & Child Survival: An<br />
Update on Progress <strong>in</strong> Priority Countries.<br />
(WHO: 2012)<br />
168 For a complete list of <strong>in</strong>dustrialized<br />
countries considered, see: UNICEF. The State<br />
of <strong>the</strong> World’s <strong>Children</strong> 2012. p.124<br />
169 Cattaneo, et al. “Protection, Promotion<br />
and Support of Breast-Feed<strong>in</strong>g <strong>in</strong> Europe:<br />
Current Situation.” Public Health<br />
<strong>Nutrition</strong>. p.41<br />
170 IBFAN. State of <strong>the</strong> Code by Country<br />
2011. (Penang, Malaysia: 2011)
creDitS<br />
manag<strong>in</strong>g editor<br />
tracy geoghegan<br />
Pr<strong>in</strong>cipal advisers<br />
paige harrigan, Kar<strong>in</strong> lapp<strong>in</strong>g<br />
Research directors<br />
Nikki gillette, Beryl lev<strong>in</strong>ger<br />
Research assistants<br />
Jennifer hayes, Molly Maccalman,<br />
Mary Magellan<br />
Contributors<br />
amy agnew, adriano cattaneo, Wendy<br />
christian, ela<strong>in</strong>e cote, tara Fisher, <strong>in</strong>grid<br />
Friberg, rica garde, Monika gutestam,<br />
Jesse hartness, Ben hewitt, Debra howe,<br />
yasmeen ikramullah, Mariam Jamal, t<strong>in</strong>a<br />
Johnson, amanullah Khan, Joy lawn, Mats<br />
lignell, Kim terje loraas, honey Malla,<br />
ishtiaq Mannan, rachel Maranto, Daniel<br />
Desai Mart<strong>in</strong>, carolyn Miles, carol Miller,<br />
claudia Morrissey, georg<strong>in</strong>a Mortimer,<br />
peter Moss, Diana Myers, Nora o’connell,<br />
Joanne omang, David oot, Ben phillips,<br />
Mary Beth powers, tricia puskar, ghulam<br />
Qadri, task<strong>in</strong> rahman, amy raub, Kate<br />
redmond, Susan ridge, christ<strong>in</strong>e roehrs,<br />
oliver Scanlan, Sanjana Shrestha, eric<br />
Starbuck, colleen Barton Sutton, eric<br />
Swedberg, pragya vats, Steve Wall, patrick<br />
Watt, tanya We<strong>in</strong>berg<br />
design<br />
Spirals, <strong>in</strong>c.<br />
Photo editor<br />
Susan Warner<br />
Photo Credits<br />
page 1 – eileeN BUrKe<br />
Mozambique. Nocta feeds her 10-monthold<br />
tw<strong>in</strong>s a healthy porridge. At a<br />
<strong>Save</strong> <strong>the</strong> <strong>Children</strong>-sponsored weigh-<strong>in</strong>, <strong>the</strong><br />
tw<strong>in</strong>s were diagnosed as malnourished and<br />
underweight for <strong>the</strong>ir age.<br />
page 4 – rachel palMer<br />
Somalia. Seriously malnourished Mayum,<br />
age 2, is treated at a <strong>Save</strong> <strong>the</strong> <strong>Children</strong><br />
stabilization cl<strong>in</strong>ic. She is ga<strong>in</strong><strong>in</strong>g weight and<br />
should be discharged <strong>in</strong> two to three days.<br />
page 6 – traN DUc MaN<br />
vietnam. Ho Thi Nan jo<strong>in</strong>ed a breastfeed<strong>in</strong>g<br />
group when she was pregnant with her fourth<br />
child. Her son got noth<strong>in</strong>g but breast milk for<br />
<strong>the</strong> first 6 months, and he has been much<br />
healthier than her o<strong>the</strong>r three children.<br />
page 7 – roDrigo orDóñeZ<br />
Kyrgyzstan. Altyani and her 4-month-old son<br />
Islam have a check-up at a hospital supported<br />
by <strong>Save</strong> <strong>the</strong> <strong>Children</strong>.<br />
page 8 – chriStiNe roehrS<br />
afghanistan. Farzia, age 2, lives with her family<br />
<strong>in</strong> a refugee camp <strong>in</strong> Kabul.<br />
page 9 – aMy reeD<br />
Niger. Nana and her children cook on an<br />
open fire outside <strong>the</strong>ir one-room home. They<br />
have no runn<strong>in</strong>g water or sanitation.<br />
page 10 – ShaFiQUl alaM KiroN<br />
Bangladesh. Shilpi and her 3-month-old<br />
daughter Anika get advice about good nutrition<br />
practices from a community health volunteer<br />
tra<strong>in</strong>ed by <strong>Save</strong> <strong>the</strong> <strong>Children</strong>.<br />
page 11 – JeNN WarreN<br />
South Sudan. Moya hopes her daughter<br />
Jacquel<strong>in</strong>e, age 1, will go to school, learn how<br />
to use a computer, and have a professional<br />
career when she grows up.<br />
page 12 – aMoS gUMUlira<br />
Malawi. Teacher Dyna Nkundika gives a<br />
lesson on numbers to girls <strong>in</strong> her first grade<br />
class.<br />
page 14 – SeBaStiaN rich<br />
Mozambique. Mo<strong>the</strong>rs and children receive<br />
a community meal and nutrition counsel<strong>in</strong>g<br />
through a <strong>Save</strong> <strong>the</strong> <strong>Children</strong> program <strong>in</strong><br />
Namissica village.<br />
page 21 – Michael BiSceglie<br />
guatemala. Margarita, age 2, outside a school<br />
supported by <strong>Save</strong> <strong>the</strong> <strong>Children</strong>.<br />
page 22 – JeNN WarreN<br />
South Sudan. Lochebe, age 2, eats porridge<br />
at a <strong>the</strong>rapeutic feed<strong>in</strong>g center supported by<br />
<strong>Save</strong> <strong>the</strong> <strong>Children</strong>.<br />
page 25 – lUcia Zoro<br />
Nigeria. Am<strong>in</strong>a, her new baby and her 2-yearold<br />
son Jalil are all healthy now. Last year, Jalil<br />
was malnourished, but he recovered through a<br />
program supported by <strong>Save</strong> <strong>the</strong> <strong>Children</strong>.<br />
page 27 – rachel palMer<br />
<strong>in</strong>dia. Deepak, age 1, gets a dose of vitam<strong>in</strong> A<br />
from a community health volunteer <strong>in</strong> a slum<br />
area of New Delhi.<br />
page 28 – Michael BiSceglie<br />
Malawi. 4-month-old Hanna nurses while her<br />
mo<strong>the</strong>r, Agness, attends a sav<strong>in</strong>gs and loan<br />
group meet<strong>in</strong>g. Agness is <strong>the</strong> group’s treasurer.<br />
page 29 – ap photo / Karel Navarro<br />
peru. 2-month-old Sheyla and 6-monthold<br />
Maciel participate <strong>in</strong> a breastfeed<strong>in</strong>g<br />
contest <strong>in</strong> Lima as part of Peru’s national<br />
breastfeed<strong>in</strong>g week.<br />
page 30 – laUreNt DUvillier<br />
côte d’ivoire. Mo<strong>the</strong>rs and newborns at a<br />
camp for <strong>in</strong>ternally displaced people.<br />
page 34 – Michael BiSceglie<br />
vietnam. New mo<strong>the</strong>r Bui Thi Xuan receives<br />
breastfeed<strong>in</strong>g <strong>in</strong>struction from midwife Le Thi<br />
Hong Chau.<br />
page 36 – eDUarDo MartiNo<br />
Brazil. A 2-year-old boy is exam<strong>in</strong>ed by<br />
a nurse at Carlos Tortelly Hospital <strong>in</strong> Rio<br />
de Janeiro. The hospital is supported by<br />
<strong>Save</strong> <strong>the</strong> <strong>Children</strong>.<br />
page 38 – getty iMageS / FreDriK<br />
NyMaN<br />
Sweden. A mo<strong>the</strong>r breastfeeds her baby.<br />
page 40 – roBert McKechNie<br />
australia. A child gets a healthy snack at a<br />
<strong>Save</strong> <strong>the</strong> <strong>Children</strong> program for socially isolated<br />
and marg<strong>in</strong>alized children.<br />
page 41 – SUSaN WarNer<br />
United States. Amanda is pregnant with her<br />
second child and work<strong>in</strong>g full-time.<br />
page 46 – Mai SiMoNSeN<br />
Norway. Ragnhild breastfeeds her 15-monthold<br />
daughter Cornelia.<br />
page 44 – rachel palMer<br />
Niger. Sageirou dr<strong>in</strong>ks fortified milk at a<br />
stabilization center for malnourished children<br />
supported by <strong>Save</strong> <strong>the</strong> <strong>Children</strong>. He had<br />
diarrhea and was sick for four months before<br />
his mo<strong>the</strong>r brought him to <strong>the</strong> center.<br />
page 46 – Mai SiMoNSeN<br />
Norway. Ragnhild plays with her 15-monthold<br />
daughter Cornelia.<br />
page 47 – UNhcr / heleNe caUx<br />
Niger. Mo<strong>the</strong>rs and children wait to receive<br />
food <strong>in</strong> a refugee camp. Many of <strong>the</strong> children<br />
are sick with diarrhea, <strong>in</strong>fections and<br />
respiratory problems.<br />
page 48 – aMaDoU MBoDJ<br />
chad. Fatima, 8 months, was diagnosed as<br />
malnourished. She is be<strong>in</strong>g fed a ready-touse<br />
<strong>the</strong>rapeutic food called Plumpy’nut at a<br />
<strong>Save</strong> <strong>the</strong> <strong>Children</strong> feed<strong>in</strong>g center.<br />
page 49 – lalage SNoW<br />
afghanistan. Roya, a midwife <strong>in</strong> Guldara<br />
District, does a prenatal checkup with<br />
Pashtoon who is eight months pregnant.<br />
page 50 – SUSaNNah irelaND<br />
<strong>in</strong>dia. In <strong>the</strong> Okhla slum of Dehli, 15-monthold<br />
Mahima has never had milk or vegetables<br />
<strong>in</strong> her lifetime. She is <strong>the</strong> size of a 6-month-old<br />
and is dangerously malnourished.<br />
page 59 – SeBaStiaN rich<br />
Mozambique. Joaquim, 2 years and 2 months<br />
old, weighs 14.5 pounds. A healthy child this<br />
age should weigh about twice as much.<br />
BacK cover – JeNN WarreN<br />
South Sudan. The last harvest was bad<br />
and Lochoke does not have enough food<br />
to feed her family, <strong>in</strong>clud<strong>in</strong>g her 18-monthold<br />
daughter Narot, who is suffer<strong>in</strong>g from<br />
pneumonia.
South Sudan<br />
Jo<strong>in</strong> <strong>the</strong> ConVeRsation<br />
Facebook.com/<strong>Save</strong><strong>the</strong>children<br />
twitter.com/<strong>Save</strong><strong>the</strong>children<br />
Malnutrition is <strong>the</strong> s<strong>in</strong>gle largest threat to a young<br />
child’s life and well-be<strong>in</strong>g. It is an underly<strong>in</strong>g cause of<br />
2.6 million child deaths each year and it leaves millions<br />
more with lifelong physical and cognitive impairments.<br />
More than 170 million children do not have <strong>the</strong><br />
opportunity to reach <strong>the</strong>ir full potential because of poor<br />
nutrition <strong>in</strong> <strong>the</strong> earliest months of life.<br />
State of <strong>the</strong> World’s Mo<strong>the</strong>rs 2012 looks at <strong>the</strong> critical<br />
importance of nutrition <strong>in</strong> <strong>the</strong> first 1,<strong>000</strong> days – from a<br />
mo<strong>the</strong>r’s pregnancy through her child’s second birthday.<br />
It presents an Infant and Toddler Feed<strong>in</strong>g Scorecard show<strong>in</strong>g<br />
where young children have <strong>the</strong> best nutrition, and<br />
where <strong>the</strong>y have <strong>the</strong> worst. It also highlights six low-cost<br />
nutrition solutions that have <strong>the</strong> greatest potential to<br />
save lives <strong>in</strong> <strong>the</strong> first 1,<strong>000</strong> days, and shows how millions<br />
of children could be saved if <strong>the</strong>se solutions were available<br />
to every mo<strong>the</strong>r and child who needs <strong>the</strong>m.<br />
State of <strong>the</strong> World’s Mo<strong>the</strong>rs 2012 argues that every<br />
child deserves a healthy start <strong>in</strong> life. Investments <strong>in</strong> child<br />
nutrition are not only <strong>the</strong> right th<strong>in</strong>g to do, <strong>the</strong>y will<br />
also pay for <strong>the</strong>mselves, by help<strong>in</strong>g to lay <strong>the</strong> foundation<br />
for a healthier and more prosperous world.<br />
State of <strong>the</strong> World’s Mo<strong>the</strong>rs 2012 also presents <strong>the</strong><br />
annual Mo<strong>the</strong>rs’ Index. Us<strong>in</strong>g <strong>the</strong> latest data on health,<br />
nutrition, education and political participation, <strong>the</strong><br />
Index ranks 165 countries – <strong>in</strong> both <strong>the</strong> <strong>in</strong>dustrialized<br />
and develop<strong>in</strong>g world – to show where mo<strong>the</strong>rs fare best<br />
and where <strong>the</strong>y face <strong>the</strong> greatest hardships.<br />
<strong>Save</strong> <strong>the</strong> <strong>Children</strong><br />
54 Wilton Road<br />
Westport, CT 06880<br />
United States<br />
1 800 728 3843<br />
www.save<strong>the</strong>children.org<br />
<strong>Save</strong> <strong>the</strong> <strong>Children</strong> International<br />
St V<strong>in</strong>cent’s House<br />
30 Orange Street<br />
London<br />
WC2H 7HH<br />
United K<strong>in</strong>gdom<br />
+44 (0)20 3272 0300<br />
www.save<strong>the</strong>children.net<br />
<strong>Save</strong> <strong>the</strong> <strong>Children</strong> is <strong>the</strong> lead<strong>in</strong>g <strong>in</strong>dependent organization for<br />
children <strong>in</strong> need, with programs <strong>in</strong> 120 countries. We aim to <strong>in</strong>spire<br />
breakthroughs <strong>in</strong> <strong>the</strong> way <strong>the</strong> world treats children, and to achieve<br />
immediate and last<strong>in</strong>g change <strong>in</strong> <strong>the</strong>ir lives by improv<strong>in</strong>g <strong>the</strong>ir<br />
health, education and economic opportunities. In times of acute<br />
crisis, we mobilize rapid assistance to help children recover from <strong>the</strong><br />
effects of war, conflict and natural disasters