North America Sales <strong>Honda</strong> Vehicle Sales in the U.S. (Sales of North American-produced vehicles in parentheses) Accord Civic* Prelude Passport** Odyssey CR-V S2000 Insight Pilot Element Ridgeline Fit http://hondanews.com/digitalfactbook EV Plus FCX CR-Z Division Total 2010 311,381 (311,211) 260,218 (252,882) 0 108,182 (108,182) 203,714 (166,334) 85 20,962 102,323 (102,323) 14,247 (14,247) 16,142 (16,142) 54,354 0 17 5,249 1,096,874 (971,321) 88.6% 1,230,480 87.0% 2009 290,056 (273,135) 259,722 (244,602) 100,133 (100,133) 191,214 (153,431) 795 20,572 83,901 (83,901) 14,884 (14,884) 16,464 (16,464) 67,315 5 1,045,061 (886,550) 84.8% 1,150,784 83.6% 2008 372,789 (309,461) 339,289 (305,509) 135,493 (135,493) 197,279 (90,480) 2,538 96,746 (96,746) 26,447 (26,447) 33,875 (33,875) 79,794 11 1,284,261 (998,011) 77.7% 1,428,765 77.4% 2007 392,231 (355,768) 331,095 (292,191) 173,046 (173,046) 219,160 (26,130) 4,302 3 117,146 (117,146) 35,218 (35,218) 42,795 (42,795) 56,432 10 1,371,438 (1,042,294) 76.0% 1,551,542 76.2% 2006 354,441 (323,079) 316,638 (272,899) 177,919 (177,919) 170,028 6,271 722 152,154 (152,154) 51,829 (51,829) 50,193 (50,193) 27,934 6 1,308,135 (1,028,073) 78.6% 1,509,358 77.0% 2005 369,293 (350,257) 308,415 (263,833) 174,275 (174,275) 150,219 7,780 666 143,353 (143,353) 56,262 (56,262) 42,593 (42,593) 6 1,252,862 (1,030,573) 82.3% 1,462,472 79.8% 2004 386,770 (352,808) 309,196 (274,837) 154,238 (154,238) 149,281 7,320 583 128,158 (128,158) 59,927 (59,927) 6 1,195,479 (969,968) 81.1% 1,394,398 79.4% 2003 397,750 (325,465) 299,672 (260,632) 10 70 (70) 154,063 (154,063) 143,909 7,888 1,168 106,917 (106,917) 67,478 (67,478) 4 1,178,929 (914,625) 77.6% 1,349,847 76.7% 2002 398,980 (330,692) 313,159 (283,173) 1,966 3,524 (3,524) 153,467 (153,467) 146,266 9,684 2,216 52,062 (52,062) 957 (957) 1 1,082,282 (823,875) 76.1% 1,247,834 76.1% 2001 414,718 (350,090) 331,780 (311,314) 9,462 17,448 (17,448) 131,041 (131,036) 118,313 9,682 4,726 1,037,170 (809,888) 78.1% 1,207,279 77.8% 2000 404,515 (317,483) 324,528 (306,748) 9,692 21,892 (21,892) 126,705 (126,686) 118,260 6,797 3,788 2 1,016,179 (772,809) 76.1% 1,158,860 75.4% 1999 404,192 (316,339) 318,309 (308,807) 11,378 22,974 (22,974) 77,801 (77,626) 120,754 3,400 17 62 958,887 (725,746) 75.7% 1,076,893 74.6% 1998 401,071 (370,984) 335,110 (317,134) 15,399 26,094 (26,094) 20,819 (7,154) 100,582 133 899,208 (721,366) 80.2% 1,009,600 75.7% 1997 384,609 (363,016) 321,144 (273,356) 16,678 22,622 (22,622) 20,333 66,752 105 832,243 (658,994) 79.2% 940,386 73.2% 1996 382,298 (381,912) 286,350 (266,859) 12,063 28,184 (28,184) 27,025 735,920 (676,955) 92.0% 843,828 82.2% 1995 341,384 (293,898) 289,435 (217,146) 12,517 27,981 (27,981) 25,911 697,228 (539,025) 77.3% 794,679 67.8% 1994 367,615 (263,599) 267,023 (201,023) 15,467 25,758 (25,758) 230 676,093 (490,380) 72.5% 788,230 62.2% 1993 330,030 (249,048) 255,579 (168,880) 22,540 106 (106) 608,255 (418,034) 68.7% 716,546 58.3% 1992 393,477 (329,751) 219,228 (145,967) 36,040 648,745 (475,718) 73.3% 768,845 61.9% 1991 399,297 (323,088) 232,690 (159,009) 27,262 659,249 (482,097) 73.1% 802,957 60.0% 1990 417,179 (276,878) 261,502 (187,240) 37,814 716,495 (464,118) 64.8% 854,839 54.3% 1989 362,707 (215,108) 235,452 (174,364) 42,882 641,041 (389,472) 60.8% 783,102 49.7% 1988 362,663 (248,044) 225,543 (127,581) 52,541 640,747 (375,625) 58.6% 768,985 48.8% 1987 334,876 (230,085) 221,252 (86,533) 72,708 628,836 (316,618) 50.3% 738,306 42.9% 1986 325,004 (212,237) 235,801 (23,010) 79,841 640,646 (235,247) 36.7% 693,515 33.9% 1985 268,420 (145,976) 208,031 75,938 552,389 (145,976) 26.4% 552,389 26.4% 1984 256,650 (133,601) 184,846 66,924 508,420 (133,601) 26.3% 508,420 26.3% 1983 222,137 (50,402) 137,747 41,188 401,072 (50,402) 12.6% 401,072 12.6% 1982 195,524 132,469 37,872 365,865 365,865 1981 172,557 154,698 43,450 370,705 370,705 1980 185,972 138,740 50,676 375,388 375,388 1979 157,919 155,541 39,831 353,291 353,291 1978 120,841 154,035 274,876 274,876 1977 75,995 147,638 223,633 223,633 1976 18,643 132,286 150,929 150,929 1975 102,389 102,389 102,389 1974 43,119 43,119 43,119 1973 32,575 38,957 38,957 1972 20,500 20,500 1971 9,509 9,509 1970 4,159 4,159 TOTAL 10,973,984 (8,003,415) 8,822,244 (5,725,529) 832,139 196,653 (196,653) 1,760,681 (1,673,318) 2,095,731 (436,375) 66,542 55,423 982,760 (982,760) 327,249 (327,249) 202,062 (202,062) 285,829 302 66 5,249 26,647,464 (17,547,361) 65.9% 30,067,531 63.3% Note: All figures are calendar year sales. * Includes sales of CR-X and del Sol. ** Passport models were produced by Isuzu in North America. *** Includes sales of N600 and S600 models. <strong>Honda</strong> Division Domestic Produced Sales American <strong>Honda</strong> Total Sales 3.2 American <strong>Honda</strong> Yearly Total
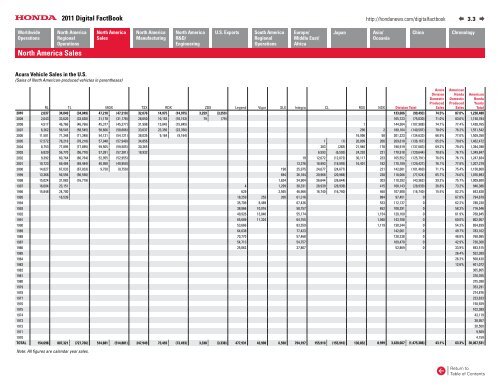
North America Sales Acura Vehicle Sales in the U.S. (Sales of North American-produced vehicles in parentheses) http://hondanews.com/digitalfactbook RL TL MDX TSX RDX ZDX Legend Vigor SLX Integra CL RSX NSX Division Total 2010 2,037 34,049 (34,049) 47,210 (47,210) 32,076 14,975 (14,975) 3,259 (3,259) 133,606 (99,493) 74.5% 87.0% 1,230,480 2009 2,043 33,620 (33,620) 31,178 (31,178) 28,650 10,153 (10,153) 79 (79) 105,723 (75,030) 71.0% 83.6% 1,150,784 2008 4,517 46,766 (46,766) 45,377 (45,377) 31,998 15,845 (15,845) 1 144,504 (107,988) 74.7% 77.4% 1,428,765 2007 6,262 58,545 (58,545) 58,606 (58,606) 33,037 23,356 (23,356) 296 2 180,104 (140,507) 78.0% 76.2% 1,551,542 2006 11,501 71,348 (71,348) 54,121 (54,121) 38,035 9,164 (9,164) 16,996 58 201,223 (134,633) 66.9% 77.0% 1,509,358 2005 17,572 78,218 (78,218) 57,948 (57,948) 34,856 1 (1) 20,809 206 209,610 (136,167) 65.0% 79.8% 1,462,472 2004 8,753 77,895 (77,895) 59,505 (59,505) 30,365 283 (283) 21,940 178 198,919 (137,683) 69.2% 79.4% 1,394,398 2003 6,829 56,770 (56,770) 57,281 (57,281) 18,932 6,593 (6,593) 24,292 221 170,918 (120,644) 70.6% 76.7% 1,349,847 2002 9,392 60,764 (60,764) 52,955 (52,955) 19 12,072 (12,072) 30,117 233 165,552 (125,791) 76.0% 76.1% 1,247,834 2001 10,723 69,484 (69,484) 40,950 (40,950) 13,376 18,993 (18,993) 16,401 182 170,109 (129,427) 76.1% 77.8% 1,207,279 2000 14,827 67,033 (67,033) 9,750 (9,750) 198 25,975 24,677 (24,677) 221 142,681 (101,460) 71.1% 75.4% 1,158,860 1999 13,366 56,556 (56,556) 694 26,184 20,968 (20,968) 238 118,006 (77,524) 65.7% 74.6% 1,076,893 1998 15,024 31,883 (16,718) 1,634 34,904 26,644 (26,644) 303 110,392 (43,362) 39.3% 75.7% 1,009,600 1997 16,004 23,151 4 1,299 38,331 28,939 (28,939) 415 108,143 (28,939) 26.8% 73.2% 940,386 1996 15,848 24,700 629 2,565 46,966 16,740 (16,740) 460 107,908 (16,740) 15.5% 82.2% 843,828 1995 16,539 18,259 253 200 61,316 884 97,451 0 67.8% 794,679 1994 35,709 8,469 67,426 533 112,137 0 62.2% 788,230 1993 38,866 10,016 58,757 652 108,291 0 58.3% 716,546 1992 49,926 13,846 55,174 1,154 120,100 0 61.9% 768,845 1991 65,689 11,324 64,755 1,940 143,708 0 60.0% 802,957 1990 53,666 83,559 1,119 138,344 0 54.3% 854,839 1989 64,638 77,423 142,061 0 49.7% 783,102 1988 70,770 57,468 128,238 0 48.8% 768,985 1987 54,713 54,757 109,470 0 42.9% 738,306 1986 25,062 27,807 52,869 0 33.9% 693,515 1985 26.4% 552,389 1984 26.3% 508,420 1983 12.6% 401,072 1982 365,865 1981 370,705 1980 375,388 1979 353,291 1978 274,876 1977 223,633 1976 150,929 1975 102,389 1974 43,119 1973 38,957 1972 20,500 1971 9,509 1970 4,159 TOTAL 154,698 807,321 (727,766) 514,881 (514,881) 247,949 73,493 (73,493) 3,338 (3,338) 477,931 43,908 6,590 794,197 155,910 (155,910) 130,852 8,999 3,420,067 (1,475,388) 43.1% 63.3% 30,067,531 Note: All figures are calendar year sales. Acura Division Domestic Produced Sales American <strong>Honda</strong> Domestic Produced Sales 3.3 American <strong>Honda</strong> Yearly Total