2011 Digital Fact Book - Honda
2011 Digital Fact Book - Honda
2011 Digital Fact Book - Honda
- TAGS
- digital
- honda
- www.honda.com

You also want an ePaper? Increase the reach of your titles
YUMPU automatically turns print PDFs into web optimized ePapers that Google loves.
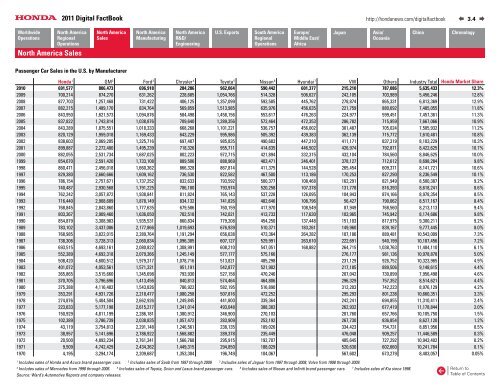
North America Sales<br />
Passenger Car Sales in the U.S. by Manufacturer<br />
http://hondanews.com/digitalfactbook<br />
<strong>Honda</strong> 1 GM 2 Ford 3 Chrysler 4 Toyota 5 Nissan 6 Hyundai 7 VW Others Industry Total <strong>Honda</strong> Market Share<br />
2010 691,577 806,473 696,918 284,286 962,064 590,442 601,377 215,210 787,086 5,635,433 12.3%<br />
2009 700,214 874,270 631,262 228,685 1,054,766 514,328 506,627 242,105 703,989 5,456,246 12.8%<br />
2008 877,703 1,257,468 731,422 406,125 1,357,099 593,585 445,762 278,874 865,331 6,813,369 12.9%<br />
2007 882,215 1,489,170 834,764 569,859 1,513,985 635,976 456,635 221,759 880,692 7,485,055 11.8%<br />
2006 843,950 1,621,573 1,094,876 584,498 1,458,156 553,617 476,263 224,977 599,451 7,457,361 11.3%<br />
2005 837,822 1,743,814 1,038,876 709,640 1,289,356 572,464 472,353 286,782 715,959 7,667,066 10.9%<br />
2004 843,289 1,875,551 1,018,333 668,268 1,101,221 536,757 456,002 301,487 705,024 7,505,932 11.2%<br />
2003 820,129 1,959,018 1,169,433 643,229 995,986 505,392 439,383 362,139 715,772 7,610,481 10.8%<br />
2002 838,603 2,069,205 1,325,716 697,487 985,835 490,683 447,210 411,171 837,319 8,103,229 10.3%<br />
2001 899,887 2,272,480 1,495,239 718,326 955,711 414,635 446,502 426,974 792,871 8,422,625 10.7%<br />
2000 882,055 2,531,734 1,687,025 802,223 972,715 421,894 332,315 432,104 784,560 8,846,625 10.0%<br />
1999 854,670 2,591,420 1,733,108 889,506 888,969 403,471 246,401 378,127 712,612 8,698,284 9.8%<br />
1998 860,471 2,456,018 1,660,362 866,328 867,814 411,375 144,528 265,454 609,371 8,141,721 10.6%<br />
1997 829,380 2,660,666 1,609,162 736,530 822,582 467,500 113,186 170,253 827,290 8,236,549 10.1%<br />
1996 786,154 2,757,671 1,737,252 832,633 793,592 500,377 108,468 162,291 821,949 8,500,387 9.2%<br />
1995 740,487 2,930,568 1,791,225 786,180 793,974 520,258 107,378 131,778 816,393 8,618,241 8.6%<br />
1994 762,242 3,057,872 1,938,841 811,824 765,143 537,228 126,095 104,943 874,166 8,978,354 8.5%<br />
1993 716,440 2,908,689 1,878,149 834,132 741,826 482,646 108,796 56,427 790,062 8,517,167 8.4%<br />
1992 768,845 2,843,860 1,777,635 679,586 760,159 417,970 108,549 87,949 768,560 8,213,113 9.4%<br />
1991 803,367 2,909,460 1,636,050 702,518 742,021 413,733 117,630 103,965 745,942 8,174,686 9.8%<br />
1990 854,879 3,308,983 1,935,531 860,834 779,208 454,250 137,448 151,103 817,975 9,300,211 9.2%<br />
1989 783,102 3,437,086 2,177,866 1,019,693 676,939 510,371 183,261 149,960 839,167 9,777,445 8.0%<br />
1988 768,985 3,822,015 2,289,764 1,191,294 656,638 473,364 264,282 187,186 889,481 10,543,009 7.3%<br />
1987 738,306 3,728,313 2,060,834 1,096,385 607,127 529,991 263,610 222,691 940,199 10,187,456 7.2%<br />
1986 693,515 4,693,161 2,080,822 1,308,991 608,210 547,051 168,882 264,715 1,038,763 11,404,110 6.1%<br />
1985 552,389 4,692,318 2,079,366 1,245,149 577,177 575,166 276,177 981,136 10,978,878 5.0%<br />
1984 508,420 4,600,512 1,979,317 1,078,716 513,821 485,298 231,129 926,752 10,323,965 4.9%<br />
1983 401,072 4,053,561 1,571,321 951,191 542,877 521,902 217,185 889,506 9,148,615 4.4%<br />
1982 365,865 3,515,660 1,345,698 793,930 527,158 470,246 207,042 730,899 7,956,498 4.6%<br />
1981 370,705 3,796,696 1,413,456 840,813 574,464 464,806 296,329 757,352 8,514,621 4.4%<br />
1980 375,388 4,116,482 1,543,826 786,922 582,195 516,890 312,203 742,223 8,976,129 4.2%<br />
1979 353,291 4,931,726 2,218,477 1,080,258 507,816 472,252 295,293 801,238 10,660,351 3.3%<br />
1978 274,876 5,404,504 2,662,926 1,249,845 441,800 339,364 242,241 694,855 11,310,411 2.4%<br />
1977 223,633 5,177,198 2,615,217 1,341,014 493,048 388,383 262,932 677,419 11,178,844 2.0%<br />
1976 150,929 4,811,199 2,286,181 1,380,912 346,900 270,103 201,760 657,766 10,105,750 1.5%<br />
1975 102,389 3,786,739 2,038,835 1,057,472 283,909 253,192 267,730 836,854 8,627,120 1.2%<br />
1974 43,119 3,754,813 2,291,148 1,246,561 238,135 189,026 334,423 754,731 8,851,956 0.5%<br />
1973 38,957 5,141,696 2,786,922 1,568,882 289,378 235,449 476,048 909,257 11,446,589 0.3%<br />
1972 20,500 4,893,234 2,761,341 1,566,768 295,915 192,707 485,645 727,292 10,943,402 0.2%<br />
1971 9,509 4,742,429 2,434,362 1,449,315 294,850 188,029 520,630 602,660 10,241,784 0.1%<br />
1970 4,195 3,294,174 2,209,687 1,353,304 196,749 104,067 567,602 673,279 8,403,057 0.05%<br />
1 Includes sales of <strong>Honda</strong> and Acura brand passenger cars. 2 Includes sales of Saab from 1997 through 2009. 3 Includes sales of Jaguar from 1997 through 2008, Volvo from 1998 through 2009.<br />
4 Includes sales of Mercedes from 1998 through 2006. 5 Includes sales of Toyota, Scion and Lexus brand passenger cars. 6 Includes sales of Nissan and Infiniti brand passenger cars. 7 Includes sales of Kia since 1998.<br />
Source: Ward’s Automotive Reports and company releases.<br />
3.4