Calibration of soil parameters for an elasto-plastic - Kempfert + ...
Calibration of soil parameters for an elasto-plastic - Kempfert + ...
Calibration of soil parameters for an elasto-plastic - Kempfert + ...

Create successful ePaper yourself
Turn your PDF publications into a flip-book with our unique Google optimized e-Paper software.
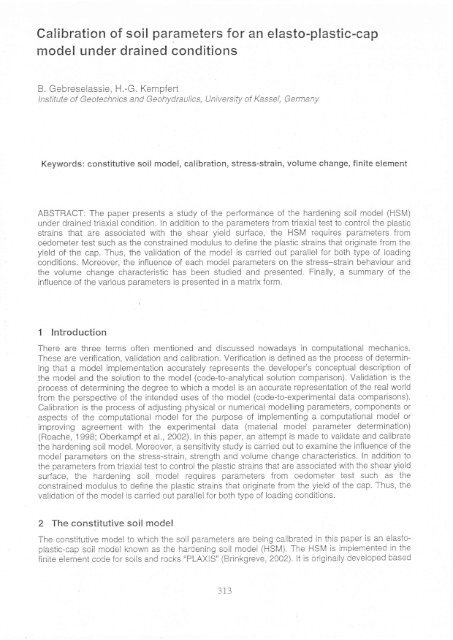
<strong>Calibration</strong> <strong>of</strong> <strong>soil</strong> <strong>parameters</strong> <strong>for</strong> <strong>an</strong> <strong>elasto</strong>-<strong>plastic</strong>-cap<br />
model under drained conditions<br />
B. Gebreselassie, H.-G. <strong>Kempfert</strong><br />
lnstituie <strong>of</strong> Geotechnics <strong>an</strong>d Geohydraulics, University <strong>of</strong> Kassel, Germ<strong>an</strong>y<br />
Keywords: constitutive <strong>soil</strong> model, calibration, stress-strain, volume ch<strong>an</strong>ge, finite element<br />
ABSTRACT: The paper presents a study <strong>of</strong> the per<strong>for</strong>m<strong>an</strong>ce <strong>of</strong> the hardening <strong>soil</strong> model (HSM)<br />
under drained triaxial condition. ln addition to the <strong>parameters</strong> from triaxial test to control the <strong>plastic</strong><br />
strains that are associated with the shear yield surface, the HSM requires <strong>parameters</strong> from<br />
oedometer test such as the constrained modulus to define the <strong>plastic</strong> strains thai originate from the<br />
yield <strong>of</strong> the cap. Thus, the validation <strong>of</strong> the model is carried out parallel <strong>for</strong> both type <strong>of</strong> loading<br />
conditions. Moreover, the influence <strong>of</strong> each model <strong>parameters</strong> on the stress-strain behaviour <strong>an</strong>d<br />
the volume ch<strong>an</strong>ge characteristic has been studied <strong>an</strong>d presented. Finally, a summary <strong>of</strong> the<br />
influence <strong>of</strong> the various <strong>parameters</strong> is presented in a matrix <strong>for</strong>m.<br />
1 lntroduction<br />
There are three terms <strong>of</strong>ten mentioned <strong>an</strong>d discussed nowadays in computational mech<strong>an</strong>ics.<br />
These are verification. validation <strong>an</strong>d calibration. Verification is defined as the process <strong>of</strong> determining<br />
that a model implementation accurately represents the developer's conceptual description <strong>of</strong><br />
the model <strong>an</strong>d the solution to the model (code{o-<strong>an</strong>alytical solution comparison). Validation is the<br />
process <strong>of</strong> determining the degree to which a model is <strong>an</strong> accurate representation <strong>of</strong> the real world<br />
from the perspective <strong>of</strong> the intended uses <strong>of</strong> the model (code-to-experimental data comparisons).<br />
<strong>Calibration</strong> is the process <strong>of</strong> adjusting physical or numerical modelling parameiers, components or<br />
aspects <strong>of</strong> the computational model <strong>for</strong> the purpose <strong>of</strong> implementing a computational model or<br />
improving agreement with the experimental data (material model parameter determination)<br />
(Roache, 1998; Oberkampf et al., 2002).ln this paper, <strong>an</strong> attempt is made to validate <strong>an</strong>d calibrate<br />
the hardening <strong>soil</strong> model. Moreover, a sensitivity study is carried out to examine the influence <strong>of</strong> the<br />
model <strong>parameters</strong> on the stress-strain, strength <strong>an</strong>d volume ch<strong>an</strong>ge characteristics. ln addition to<br />
the <strong>parameters</strong> from triaxial test to control the <strong>plastic</strong> strains that are associated with the shear yield<br />
sudace, the hardening soii model requires <strong>parameters</strong> from oedometer test such as the<br />
constrained modulus to define the piastic strains that originate from the yield <strong>of</strong> the cap. Thus, the<br />
validation <strong>of</strong> the model is carried out parallel <strong>for</strong> both type <strong>of</strong> loading conditions.<br />
2 The constitutive <strong>soil</strong> model<br />
The consiitutive model to which the soii <strong>parameters</strong> are being calibrated in this paper is <strong>an</strong> <strong>elasto</strong>piastic-cap<br />
<strong>soil</strong> mocjel known as the hardening <strong>soil</strong> model (HSM). The HSM ls implemented in the<br />
finite element code <strong>for</strong> <strong>soil</strong>s <strong>an</strong>d rocks "PLAXIS" (Brinkgreve ,2002).lt is originally developed based<br />
313
on the so calleci the Dunc<strong>an</strong>-Ch<strong>an</strong>g hyperbolic model. lt. however, supersedes the hyperbolic<br />
model, because it uses the <strong>plastic</strong>ity theory insiead <strong>of</strong> the elasticity theory, it includes the diaiai<strong>an</strong>cy<br />
<strong>soil</strong> behaviour <strong>an</strong>d it introduces the yield cap, The HSM also considers the stress depend<strong>an</strong>t<br />
stiffness <strong>of</strong> ihe <strong>soil</strong> according to the power law. The basic features <strong>of</strong> the HSM are listed in Table 1.<br />
For more <strong>an</strong>d detail ln<strong>for</strong>mation on the constitutive model <strong>an</strong>d the program PLAXIS refer to<br />
Brinkgreve eAA2).<br />
Type <strong>of</strong> mocjel: .<br />
Basic features: .<br />
Failure criterion:<br />
Flow rule:<br />
a<br />
a<br />
a<br />
a<br />
o<br />
Table 1. Basic features <strong>of</strong> the HSM<br />
<strong>elasto</strong>-plasiic strain hardening cap<br />
model<br />
stress dependent stiffness<br />
according to power law<br />
E = E'"'( :::::e^ ?*''lv'(<br />
\u uur9/T1, 'sinrp)<br />
<strong>plastic</strong> straining due to primary<br />
deviatoric loading<br />
<strong>plastic</strong> straining due to primary<br />
compression<br />
elastic unloading/ reloading<br />
hyperbolic stress-strain relation<br />
<strong>soil</strong> dilat<strong>an</strong>cy<br />
Mohr-coulomb<br />
non-associated in shear<br />
hardening<br />
3 The finite element model<br />
associated in compression hardening<br />
(cap)<br />
Staie <strong>of</strong> stress:<br />
Cap yield<br />
sudace:<br />
Hardening:<br />
Required <strong>soil</strong><br />
<strong>parameters</strong>:<br />
R<strong>an</strong>ge <strong>of</strong><br />
applrcatrons:<br />
. isotropic<br />
-u<br />
=2<br />
l,=--;t p'- p;'<br />
6<br />
4=o,+(6-J)'or-6'o,<br />
. ais a model parameter that<br />
relates to K6<br />
. pp is <strong>an</strong> isotropic<br />
pre-consolidation stress<br />
. p is the effective me<strong>an</strong> stress<br />
. c 3+sinto<br />
o =- 3 - sing<br />
. isotropic, shear <strong>an</strong>d<br />
compression<br />
. all types <strong>of</strong> <strong>soil</strong>s<br />
Ercf Ercl Tref<br />
Lst t L,,, ' LoPd . llt )<br />
The triaxialtest <strong>an</strong>d the oedometer test are simulated by me<strong>an</strong>s <strong>of</strong> <strong>an</strong> axisymmetric geometry, with<br />
the real dimension <strong>of</strong> the test set-up, that represent half <strong>of</strong> the <strong>soil</strong> sample (0.025 x 0.05 m in case<br />
<strong>of</strong> the triaxial test <strong>an</strong>d 0.035 x 0,02 m in case <strong>of</strong> oedometer test). ln the triaxial model, the displacements<br />
normal to the boundaries are fixed <strong>an</strong>d the t<strong>an</strong>geniial displacements are kept free to<br />
allow <strong>for</strong> smooth movements along the axis <strong>of</strong> symmetry (the left h<strong>an</strong>d side) <strong>an</strong>d the bottom<br />
boundaries. The top <strong>an</strong>d the right sidö boundaries ar,e fuliy free to move. Similarly, the displacements<br />
normal to the boundaribs äre fixed <strong>an</strong>'d the l<strong>an</strong>gential displacements are kept free to allow<br />
<strong>for</strong> smooth movements, along the axis <strong>of</strong> symmetry (the left h<strong>an</strong>d side) <strong>an</strong>d the right h<strong>an</strong>d side<br />
boundaries in the oedometer model. Both the normal <strong>an</strong>d t<strong>an</strong>gential displacements along the<br />
bottom boundary are fixed, wher'eas the top boundary is fully free to move.<br />
4 Validation <strong>of</strong> the Hardening Soil Model<br />
4.1 The <strong>soil</strong> <strong>parameters</strong><br />
The <strong>soil</strong> pai'ameters required <strong>for</strong> HSM are given in Table 2. They are obtained from extensive<br />
drained triaxial <strong>an</strong>d oedomeier test results conducied on undisiurbed specimen <strong>of</strong> lacustrine s<strong>of</strong>t<br />
<strong>soil</strong> (Gebreselassie, 2003). They are me<strong>an</strong> values <strong>of</strong> several tests <strong>an</strong>d they will serve as reference<br />
<strong>parameters</strong> in the following numerical compuraiions.<br />
?11<br />
JII
Tsat<br />
Table 2. Reference <strong>soil</strong> <strong>parameters</strong><br />
19.5 2s.3 tö.2 3253 2948 19170 100 0.63 0.83 0.573 0.20<br />
4.2 The caiculation<br />
The triaxial test procedure is modelled by me<strong>an</strong>s <strong>of</strong> app)ying first <strong>an</strong> all round confining pressure<br />
o, =50,100 <strong>an</strong>d 200 kN/m2 <strong>for</strong> three specimens respectively <strong>an</strong>d then by increasing the verlical<br />
stress by Ao up to failure. The choice <strong>of</strong> the three confining pressure makes possible the study o{<br />
the influence <strong>of</strong> the different <strong>soil</strong> <strong>parameters</strong> at the reference pressure P'"'=100 kN/m2 <strong>an</strong>d at<br />
stress level below <strong>an</strong>d above the reference pressure. Similar to the test condition, the following<br />
load increments are used in the FEM - simulation <strong>of</strong> the oedometer test: 10.8,20.1, 30, 69, 126,<br />
252, 126, 69, 10.8, 69, 126, 252,504, 756, 504, 1 26, 12.6 kNim2.<br />
ln order to study the effect <strong>of</strong> the different hardening <strong>soil</strong> model <strong>parameters</strong> on the stress-strain, the<br />
strength <strong>an</strong>d the volume-ch<strong>an</strong>ge behaviour <strong>of</strong> the <strong>soil</strong> specimens, several variations <strong>of</strong> the <strong>soil</strong><br />
<strong>parameters</strong> have been considered during the FEM-computations. These variations are listed in<br />
Table 3. The reference <strong>soil</strong> <strong>parameters</strong> are adopted from Table 2.<br />
Case Parameter variation Parameter variation<br />
FEM-1 reference <strong>parameters</strong> (Table 2))<br />
raf rzf<br />
Lsa Loed<br />
FEM-2 = FEM-1, but Eifr increased by a facior ot 1.25<br />
FEM-4 : FEM-1 , but Elit increased by a factor <strong>of</strong> 2.0<br />
FEM-6 = FEM-1, bui m = 033 (from oedometer test)<br />
FEM-8 = FEM-1 ,but E["!o- rl3'= 3253 kN/m2<br />
FEM-9 = FEM-1 ,buI E["io reduced by a factor <strong>of</strong> 0.75<br />
FEM-j 0 = FEM-1 , bur E[!o increased by a factor <strong>of</strong> 1 .25<br />
4.3 Analysis <strong>of</strong> the computation results<br />
Table 3. Variations <strong>of</strong> the HSM <strong>parameters</strong><br />
FEM.11<br />
FEN4-'12<br />
FEM-13<br />
FEM-14<br />
t- trtvt- I 3<br />
FEM.16<br />
FEM.17<br />
P<br />
Rf<br />
,.nc<br />
no<br />
= FEM-1 ,bul E'jt =3'E:i' = 9159 kN/m2<br />
= FEM-1, but Kf" increased to 0.71<br />
= FEM-'I, but Kj" reduced to 0.48<br />
= FEM-1 , but v,. = 919<br />
= FEM-1, but v,, = 939<br />
= FEM-] , but R, = 997<br />
= FEM-1, but F/ = 0.67<br />
4.3.1 Sfress-sfrain behaviour<br />
The stress strain relationship <strong>of</strong> the <strong>soil</strong> specimen from the FEM computation <strong>an</strong>d test results are<br />
presented in Figure '1. The test results are indicated with dashed lines <strong>an</strong>d the shaded regions<br />
show the r<strong>an</strong>ge <strong>of</strong> the variation <strong>of</strong> the test results. Since the hardening <strong>soil</strong> model requires <strong>soil</strong><br />
<strong>parameters</strong> both from the triaxial test <strong>an</strong>d one-dimensional compression test, the comparison <strong>of</strong> the<br />
FEM- results are presented parallel. <strong>for</strong> example, Figure 1a <strong>for</strong> the triaxial loading system <strong>an</strong>d<br />
Figure 1b <strong>for</strong> oedometer loading condition.<br />
Itwould appearfrom Figure lathatthe computational results <strong>of</strong> the triaxial model <strong>for</strong>the reference<br />
case (FEM-1) underestimate the stiffness <strong>of</strong> the <strong>soil</strong> specimen at <strong>an</strong> axial strain less th<strong>an</strong> 5 - 6 %<br />
<strong>for</strong> all cases <strong>of</strong> confining pressures. This might happen due to the fact that the hardening <strong>soil</strong><br />
model use the sec<strong>an</strong>t modulus {o instead <strong>of</strong> the initial t<strong>an</strong>gent modulus E, (E,=2'{r, see<br />
315
Gebreselassie, 2003). Such probiem may be overcome by introducing two hyperbola with two<br />
cjifferent stiffness iines (Am<strong>an</strong>n et al,, 1975), <strong>an</strong>d loading the specimen piecewise in two sieps each<br />
with diiferent ma'ierial sets (see also Gebreselassie. 2003). The FEM-simulation <strong>of</strong> the triaxial test,<br />
however, Iies reasonably wiihin the r<strong>an</strong>ge <strong>of</strong> variations <strong>of</strong> the test reSults <strong>for</strong> <strong>an</strong> axial strain greater<br />
th<strong>an</strong> 5 - 6%.<br />
On the contrary io the triaxiai simulation, the FEM-simulation <strong>of</strong> the oedometer (FEM-1)<br />
overestinnates the stiffness <strong>of</strong> the specimen up to a veftical strain <strong>of</strong> 7%, <strong>an</strong>d thereafter it joins the<br />
region <strong>of</strong> the r<strong>an</strong>ge <strong>of</strong> the test results (Figure 1b).<br />
The FEM simulates very well the un/reloading stiffness <strong>of</strong> the specimen in the triaxial loading condition,<br />
whereas it overestimates it in the oedometer loading condition. Lowering the unireloading<br />
modulus to E[ir =3.E:3t (FEM-11), which is given in PLAXIS as a default value, would result in<br />
underestimation <strong>of</strong> the un/reloading stiffness <strong>of</strong> the triaxial test. whereas it still overestimates it in<br />
the oedometer test <strong>for</strong> the 1st un/reloading at about a verlical pressure <strong>of</strong> 200 kN/m2, but much<br />
closer to the test result th<strong>an</strong> the reference case (FEM-1). For the 2nd un/reloading case at higher<br />
stress level in the oedometer test, the FEM simulation underestimates the un/reloading stiffness. lf<br />
one w<strong>an</strong>ts to keep the triaxial un/reloading stitfness unch<strong>an</strong>ged. since it match very well to the test<br />
results, <strong>an</strong>d on the other h<strong>an</strong>d to adjust it to the test results'in the oedometer simulation, the only<br />
possibility available is to vary the value <strong>of</strong> the Poisson's ratio <strong>for</strong> un/reloading v,r. This is the only<br />
parameter that influences the un/reloading behaviour <strong>of</strong> the one-dimensional compression without<br />
affecting much the un/reloading behaviour in the deviatoric state <strong>of</strong> stress.<br />
Aparl from its influence on the un/reloading behaviour <strong>of</strong> both test conditions, Ejir has no signifi-<br />
c<strong>an</strong>t influence on the stress-strain behaviour <strong>of</strong> the specimen during the 1st loading.<br />
The assumption Ejj, = EI;' (FEM-8), which is recommended in PLAXIS as a default value, has no<br />
signific<strong>an</strong>t influence on the deviatoric stress-strain behaviour, whereas it reacts stilfer in onedimensional<br />
compression (Figure 1). This approves that Elior is largely a compression hardening<br />
parameter (cap parameier). ln both loading systems, the assumption Ejlro - E:|t has no effect on<br />
the un/reloading stress -strain behaviour.<br />
Taking the value <strong>of</strong> the exponent rn = 0.83 (FEM-6) from oedometer test result instead <strong>of</strong> m = 0.63<br />
from triaxial test increases the stiffness <strong>of</strong> the <strong>soil</strong> specimen <strong>for</strong> a stress level above the reference<br />
pressure <strong>an</strong>d decreases the stiffness <strong>for</strong> a stress level below the reference pressure in both loading<br />
conditions (Figure 1) as expected. The optimal solution seems to lay between these values.<br />
N<br />
E<br />
z<br />
-Y<br />
N<br />
b<br />
I<br />
t,<br />
t/3<br />
150<br />
i25<br />
'100<br />
75<br />
s0<br />
25<br />
0<br />
5 10 '15 20 25<br />
Axial strain e, l%l<br />
-1<br />
l<br />
l<br />
.l<br />
ro ^\<br />
oJo<br />
-u<br />
.= IU<br />
L TII<br />
0<br />
2<br />
4<br />
b<br />
q<br />
io<br />
= LV IL<br />
O<br />
L 1A<br />
c) r+<br />
lb<br />
tö<br />
Test results .l<br />
---ei- FEM-] -l<br />
--€- FEM-6 _f<br />
---A- FEM-8 l<br />
=+ FEM-11 _l<br />
---l<br />
:.]<br />
-l<br />
I<br />
.l<br />
I<br />
_.i<br />
.l<br />
I<br />
I<br />
I<br />
I<br />
I<br />
I<br />
-1<br />
...-.1 -<br />
10 '100 1000<br />
Erfective consolidation stress o"" lkN/m'?]<br />
Figui'e 1. Calculated <strong>an</strong>d measured siress-sirain relationship: a) iriaxial iest, b) oedometer test<br />
316<br />
!
ii wouici appear fi'om Figui'e 1a that the de''riatoric ,qtress at failure remains unaffected by the<br />
variations oJ the <strong>parameters</strong> n , E,'Jo <strong>an</strong>d E[",r , although the strain at which the failure occur might<br />
be different. This is because ihe faiiure stress is mainly controlled by the shear parameiers c' <strong>an</strong>d<br />
rp' inlhe drained <strong>an</strong>alysis.<br />
4.3.1.1 lnfluence <strong>of</strong> the stiffness <strong>parameters</strong> E!f;r , E'.'Jo <strong>an</strong>d E[ir on stress-strain behavior:<br />
ln order to study the influence <strong>of</strong> the different hard <strong>soil</strong> model <strong>parameters</strong> on the stress - strain behavior<br />
<strong>of</strong> the <strong>soil</strong> specimen, various FEM - computations are conducted according to the cases<br />
Iisted in Tabie 2.The first group o{variations are the stiffness <strong>parameters</strong> E!3' , EL"J. <strong>an</strong>d Ejir.ln-<br />
creasing the value <strong>of</strong> E;3' by 25% (FEM-2) shifts the reference curve upwards <strong>an</strong>d parlly lies<br />
above the r<strong>an</strong>ge <strong>of</strong> the measured values, but it joins the reference curve as it approaches failure<br />
(Figure 2a). Elirt has no effect at all on the one-dimensional compression as shown in Figure 2b.<br />
On the other h<strong>an</strong>d, ch<strong>an</strong>ging the value oI Eflo by t25% (FEM-9 & 10) has no signific<strong>an</strong>t influence<br />
on the deviatoric stress, whereas it affects the stress -strain characteristics <strong>of</strong> the one-dimensional<br />
compression accordingly. This is a clear pro<strong>of</strong> <strong>of</strong> ihe fact that the parameter E["or is purely shear<br />
hardening parameter (shear yield surface), whereas the parameter f['!o is purely a compression<br />
hardening parameter (cap yield sudace).<br />
Although lowering the value <strong>of</strong> the parameter E[",r as much as 50% <strong>of</strong> the reference value (FEM-<br />
11)has no signific<strong>an</strong>t influence on the stress - strain curyes <strong>of</strong> both loading systems during the first<br />
loading, it affects both loading systems equally during un/reloading. Hence, Ej!/ is a parameter<br />
cornmon to both yield surfaces.<br />
N<br />
L<br />
zj<<br />
c\t<br />
b I<br />
i<br />
o<br />
0510152025<br />
Axial strain e., l%)<br />
*<br />
i<br />
d<br />
tr<br />
te<br />
tl<br />
t!<br />
rl<br />
ra<br />
ä<br />
--€- FEM-1<br />
--+- FEM-2<br />
---€- FEM-g<br />
FEM-10<br />
---a- FEM-11<br />
-o<br />
o\<br />
.'\<br />
0<br />
z<br />
4<br />
b<br />
L<br />
g10<br />
a<br />
812<br />
O<br />
L t^<br />
0)r+<br />
lb<br />
18<br />
Test<br />
resulis<br />
20<br />
10 100 1000<br />
Effective consolidation stress o," lkNim'?]<br />
Figure 2. The influence <strong>of</strong> the stiffness <strong>parameters</strong> EIio' , EfJo <strong>an</strong>d E[! on the stress-strain<br />
characteristics <strong>of</strong> a <strong>soil</strong> specimen a) triaxial case ( p'"r = 100 kN / m2 ), <strong>an</strong>d b) oedometer case<br />
371
. 1 . !-'t,'^^^. o'f the pafameterS ,.,,- , K[' <strong>an</strong>,l R, on stress,Sfrain behaviour:<br />
4.J. I .Z ll uluünut<br />
ln the second group <strong>of</strong> variatjon belong the <strong>parameters</strong> r/,, , K[' <strong>an</strong>d R, . Varying the value <strong>of</strong> vu,<br />
to 0.1 (FEM-14) <strong>an</strong>d to 0.3 (FEM-15) has no signific<strong>an</strong>t influence on the deviatoric primary loading<br />
<strong>an</strong>d un/reloading state <strong>of</strong> stress (Figure 3a), whereas it has a considerabie effect on the<br />
un/reloading siilfness <strong>of</strong> one dimensional compression (Figure 3b). Whereas lowering v,' to 0.1<br />
decreases the un/reloading stiflness <strong>an</strong>d fairly approaches the test result, increasing vu. to 0.3<br />
tends io increase the un/reloading stitfness <strong>an</strong>d diverges fufther from the test results. v,' is the<br />
single parameter that atlects the un/reloading stiffness <strong>of</strong> the one-dimensional compression without<br />
affecting the corresponding un/reloading stifiness <strong>of</strong> the deviatoric loading system. [f a match <strong>of</strong><br />
the computation <strong>an</strong>d the test results during the un/reloading state is desired, this is the suitable<br />
parameter <strong>for</strong> a variation to deal with.<br />
The HSM distinguishes between the model parameter K!" <strong>an</strong>d Ko which defines the initial state <strong>of</strong><br />
stresses. Since the initial stresses in the very small triaxial model will have no as such <strong>an</strong> influence<br />
on the stress-strain behaviour, it is assumed that Ki" = Ko. lncreasing the value <strong>of</strong> K[" by 25%<br />
(FEM-I3) results in a divergence <strong>of</strong> ihe stress - strain curve below the reference curve whereas<br />
decreasing itsvalue bythe same amount (FEM-12) Ieadsto <strong>an</strong> increase <strong>of</strong> the stiffness <strong>of</strong> the <strong>soil</strong><br />
above the reference value in both triaxial (Figure 3a) <strong>an</strong>d oedometer(Figure 3b) loading systems.<br />
However, the effect <strong>of</strong> varying Ki' seems to be stronger <strong>for</strong> the triaxial loading sysiem th<strong>an</strong> <strong>for</strong> the<br />
one-dimensional loading system. ln both cases, Ki" seems to have no signific<strong>an</strong>t influence on the<br />
un/reloding state <strong>of</strong> stress.<br />
The lines <strong>of</strong> the FEM-simulation <strong>of</strong> the variation <strong>of</strong> the influence <strong>of</strong> the failure factor ,Q, above<br />
(FEM-16) <strong>an</strong>d below (FEM-17) the reference value in Figure 3a, follows the course <strong>of</strong> the reference<br />
curve up to approximately <strong>an</strong> axial strain af 5% from which they starl to diverge upwards (FEM-17)<br />
<strong>an</strong>d downwards (FEM-16). lts final effect is to retard the failure in the case <strong>of</strong> increasing its value<br />
<strong>an</strong>d to accelerate it in the case <strong>of</strong> iowering its value. However, the influence <strong>of</strong> increasing ihe Rr<br />
value above the reference value seems to be larger th<strong>an</strong> the opposite one.<br />
N<br />
E<br />
zY<br />
N<br />
o<br />
l^<br />
I<br />
k)<br />
125<br />
100<br />
75<br />
s0<br />
25<br />
0<br />
0510152025<br />
Axial strain e, l%l<br />
Test results]<br />
--€-- FEM-i l<br />
---O- FEM-I2 i<br />
*--lr- FEN4-13 lI<br />
!<br />
l<br />
\7 trtr[/-1\ ]<br />
I<br />
--+- FEM- 16 l<br />
-)
4.3.2 \tolume ch<strong>an</strong>ge behavtour<br />
The voiume ch<strong>an</strong>ge behaviour <strong>of</strong> the specimen under drained triaxial test condition has also been<br />
studied by me<strong>an</strong>s <strong>of</strong> varying ihe <strong>soil</strong> <strong>parameters</strong> <strong>of</strong> the hardening <strong>soil</strong> model, The results <strong>of</strong> the<br />
element study against the test results <strong>for</strong> a specimen with a confining pressure <strong>of</strong> 100 kN/m2 are<br />
shown in Figure 4. lt c<strong>an</strong> be seen from ihis figure that the r<strong>an</strong>ge <strong>of</strong> the test results is very wide <strong>an</strong>d<br />
it is difficult to compare the computational result with the test result directly. However, one c<strong>an</strong> see<br />
the general tendency <strong>of</strong> the volume ch<strong>an</strong>ge behaviour from the test resulis <strong>an</strong>d the influence <strong>of</strong><br />
each parameter from the sensitivity study. From Figure 4, it would appear that all the <strong>parameters</strong> in<br />
one way or the other way may affect the voiume ch<strong>an</strong>ge behaviour <strong>of</strong> the specimen. The most<br />
sensitive <strong>parameters</strong> with regard to the volume ch<strong>an</strong>ge behaviour, however, are E'flo <strong>an</strong>d K:"<br />
(FEM-8,9 & 10) <strong>an</strong>d (FEM-I2 & 13), <strong>an</strong>d the least sensitive parameier is v-(FEM-I4 & 15). lt is<br />
interesting to see that increasing Ejfr value above the reference value increases the volumetric<br />
strain, when one expects the opposite result.<br />
-o<br />
o\<br />
c (u<br />
L<br />
a<br />
CJ<br />
c)<br />
E :f<br />
ö<br />
. iTq." \q/ --€i- FEM-1 ]<br />
1 ,t w*. ---)-- FEIü-2 \o o\<br />
, \N\'*--<br />
---*- FEM-4 I<br />
i N---------------€-FEM-7 ]<br />
2L \\\\\<br />
'I<br />
I NN=*\ l<br />
,L<br />
i Y ,=t)11 ]<br />
' i = iiü,j: \". = roo kN/m, ]<br />
i --+- FEM-11 *---r--=----*-<br />
6L - ' ' ' , , ' I<br />
051015242s<br />
Axial strain e, t%l<br />
'.!<br />
C<br />
'(ü<br />
L<br />
o<br />
C) '=<br />
c)<br />
E<br />
:f<br />
ö<br />
0510152025<br />
Axial strain e, l%l<br />
Figure 4. The influence <strong>of</strong> the HSM <strong>parameters</strong> on the volume ch<strong>an</strong>ge behavior <strong>of</strong> a <strong>soil</strong> specimen<br />
atconfining pressure <strong>of</strong> 100 kN/m2: a) stiffness <strong>parameters</strong>, E;]t , E'iJo, Ei,",' ,<strong>an</strong>d m,<br />
5 Summary<br />
b) other <strong>parameters</strong>: Kt" , R, <strong>an</strong>d vu,<br />
Test results<br />
---ti- rtrlvt- |<br />
--ä(- FEM-12<br />
-)
(say up to around 2.5"/" axial straln).<br />
E'fjo <strong>an</strong>d Kf" values appear to play the leading role in determining the volume ch<strong>an</strong>ge character-<br />
istic <strong>of</strong> ihe specimen in a triaxial compression, although all the other <strong>parameters</strong> with the exception<br />
<strong>of</strong> r?r contribute their par1. This <strong>an</strong>d the above discussion show the separate function <strong>of</strong> E'f"o as a<br />
cap parameter that controls ihe compression hardening <strong>an</strong>d Elior as a parameter that controls the<br />
shear hardening. The influence <strong>of</strong> the ditferent hardening <strong>soil</strong> model <strong>parameters</strong> on the stress<br />
strain, strength <strong>an</strong>d volume ch<strong>an</strong>ge behaviour <strong>of</strong> a <strong>soil</strong> specimen keeping the effective shear <strong>parameters</strong><br />
const<strong>an</strong>t is summarised in Table 4.<br />
Table 3. Summary <strong>of</strong> the results<br />
Stress - Sirain behaviour<br />
Soil T-:_--:^r !^^ri^^ ^^^ri+i^^ One-dimensional Volume strength at limit<br />
puräÄut.,. Triaxial loading condition compression ch<strong>an</strong>ge state<br />
E;:; /r'r' x t(x<br />
rrc[<br />
E oed<br />
Frcf<br />
m<br />
v<br />
K;"<br />
Rl<br />
r' lr'r'<br />
1r'r'<br />
XT<br />
r'r'r<br />
./i/ X<br />
{r'r' ,t<br />
,(<br />
x<br />
r'l/ r'l<br />
r'r'r'<br />
/r'l r'<br />
//r' =hasaconsiderabieeffect; y'y'=has<strong>an</strong>effect; y'=hasaslighteffect; X =hasnoeffect<br />
5 List <strong>of</strong> symbols <strong>an</strong>d abbreviatlons<br />
Ejir - sec<strong>an</strong>t modulus at 50% <strong>of</strong> the failure & = ratio <strong>of</strong> the stress at failure <strong>an</strong>d the<br />
stress <strong>an</strong>d at effective reference pressure <strong>of</strong> p'uf ultimate stress<br />
Eiito = .on.trained modulus ät p"f K;" = coefficient <strong>of</strong> the earth pressure at<br />
El" = un/reloading modulus ^t p'4 rest <strong>for</strong> normally consolidated <strong>soil</strong>s<br />
E = modulus <strong>of</strong> elasticity v,, = Poisson's ratio <strong>for</strong> un/reloading<br />
y"u, = saturated unit weight <strong>of</strong> <strong>soil</strong> v = Poisson's ratio<br />
A' = effective <strong>an</strong>gle <strong>of</strong> internal friction m = exponent in the power law<br />
ö = wallfriction HSM = Hardening Soil Model<br />
c' = effeciive cohesion MCM = Mohr-Coulomb Model<br />
7 References<br />
Am<strong>an</strong>n P., Breth H., <strong>an</strong>d Stroh D. 1975. Ver<strong>for</strong>mungsverhalien des Baugrundes beim Baugrubenaushub und <strong>an</strong>schließendem<br />
Hochhausbau am Beispiel des Fr<strong>an</strong>kfurlerTons. Technische Hochschule Darmstadt, Heft 15.<br />
Brinkgreve R.B.J. 2002. H<strong>an</strong>d book <strong>of</strong> the flniie element code <strong>for</strong> <strong>soil</strong> <strong>an</strong>d rock <strong>an</strong>alysis "PLAXIS". Balkema Publisher,<br />
Rotrerciam.<br />
Gebreselassie B. 2003. Experimental, <strong>an</strong>alficai <strong>an</strong>d numerical invesiigaiions <strong>of</strong> excavaiions in normally consolidated s<strong>of</strong>t <strong>soil</strong>s.<br />
Disseftaiion, University <strong>of</strong> Kassel. Schriftenreihe Geotechnik, Heft 14.<br />
Oberkampf W. L., Truc<strong>an</strong>o T. G., Hirsch C.20A2. Verification, Validation, <strong>an</strong>d prediciive capability in computaticnal engineering<br />
<strong>an</strong>d physics. Foundations <strong>for</strong> Veriflcation <strong>an</strong>d Vaiidaiion in the 21"tCentury Workshop, Johns Hopkins University, Laurel,<br />
Maryl<strong>an</strong>d.<br />
Roache P. J. 1998. Veriicaiion <strong>an</strong>d validation in comouiaiional science <strong>an</strong>d engineering. Hei-mosa Publishers. Albuquerque. NM.<br />
32;0<br />
x<br />
x<br />
l(<br />
x<br />
,(<br />
x<br />
ta<br />
x<br />
x<br />
x
Proceedings <strong>of</strong> the Eleventh lnternational Conference<br />
on Computer Methods <strong>an</strong>d Adv<strong>an</strong>ces in Geomech<strong>an</strong>ics<br />
TORINO / ITALY I 19-24 JUNE 2OO5<br />
Prediction, <strong>an</strong>alysis <strong>an</strong>d design in<br />
geomech<strong>an</strong>ical applications<br />
Edited by:<br />
Giov<strong>an</strong>ni Barla <strong>an</strong>d Marco Barla<br />
Depaftment <strong>of</strong> Structural <strong>an</strong>d Geotechnical Engineering,<br />
Politecnico di Torino, ltaly<br />
VOLUME 1<br />
pÄrnoru EDrroRE<br />
BOLOGNA 2OO5