1.3 – MEMÒRIA SOCIAL - Ajuntament de Roses
1.3 – MEMÒRIA SOCIAL - Ajuntament de Roses
1.3 – MEMÒRIA SOCIAL - Ajuntament de Roses

You also want an ePaper? Increase the reach of your titles
YUMPU automatically turns print PDFs into web optimized ePapers that Google loves.
3. Anàlisi econòmica<br />
3.1. Sectors d’activitat<br />
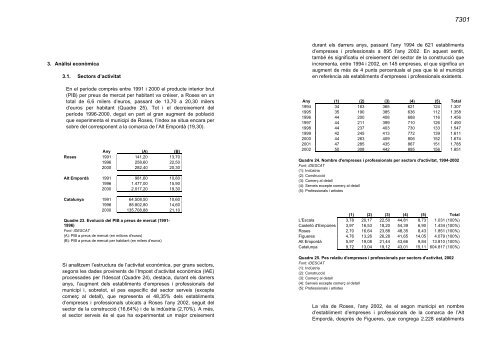
En el perío<strong>de</strong> comprès entre 1991 i 2000 el producte interior brut<br />
(PIB) per preus <strong>de</strong> mercat per habitant va créixer, a <strong>Roses</strong> en un<br />
total <strong>de</strong> 6,6 milers d’euros, passant <strong>de</strong> 13,70 a 20,30 milers<br />
d’euros per habitant (Quadre 25). Tot i el <strong>de</strong>creixement <strong>de</strong>l<br />
perío<strong>de</strong> 1996-2000, <strong>de</strong>gut en part al gran augment <strong>de</strong> població<br />
que experimenta el municipi <strong>de</strong> <strong>Roses</strong>, l’ín<strong>de</strong>x se situa encara per<br />
sobre <strong>de</strong>l corresponent a la comarca <strong>de</strong> l’Alt Empordà (19,30).<br />
Any (A) (B)<br />
<strong>Roses</strong> 1991 141,20 13,70<br />
1996 258,60 22,50<br />
2000 282,40 20,30<br />
Alt Empordà 1991 981,60 10,80<br />
1996 1.477,00 15,90<br />
2000 2.017,20 19,30<br />
Catalunya 1991 64.508,50 10,60<br />
1996 88.802,80 14,60<br />
2000 135.708,88 21,10<br />
Quadre 23. Evolució <strong>de</strong>l PIB a preus <strong>de</strong> mercat (1991-<br />
1996)<br />
Font: IDESCAT<br />
(A): PIB a preus <strong>de</strong> mercat (en milions d'euros)<br />
(B): PIB a preus <strong>de</strong> mercat per habitant (en milers d'euros)<br />
Si analitzem l’estructura <strong>de</strong> l’activitat econòmica, per grans sectors,<br />
segons les da<strong>de</strong>s provinents <strong>de</strong> l’Impost d’activitat econòmica (IAE)<br />
processa<strong>de</strong>s per l’I<strong>de</strong>scat (Quadre 24), <strong>de</strong>staca, durant els darrers<br />
anys, l’augment <strong>de</strong>ls establiments d’empreses i professionals <strong>de</strong>l<br />
municipi i, sobretot, el pes específic <strong>de</strong>l sector serveis (excepte<br />
comerç al <strong>de</strong>tall), que representa el 48,35% <strong>de</strong>ls establiments<br />
d’empreses i professionals ubicats a <strong>Roses</strong> l’any 2002, seguit <strong>de</strong>l<br />
sector <strong>de</strong> la construcció (16,64%) i <strong>de</strong> la indústria (2,70%). A més,<br />
el sector serveis és el que ha experimentat un major creixement<br />
durant els darrers anys, passant l’any 1994 <strong>de</strong> 621 establiments<br />
d’empreses i professionals a 895 l’any 2002. En aquest sentit,<br />
també és significatiu el creixement <strong>de</strong>l sector <strong>de</strong> la construcció que<br />
incrementa, entre 1994 i 2002, en 145 empreses, el que significa un<br />
augment <strong>de</strong> més <strong>de</strong> 4 punts percentuals el pes que té al municipi<br />
en referència als establiments d’empreses i professionals existents.<br />
Any (1) (2) (3) (4) (5) Total<br />
1994 34 163 365 621 124 <strong>1.3</strong>07<br />
1995 35 190 385 636 112 <strong>1.3</strong>58<br />
1996 44 200 408 688 116 1.456<br />
1997 44 211 399 710 126 1.490<br />
1998 44 237 403 730 133 1.547<br />
1999 42 245 413 772 139 1.611<br />
2000 44 263 409 806 152 1.674<br />
2001 47 285 435 867 151 1.785<br />
2002 50 308 442 895 156 1.851<br />
Quadre 24. Nombre d'empreses i professionals per sectors d'activitat, 1994-2002<br />
Font: IDESCAT<br />
(1): Indústria<br />
(2): Construcció<br />
(3): Comerç al <strong>de</strong>tall<br />
(4): Serveis excepte comerç al <strong>de</strong>tall<br />
(5): Professionals i artistes<br />
(1) (2) (3) (4) (5) Total<br />
L'Escala 3,78 20,17 22,50 44,81 8,73 1.031 (100%)<br />
Castelló d'Empúries 3,97 16,53 18,20 54,39 6,90 1.434 (100%)<br />
<strong>Roses</strong> 2,70 16,64 23,88 48,35 8,43 1.851 (100%)<br />
Figueres 4,76 13,26 26,28 41,65 14,05 4.079 (100%)<br />
Alt Empordà 5,97 19,08 21,44 43,66 9,84 13.810 (100%)<br />
Catalunya 9,72 13,04 19,12 43,01 15,11 604.817 (100%)<br />
Quadre 25. Pes relatiu d'empreses i professionals per sectors d'activitat, 2002<br />
Font: IDESCAT<br />
(1): Indústria<br />
(2): Construcció<br />
(3): Comerç al <strong>de</strong>tall<br />
(4): Serveis excepte comerç al <strong>de</strong>tall<br />
(5): Professionals i artistes<br />
7301<br />
La vila <strong>de</strong> <strong>Roses</strong>, l’any 2002, és el segon municipi en nombre<br />
d’establiment d’empreses i professionals <strong>de</strong> la comarca <strong>de</strong> l’Alt<br />
Empordà, <strong>de</strong>sprès <strong>de</strong> Figueres, que congrega 2.228 establiments