Descargue la revista aquí - Colegio Médico de Chile
Descargue la revista aquí - Colegio Médico de Chile
Descargue la revista aquí - Colegio Médico de Chile

You also want an ePaper? Increase the reach of your titles
YUMPU automatically turns print PDFs into web optimized ePapers that Google loves.
6. porcentaje con re<strong>la</strong>ción peso/tal<strong>la</strong> <strong>de</strong>ficiente en<br />
una o más DS, año 2003;<br />
7. porcentaje con re<strong>la</strong>ción peso/edad <strong>de</strong>ficiente en<br />
una o más DS, año 2003.<br />
8. porcentaje con re<strong>la</strong>ción tal<strong>la</strong>/edad <strong>de</strong>ficiente en<br />
una o más DS, año 2003<br />
Como indicador <strong>de</strong> <strong>la</strong> situación económica <strong>de</strong> <strong>la</strong>s<br />
familias se utilizó el porcentaje <strong>de</strong> pob<strong>la</strong>ción pobre <strong>de</strong>l<br />
territorio <strong>de</strong> cada Servicio <strong>de</strong> Salud, calcu<strong>la</strong>do a base<br />
<strong>de</strong> los datos comunales <strong>de</strong> <strong>la</strong> encuesta CASEN <strong>de</strong>l<br />
Ministerio <strong>de</strong> P<strong>la</strong>nificación, efectuada en el año 2000.<br />
Este Ministerio consi<strong>de</strong>ra en situación <strong>de</strong> pobreza a<br />
aquellos hogares cuyos ingresos son insuficientes<br />
para satisfacer <strong>la</strong>s necesida<strong>de</strong>s básicas, alimentarias y<br />
no alimentarias, <strong>de</strong> sus miembros (10) (Cuadro 1).<br />
Los datos antropométricos <strong>de</strong>l trienio 2000-2002<br />
se usaron por consi<strong>de</strong>rarse suficientemente estables y<br />
estar a<strong>de</strong>más próximos en el tiempo al año <strong>de</strong> registro<br />
<strong>de</strong>l dato <strong>de</strong> pobreza. Los datos <strong>de</strong>l 2003 se usaron<br />
para verificar <strong>la</strong> robustez <strong>de</strong> <strong>la</strong>s corre<strong>la</strong>ciones.<br />
El análisis consistió en <strong>la</strong> e<strong>la</strong>boración <strong>de</strong> los gráficos<br />
<strong>de</strong> corre<strong>la</strong>ción entre <strong>la</strong>s variables – obesidad,<br />
<strong>de</strong>snutrición y pobreza -, en el cálculo <strong>de</strong> coeficientes<br />
<strong>de</strong> corre<strong>la</strong>ción <strong>de</strong> Pearson, y en <strong>la</strong> exploración <strong>de</strong> <strong>la</strong>s<br />
re<strong>la</strong>ciones entre <strong>la</strong> antropometría infantil y <strong>la</strong> situación<br />
geográfica <strong>de</strong>l lugar <strong>de</strong> resi<strong>de</strong>ncia.<br />
RESULTADOS<br />
A. Obesidad, pobreza y geografía<br />
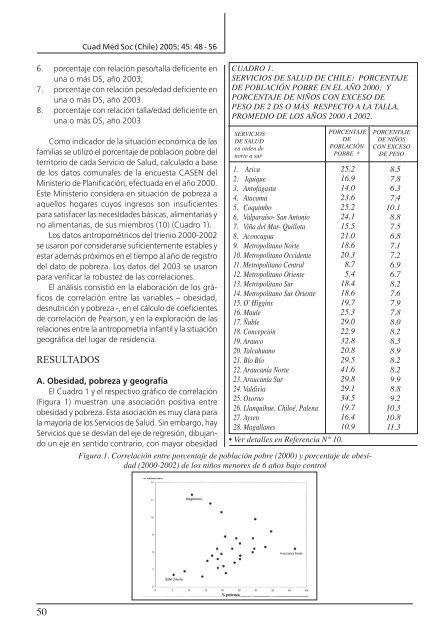
El Cuadro 1 y el respectivo gráfico <strong>de</strong> corre<strong>la</strong>ción<br />
(Figura 1) muestran una asociación positiva entre<br />
obesidad y pobreza. Esta asociación es muy c<strong>la</strong>ra para<br />
<strong>la</strong> mayoría <strong>de</strong> los Servicios <strong>de</strong> Salud. Sin embargo, hay<br />
Servicios que se <strong>de</strong>svían <strong>de</strong>l eje <strong>de</strong> regresión, dibujando<br />
un eje en sentido contrario, con mayor obesidad<br />
50<br />
Cuad Méd Soc (<strong>Chile</strong>) 2005; 45: 48 - 56<br />
CUADRO 1.<br />
SERVICIOS DE SALUD DE CHILE: PORCENTAJE<br />
DE POBLACIÓN POBRE EN EL AÑO 2000; Y<br />
PORCENTAJE DE NIÑOS CON EXCESO DE<br />
PESO DE 2 DS O MÁS RESPECTO A LA TALLA,<br />
PROMEDIO DE LOS AÑOS 2000 A 2002.<br />
SERVICIOS<br />
DE SALUD<br />
en or<strong>de</strong>n <strong>de</strong><br />
norte a sur<br />
1. Arica<br />
2. Iquique<br />
3. Antofagasta<br />
4. Atacama<br />
5. Coquimbo<br />
6. Valparaíso- San Antonio<br />
7. Viña <strong>de</strong>l Mar- Quillota<br />
8. Aconcagua<br />
9. Metropolitano Norte<br />
10. Metropolitano Occi<strong>de</strong>nte<br />
11. Metropolitano Central<br />
12. Metropolitano Oriente<br />
13. Metropolitano Sur<br />
14. Metropolitano Sur Oriente<br />
15. Oʼ Higgins<br />
16. Maule<br />
17. Ñuble<br />
18. Concepción<br />
19. Arauco<br />
20. Talcahuano<br />
21. Bío Bío<br />
22. Araucanía Norte<br />
23. Araucanía Sur<br />
24. Valdivia<br />
25. Osorno<br />
26. L<strong>la</strong>nquihue, Chiloé, Palena<br />
27. Aysen<br />
28. Magal<strong>la</strong>nes<br />
• Ver <strong>de</strong>talles en Referencia N° 10.<br />
PORCENTAJE<br />
DE<br />
POBLACIÓN<br />
POBRE *<br />
25.2<br />
16.9<br />
14.0<br />
23.6<br />
25.2<br />
24.1<br />
15.5<br />
21.0<br />
18.6<br />
20.3<br />
8.7<br />
5.4<br />
18.4<br />
18.6<br />
19.7<br />
25.3<br />
29.0<br />
22.9<br />
32.8<br />
20.8<br />
29.5<br />
41.6<br />
29.8<br />
29.1<br />
34.5<br />
19.7<br />
16.4<br />
10.9<br />
Figura 1. Corre<strong>la</strong>ción entre porcentaje <strong>de</strong> pob<strong>la</strong>ción pobre (2000) y porcentaje <strong>de</strong> obesidad<br />
(2000-2002) <strong>de</strong> los niños menores <strong>de</strong> 6 años bajo control<br />
PORCENTAJE<br />
DE NIÑOS<br />
CON EXCESO<br />
DE PESO<br />
8.5<br />
7.8<br />
6.3<br />
7.4<br />
10.1<br />
8.8<br />
7.5<br />
6.8<br />
7.1<br />
7.2<br />
6.9<br />
6.7<br />
8.2<br />
7.6<br />
7.9<br />
7.8<br />
8.0<br />
8.2<br />
8.3<br />
8.9<br />
8.2<br />
8.2<br />
9.9<br />
8.8<br />
9.2<br />
10.3<br />
10.8<br />
11.3