

CORRIENTES - Dirección de Estadística y Censos
CORRIENTES - Dirección de Estadística y Censos
CORRIENTES - Dirección de Estadística y Censos

Create successful ePaper yourself
Turn your PDF publications into a flip-book with our unique Google optimized e-Paper software.
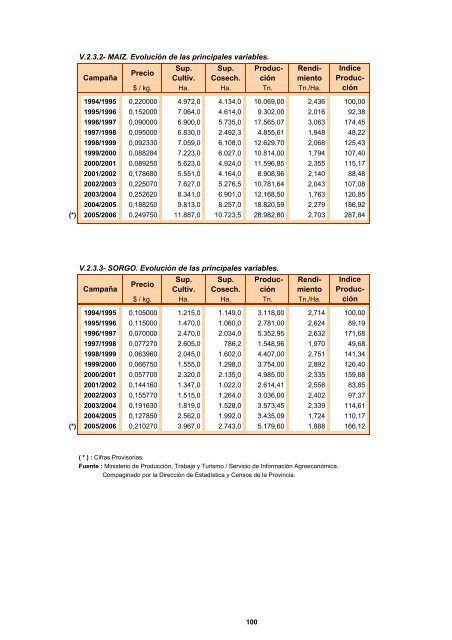
V.2.3.2- MAIZ. Evolución <strong>de</strong> las principales variables.<br />
Campaña<br />
Precio<br />
Sup.<br />
Cultiv.<br />
Sup.<br />
Cosech.<br />
ProducciónRendimiento<br />
$ / kg. Ha. Ha. Tn. Tn./Ha.<br />
1994/1995 0,220000 4.972,0 4.134,0 10.069,00 2,436 100,00<br />
1995/1996 0,152000 7.064,0 4.614,0 9.302,00 2,016 92,38<br />
1996/1997 0,090000 6.900,0 5.735,0 17.565,07 3,063 174,45<br />
1997/1998 0,095000 6.830,0 2.492,3 4.855,61 1,948 48,22<br />
1998/1999 0,092330 7.059,0 6.108,0 12.629,70 2,068 125,43<br />
1999/2000 0,088284 7.223,0 6.027,0 10.814,00 1,794 107,40<br />
2000/2001 0,089250 5.623,0 4.924,0 11.596,85 2,355 115,17<br />
2001/2002 0,178680 5.551,0 4.164,0 8.908,96 2,140 88,48<br />
2002/2003 0,225070 7.627,0 5.276,5 10.781,64 2,043 107,08<br />
2003/2004 0,252620 8.341,0 6.901,0 12.168,50 1,763 120,85<br />
2004/2005 0,188250 9.813,0 8.257,0 18.820,59 2,279 186,92<br />
(*) 2005/2006 0,249750 11.887,0 10.723,5 28.982,80 2,703 287,84<br />
V.2.3.3- SORGO. Evolución <strong>de</strong> las principales variables.<br />
Campaña<br />
Precio<br />
Sup.<br />
Cultiv.<br />
Sup.<br />
Cosech.<br />
ProducciónRendimiento<br />
$ / kg. Ha. Ha. Tn. Tn./Ha.<br />
1994/1995 0,105000 1.215,0 1.149,0 3.118,00 2,714 100,00<br />
1995/1996 0,115000 1.470,0 1.060,0 2.781,00 2,624 89,19<br />
1996/1997 0,070000 2.470,0 2.034,0 5.352,95 2,632 171,68<br />
1997/1998 0,077270 2.605,0 786,2 1.548,96 1,970 49,68<br />
1998/1999 0,063960 2.045,0 1.602,0 4.407,00 2,751 141,34<br />
1999/2000 0,066750 1.555,0 1.298,0 3.754,00 2,892 120,40<br />
2000/2001 0,057700 2.320,0 2.135,0 4.985,00 2,335 159,88<br />
2001/2002 0,144160 1.347,0 1.022,0 2.614,41 2,558 83,85<br />
2002/2003 0,155770 1.515,0 1.264,0 3.036,00 2,402 97,37<br />
2003/2004 0,191630 1.819,0 1.528,0 3.573,45 2,339 114,61<br />
2004/2005 0,127850 2.562,0 1.992,0 3.435,09 1,724 110,17<br />
(*) 2005/2006 0,210270 3.967,0 2.743,0 5.179,60 1,888 166,12<br />
( * ) : Cifras Provisorias.<br />
Fuente : Ministerio <strong>de</strong> Producción, Trabajo y Turismo / Servicio <strong>de</strong> Información Agroeconómica.<br />
Compaginado por la <strong>Dirección</strong> <strong>de</strong> <strong>Estadística</strong> y <strong>Censos</strong> <strong>de</strong> la Provincia.<br />
100<br />
Indice<br />
Producción<br />
Indice<br />
Producción