

CORRIENTES - Dirección de Estadística y Censos
CORRIENTES - Dirección de Estadística y Censos
CORRIENTES - Dirección de Estadística y Censos

Create successful ePaper yourself
Turn your PDF publications into a flip-book with our unique Google optimized e-Paper software.
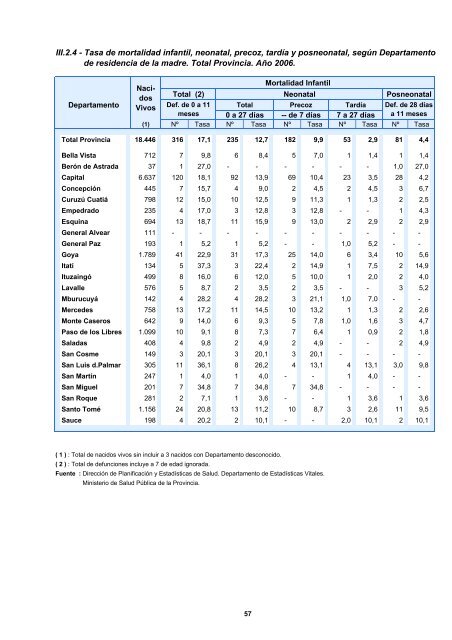
III.2.4 - Tasa <strong>de</strong> mortalidad infantil, neonatal, precoz, tardía y posneonatal, según Departamento<br />
<strong>de</strong> resi<strong>de</strong>ncia <strong>de</strong> la madre. Total Provincia. Año 2006.<br />
Departamento<br />
Nacidos<br />
Vivos<br />
Total (2)<br />
Def. <strong>de</strong> 0 a 11<br />
meses<br />
Mortalidad Infantil<br />
Neonatal<br />
Total Precoz<br />
0 a 27 días -- <strong>de</strong> 7 días<br />
Tardía<br />
7 a 27 días<br />
Posneonatal<br />
Def. <strong>de</strong> 28 días<br />
a 11 meses<br />
(1) Nº Tasa Nº Tasa Nº Tasa Nº Tasa Nº Tasa<br />
Total Provincia 18.446 316 17,1 235 12,7 182 9,9 53 2,9 81 4,4<br />
Bella Vista 712 7 9,8 6 8,4 5 7,0 1 1,4 1 1,4<br />
Berón <strong>de</strong> Astrada 37 1 27,0 - - - - - - 1,0 27,0<br />
Capital 6.637 120 18,1 92 13,9 69 10,4 23 3,5 28 4,2<br />
Concepción 445 7 15,7 4 9,0 2 4,5 2 4,5 3 6,7<br />
Curuzú Cuatiá 798 12 15,0 10 12,5 9 11,3 1 1,3 2 2,5<br />
Empedrado 235 4 17,0 3 12,8 3 12,8 - - 1 4,3<br />
Esquina 694 13 18,7 11 15,9 9 13,0 2 2,9 2 2,9<br />
General Alvear 111 - - - - - - - - - -<br />
General Paz 193 1 5,2 1 5,2 - - 1,0 5,2 - -<br />
Goya 1.789 41 22,9 31 17,3 25 14,0 6 3,4 10 5,6<br />
Itatí 134 5 37,3 3 22,4 2 14,9 1 7,5 2 14,9<br />
Ituzaingó 499 8 16,0 6 12,0 5 10,0 1 2,0 2 4,0<br />
Lavalle 576 5 8,7 2 3,5 2 3,5 - - 3 5,2<br />
Mburucuyá 142 4 28,2 4 28,2 3 21,1 1,0 7,0 - -<br />
Merce<strong>de</strong>s 758 13 17,2 11 14,5 10 13,2 1 1,3 2 2,6<br />
Monte Caseros 642 9 14,0 6 9,3 5 7,8 1,0 1,6 3 4,7<br />
Paso <strong>de</strong> los Libres 1.099 10 9,1 8 7,3 7 6,4 1 0,9 2 1,8<br />
Saladas 408 4 9,8 2 4,9 2 4,9 - - 2 4,9<br />
San Cosme 149 3 20,1 3 20,1 3 20,1 - - - -<br />
San Luis d.Palmar 305 11 36,1 8 26,2 4 13,1 4 13,1 3,0 9,8<br />
San Martín 247 1 4,0 1 4,0 - - 1 4,0 - -<br />
San Miguel 201 7 34,8 7 34,8 7 34,8 - - - -<br />
San Roque 281 2 7,1 1 3,6 - - 1 3,6 1 3,6<br />
Santo Tomé 1.156 24 20,8 13 11,2 10 8,7 3 2,6 11 9,5<br />
Sauce 198 4 20,2 2 10,1 - - 2,0 10,1 2 10,1<br />
( 1 ) : Total <strong>de</strong> nacidos vivos sin incluir a 3 nacidos con Departamento <strong>de</strong>sconocido.<br />
( 2 ) : Total <strong>de</strong> <strong>de</strong>funciones incluye a 7 <strong>de</strong> edad ignorada.<br />
Fuente : <strong>Dirección</strong> <strong>de</strong> Planificación y <strong>Estadística</strong>s <strong>de</strong> Salud. Departamento <strong>de</strong> <strong>Estadística</strong>s Vitales.<br />
Ministerio <strong>de</strong> Salud Pública <strong>de</strong> la Provincia.<br />
57