

CORRIENTES - Dirección de Estadística y Censos
CORRIENTES - Dirección de Estadística y Censos
CORRIENTES - Dirección de Estadística y Censos

Create successful ePaper yourself
Turn your PDF publications into a flip-book with our unique Google optimized e-Paper software.
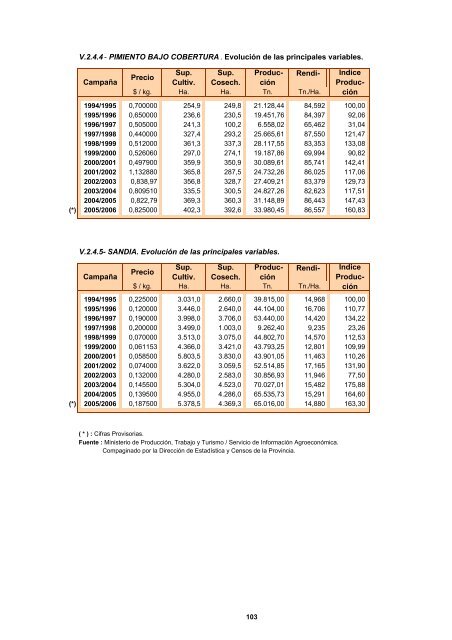
V.2.4.4 - PIMIENTO BAJO COBERTURA . Evolución <strong>de</strong> las principales variables.<br />
Campaña<br />
Precio<br />
Sup.<br />
Cultiv.<br />
Sup.<br />
Cosech.<br />
Producción<br />
Rendi-<br />
$ / kg. Ha. Ha. Tn. Tn./Ha.<br />
1994/1995 0,700000 254,9 249,8 21.128,44 84,592 100,00<br />
1995/1996 0,650000 236,6 230,5 19.451,76 84,397 92,06<br />
1996/1997 0,505000 241,3 100,2 6.558,02 65,462 31,04<br />
1997/1998 0,440000 327,4 293,2 25.665,61 87,550 121,47<br />
1998/1999 0,512000 361,3 337,3 28.117,55 83,353 133,08<br />
1999/2000 0,526060 297,0 274,1 19.187,86 69,994 90,82<br />
2000/2001 0,497900 359,9 350,9 30.089,61 85,741 142,41<br />
2001/2002 1,132880 365,8 287,5 24.732,26 86,025 117,06<br />
2002/2003 0,838,97 356,8 328,7 27.409,21 83,379 129,73<br />
2003/2004 0,809510 335,5 300,5 24.827,26 82,623 117,51<br />
2004/2005 0,822,79 369,3 360,3 31.148,89 86,443 147,43<br />
(*) 2005/2006 0,825000 402,3 392,6 33.980,45 86,557 160,83<br />
V.2.4.5- SANDIA. Evolución <strong>de</strong> las principales variables.<br />
Campaña<br />
Precio<br />
Sup.<br />
Cultiv.<br />
Sup.<br />
Cosech.<br />
Producción<br />
Rendi- Indice<br />
Produc-<br />
$ / kg. Ha. Ha. Tn. Tn./Ha. ción<br />
1994/1995 0,225000 3.031,0 2.660,0 39.815,00 14,968 100,00<br />
1995/1996 0,120000 3.446,0 2.640,0 44.104,00 16,706 110,77<br />
1996/1997 0,190000 3.998,0 3.706,0 53.440,00 14,420 134,22<br />
1997/1998 0,200000 3.499,0 1.003,0 9.262,40 9,235 23,26<br />
1998/1999 0,070000 3.513,0 3.075,0 44.802,70 14,570 112,53<br />
1999/2000 0,061153 4.366,0 3.421,0 43.793,25 12,801 109,99<br />
2000/2001 0,058500 5.803,5 3.830,0 43.901,05 11,463 110,26<br />
2001/2002 0,074000 3.622,0 3.059,5 52.514,85 17,165 131,90<br />
2002/2003 0,132000 4.280,0 2.583,0 30.856,93 11,946 77,50<br />
2003/2004 0,145500 5.304,0 4.523,0 70.027,01 15,482 175,88<br />
2004/2005 0,139500 4.955,0 4.286,0 65.535,73 15,291 164,60<br />
(*) 2005/2006 0,187500 5.378,5 4.369,3 65.016,00 14,880 163,30<br />
( * ) : Cifras Provisorias.<br />
Fuente : Ministerio <strong>de</strong> Producción, Trabajo y Turismo / Servicio <strong>de</strong> Información Agroeconómica.<br />
Compaginado por la <strong>Dirección</strong> <strong>de</strong> <strong>Estadística</strong> y <strong>Censos</strong> <strong>de</strong> la Provincia.<br />
103<br />
Indice<br />
Producción