

CORRIENTES - Dirección de Estadística y Censos
CORRIENTES - Dirección de Estadística y Censos
CORRIENTES - Dirección de Estadística y Censos

You also want an ePaper? Increase the reach of your titles
YUMPU automatically turns print PDFs into web optimized ePapers that Google loves.
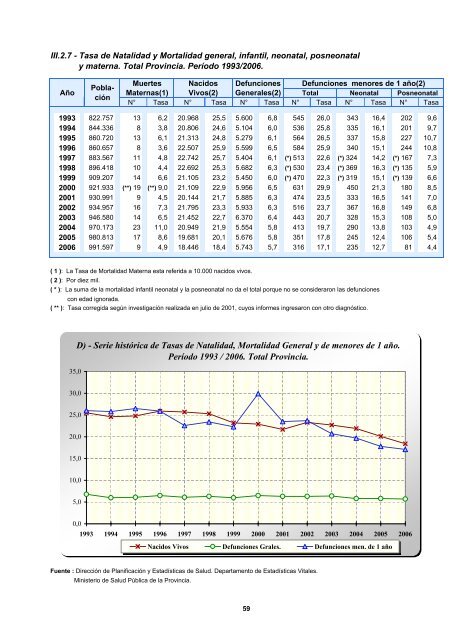
III.2.7 - Tasa <strong>de</strong> Natalidad y Mortalidad general, infantil, neonatal, posneonatal<br />
y materna. Total Provincia. Período 1993/2006.<br />
Muertes Nacidos Defunciones Defunciones menores <strong>de</strong> 1 año(2)<br />
Pobla-<br />
Año Maternas(1) Vivos(2) Generales(2) Total Neonatal Posneonatal<br />
ción<br />
N° Tasa N° Tasa N° Tasa N° Tasa N° Tasa N° Tasa<br />
1993 822.757 13 6,2 20.968 25,5 5.600 6,8 545 26,0 343 16,4 202 9,6<br />
1994 844.336 8 3,8 20.806 24,6 5.104 6,0 536 25,8 335 16,1 201 9,7<br />
1995 860.720 13 6,1 21.313 24,8 5.279 6,1 564 26,5 337 15,8 227 10,7<br />
1996 860.657 8 3,6 22.507 25,9 5.599 6,5 584 25,9 340 15,1 244 10,8<br />
1997 883.567 11 4,8 22.742 25,7 5.404 6,1 (*) 513 22,6 (*) 324 14,2 (*) 167 7,3<br />
1998 896.418 10 4,4 22.692 25,3 5.682 6,3 (*) 530 23,4 (*) 369 16,3 (*) 135 5,9<br />
1999 909.207 14 6,6 21.105 23,2 5.450 6,0 (*) 470 22,3 (*) 319 15,1 (*) 139 6,6<br />
2000 921.933 (**) 19 (**) 9,0 21.109 22,9 5.956 6,5 631 29,9 450 21,3 180 8,5<br />
2001 930.991 9 4,5 20.144 21,7 5.885 6,3 474 23,5 333 16,5 141 7,0<br />
2002 934.957 16 7,3 21.795 23,3 5.933 6,3 516 23,7 367 16,8 149 6,8<br />
2003 946.580 14 6,5 21.452 22,7 6.370 6,4 443 20,7 328 15,3 108 5,0<br />
2004 970.173 23 11,0 20.949 21,9 5.554 5,8 413 19,7 290 13,8 103 4,9<br />
2005 980.813 17 8,6 19.681 20,1 5.676 5,8 351 17,8 245 12,4 106 5,4<br />
2006 991.597 9 4,9 18.446 18,4 5.743 5,7 316 17,1 235 12,7 81 4,4<br />
( 1 ): La Tasa <strong>de</strong> Mortalidad Materna esta referida a 10.000 nacidos vivos.<br />
( 2 ): Por diez mil.<br />
( * ): La suma <strong>de</strong> la mortalidad infantil neonatal y la posneonatal no da el total porque no se consi<strong>de</strong>raron las <strong>de</strong>funciones<br />
con edad ignorada.<br />
( ** ): Tasa corregida según investigación realizada en julio <strong>de</strong> 2001, cuyos informes ingresaron con otro diagnóstico.<br />
35,0<br />
30,0<br />
25,0<br />
20,0<br />
15,0<br />
10,0<br />
D) - Serie histórica <strong>de</strong> Tasas <strong>de</strong> Natalidad, Mortalidad General y <strong>de</strong> menores <strong>de</strong> 1 año.<br />
Período 1993 / 2006. Total Provincia.<br />
5,0<br />
0,0<br />
1993 1994 1995 1996 1997 1998 1999 2000 2001 2002 2003 2004 2005 2006<br />
Nacidos Vivos Defunciones Grales. Defunciones men. <strong>de</strong> 1 año<br />
Fuente : <strong>Dirección</strong> <strong>de</strong> Planificación y <strong>Estadística</strong>s <strong>de</strong> Salud. Departamento <strong>de</strong> <strong>Estadística</strong>s Vitales.<br />
Ministerio <strong>de</strong> Salud Pública <strong>de</strong> la Provincia.<br />
59