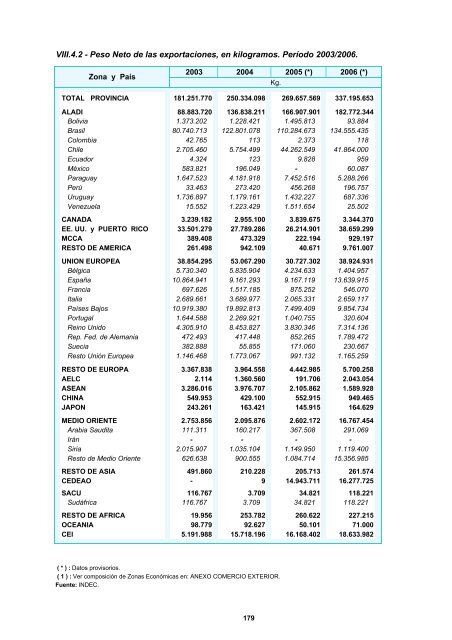
VIII.4.2 - Peso Neto <strong>de</strong> las exportaciones, en kilogramos. Período 2003/2006. Zona y País 2003 2004 2005 (*) 2006 (*) Kg. TOTAL PROVINCIA 181.251.770 250.334.098 269.657.569 337.195.653 ALADI 88.883.720 136.838.211 166.907.901 182.772.344 Bolivia 1.373.202 1.228.421 1.495.813 93.884 Brasil 80.740.713 122.801.078 110.284.673 134.555.435 Colombia 42.765 113 2.373 118 Chile 2.705.460 5.754.499 44.262.549 41.864.000 Ecuador 4.324 123 9.828 959 México 583.821 196.049 - 60.087 Paraguay 1.647.523 4.181.918 7.452.516 5.288.266 Perú 33.463 273.420 456.268 196.757 Uruguay 1.736.897 1.179.161 1.432.227 687.336 Venezuela 15.552 1.223.429 1.511.654 25.502 CANADA 3.239.182 2.955.100 3.839.675 3.344.370 EE. UU. y PUERTO RICO 33.501.279 27.789.286 26.214.901 38.659.299 MCCA 389.408 473.329 222.194 929.197 RESTO DE AMERICA 261.498 942.109 40.671 9.761.007 UNION EUROPEA 38.854.295 53.067.290 30.727.302 38.924.931 Bélgica 5.730.340 5.835.904 4.234.633 1.404.957 España 10.864.941 9.161.293 9.167.119 13.639.915 Francia 697.626 1.517.185 875.252 546.070 Italia 2.689.661 3.689.977 2.065.331 2.659.117 Países Bajos 10.919.380 19.892.813 7.499.409 9.854.734 Portugal 1.644.588 2.269.921 1.040.755 320.604 Reino Unido 4.305.910 8.453.827 3.830.346 7.314.136 Rep. Fed. <strong>de</strong> Alemania 472.493 417.448 852.265 1.789.472 Suecia 382.888 55.855 171.060 230.667 Resto Unión Europea 1.146.468 1.773.067 991.132 1.165.259 RESTO DE EUROPA 3.367.838 3.964.558 4.442.985 5.700.258 AELC 2.114 1.360.560 191.706 2.043.054 ASEAN 3.286.016 3.976.707 2.105.862 1.589.928 CHINA 549.953 429.100 552.915 949.465 JAPON 243.261 163.421 145.915 164.629 MEDIO ORIENTE 2.753.856 2.095.876 2.602.172 16.767.454 Arabia Saudita 111.311 160.217 367.508 291.069 Irán - - - - Siria 2.015.907 1.035.104 1.149.950 1.119.400 Resto <strong>de</strong> Medio Oriente 626.638 900.555 1.084.714 15.356.985 RESTO DE ASIA 491.860 210.228 205.713 261.574 CEDEAO - 9 14.943.711 16.277.725 SACU 116.767 3.709 34.821 118.221 Sudáfrica 116.767 3.709 34.821 118.221 RESTO DE AFRICA 19.956 253.782 260.622 227.215 OCEANIA 98.779 92.627 50.101 71.000 CEI 5.191.988 15.718.196 16.168.402 18.633.982 ( * ) : Datos provisorios. ( 1 ) : Ver composición <strong>de</strong> Zonas Económicas en: ANEXO COMERCIO EXTERIOR. Fuente: INDEC. 179
* Composición <strong>de</strong> las Zonas Económicas. Zona País integrante VIII - Comercio Exterior: ANEXO ALADI Asociación Latinoamericana <strong>de</strong> Integración: Bolivia, Brasil, Chile, Colombia, Ecuador, México, Paraguay, Perú, Uruguay y Venezuela; a partir <strong>de</strong> 1995 Zonas Francas <strong>de</strong>l Mercado Común <strong>de</strong>l Sur (MERCOSUR): <strong>de</strong> Uruguay: Colonia, Florida, Libertad, Montevi<strong>de</strong>o, Nueva Helvecia, Nueva Palmira, Río Negro, Rivera y San José. De Brasil: Manaos. ESTADOS UNIDOS Incluye: Puerto Rico, Estado Asociado y Territoritorios vinculados a EEUU. MCCA Mercado Común Centroamericano: Costa Rica, El Salvador; Guatemala, Honduras y Nicaragua. RESTO DE AMERICA Antigua y Barbuda, Bahamas, Barbados, Belice, Cuba, Dominica, Grenada, Guyana, Haití, Jamaica, Panamá, Rep. Dominicana, San Cristóbal y Nevis, San Vicente y las Granadinas, Suriname, Territ. vinc. a: Dinamarca, Francia, Países Bajos y Reino Unido; Trinidad y Tobago. UE Unión Europea (1): Bélgica, Dinamarca, España e Is. Canarias, Francia y Mónaco, Grecia, Italia, Irlanda, San Marino, Luxemburgo, Paises Bajos, Portugal, Reino Unido, Rep. Fe<strong>de</strong>ral <strong>de</strong> Alemania; a partir <strong>de</strong> 1995: Austria, Finlandia y Suecia. RESTO DE EUROPA Albania, Andorra, Bosnia-Herzegovina, Bulgaria, Chipre, Croacia, Eslovaquia, Eslovenia, Estonia, Hungría, Letonia, Lituania, Macedonia, Malta, Polonia, República Checa, Rumania, Santa Se<strong>de</strong>; Territ. vinc. a: Reino Unido, Turquía, Ucrania y Yugoeslavia (2). AELC Asociación Europea <strong>de</strong> Libre Comercio: Noruega, Islandia, Liechtenstein, Suiza. ASEAN Asociación <strong>de</strong> las Naciones <strong>de</strong>l Su<strong>de</strong>ste Asiático: Brunei, Filipinas, Indonesia, Malasia, Singapur, Tailandia; a partir <strong>de</strong> 1995: Vietman. MEDIO ORIENTE Arabia Saudita, Bahrein, Emiratos Arabes Unidos, Gaza, Iran, Iraq, Israel, Jordania, Kuwait, Líbano, Omán, Qatar, Rep. <strong>de</strong> Yemén y Siria. RESTO DE ASIA Afganistán, Azerbaidhan, Bangla<strong>de</strong>sh, Bután, Camboya, Corea Democrática, Corea Republicana, Georgia, India, Lao, Maldivas, Mongolia, Nepal, Paquistán, Sri Lanka, Taiwan, Territorios vinculados a: Portugal y Reino Unido; Unión <strong>de</strong> Myanmar. CEDEAO Comunidad Económica <strong>de</strong> los Estados <strong>de</strong> Africa Occi<strong>de</strong>ntal: Benin, Burkina Faso, Cabo Ver<strong>de</strong>, Costa <strong>de</strong> Marfil, Gambia, Ghana, Guinea, Guinea Bissau, Liberia, Malí, Mauritania, Niger, Nigeria, Senegal, Sierra Leona y Togo. SACU Unión Aduanera Sudafricana: Bostwana, Lesotho, Sudáfrica y Swazilandia. RESTO DE AFRICA Angola, Argelia, Burundi, Camerún, Chad, Comoras, Congo, Djibouti, Egipto, Eritrea, Etiopía, Gabón, Guinea Ecuatorial, Kenya, Libia, Madagascar, Malawi, Marruecos, Mauricio, Namibia, Mozambique, Rep. Centroafricana, Rwanda, Santo Tomé y Príncipe, Seychelles, Somalia, Sudán, Tanzania, Territ. vinc. a: España, Francia y a Reino Unido; Túnez, Uganda, Zambia y Zimbague. OCEANIA Australia, Fiji, Is. Marianas, Is. Marshall, Is. Salomón, Kiribati, Micronesia, Estados Fe<strong>de</strong>rados, Nauru, Nueva Zelanda, Palau, Papua Nueva Guinea, Samoa Occi<strong>de</strong>ntal; Territ. Vinculados a: Francia, Nueva Zelanda y a Estados Unidos; Tonga, Tuvalu, Vanuatu. CEI Comunidad <strong>de</strong> Estados In<strong>de</strong>pendientes: (3) Armenia, Bielorus, Kasajstan, Kirguistan, Moldova, Rusia, Tayikistan, Turmenistan, Uzbekistan. ( 1 ) : Hasta 1992 Comunidad Económica Europea, en 1993 Comunidad Europea, a partir <strong>de</strong> 1994 Unión Europea ( 2 ) : Compren<strong>de</strong> solamente Montenegro y Serbia ( 3 ) : Incluye países <strong>de</strong> Europa y Asia 180 <strong>Dirección</strong> <strong>de</strong> <strong>Estadística</strong> y <strong>Censos</strong> Pro vi nci a <strong>de</strong> C o rr ientes
- Page 2 and 3:
GOBIERNO DE LA PROVINCIA DE CORRIEN
- Page 4 and 5:
ARICA IQUIQUE TOCOPILLA ANTOFAGASTA
- Page 10 and 11:
¤ DEFINICIONES Y CONCEPTOS NECESID
- Page 12 and 13:
- Desocupados: son las personas que
- Page 14 and 15:
I N D I C E G E N E R A L Capítulo
- Page 16 and 17:
CONTENIDO: Pág. N°: I.1- Ubicaci
- Page 18 and 19:
I.3 - Hidrografía I.3.1 - Ríos Pr
- Page 20 and 21:
Por su carácter de periódicamente
- Page 22 and 23:
En este ambiente de exuberancia veg
- Page 24 and 25:
La encomienda -una forma encubierta
- Page 26 and 27:
1.7.4 - Ser correntino. Como consec
- Page 28 and 29:
CONTENIDO: Pág.N°: II.1 - Informa
- Page 30 and 31:
II.1.1 - Población total según se
- Page 32 and 33:
II.1.3 - Población total por grupo
- Page 34 and 35:
II.1.5 - Población en Localidades
- Page 36 and 37:
II.2 - Población según Censos Nac
- Page 38 and 39:
23 G) - Estructura de la Población
- Page 40 and 41:
II.2.2 - Evolución de la població
- Page 42 and 43:
II.3.1 - Población total según se
- Page 44 and 45:
II.3.2 - Población total por grupo
- Page 46 and 47:
II.4.2 - Porcentaje de población e
- Page 48 and 49:
Pág.N°: III.4.4- Porcentaje de ho
- Page 50 and 51:
III.1.2 - Población de 3 años y m
- Page 52 and 53:
III.1.3 - Población de 3 años y m
- Page 54 and 55:
III.1.5 - Población de 3 años y m
- Page 56 and 57:
III.1.6 - Población de 5 años y m
- Page 58 and 59:
43 III.1.8 - Población de 5 años
- Page 60 and 61:
45 III.1.8 - Población de 5 años
- Page 62 and 63:
III.1.9 - Población de 3 años y m
- Page 64 and 65:
III.1.10- Población de 5 años y m
- Page 66 and 67:
III.1.13 - Cargos Docentes en activ
- Page 68 and 69:
III.1.15 - Unidades ciclos, alumnos
- Page 70 and 71:
III.2 - Salud: Estadísticas Vitale
- Page 72 and 73:
III.2.4 - Tasa de mortalidad infant
- Page 74 and 75:
III.2.7 - Tasa de Natalidad y Morta
- Page 76 and 77:
III.3.2 - Cantidad de establecimien
- Page 78 and 79:
III.4.2 - Porcentaje de viviendas p
- Page 80 and 81:
III.4.4 - Porcentaje de hogares par
- Page 82 and 83:
III.4.6 - Distribución relativa de
- Page 84 and 85:
III.5.2 - Población de 14 años y
- Page 86 and 87:
III.5.3 - Población de 14 años y
- Page 88 and 89:
III.5.5 - Población de 14 años y
- Page 90 and 91:
III.6 - Seguridad y Asistencia Soci
- Page 92 and 93:
III.7 - Seguridad Pública. III.7.1
- Page 94 and 95:
Electores 640.000 620.000 600.000 5
- Page 96 and 97:
III.9.2 - Cantidad de plazas de est
- Page 98 and 99:
III.10.2 - Estado de Ejecución Pre
- Page 100 and 101:
IV.1 - Agricultura. Precios corrien
- Page 102 and 103:
IV.1.3 - FLORES Y ORNAMENTALES. Ser
- Page 104 and 105:
IV.2.2 - Indice autoponderado de pr
- Page 106 and 107:
V.4 - Censo Nacional Agropecuario.
- Page 108 and 109:
V.1- Ganadería. V.1.1- Existencias
- Page 110 and 111:
4.200.000 4.100.000 4.000.000 3.900
- Page 112 and 113:
V.2 - Agricultura. V.2.1 Producció
- Page 114 and 115:
V.2.3- CEREALES. Producción Agríc
- Page 116 and 117:
V.2.4- HORTICOLAS. Producción Agr
- Page 118 and 119:
V.2.4.4 - PIMIENTO BAJO COBERTURA .
- Page 120 and 121:
V.2.5.3- JAZMIN. Evolución de las
- Page 122 and 123:
V.2.6.3-TE. Evolución de las princ
- Page 124 and 125:
V.2.7.2- MANDARINA. Evolución de l
- Page 126 and 127:
V.3.2 Superficie solicitada a impla
- Page 128 and 129:
113 V.4.2 - Cantidad y superficie d
- Page 130 and 131:
115 V.4.3 - Cantidad y superficie d
- Page 132 and 133:
117 V.4.4 - Cantidad y superficie d
- Page 134 and 135:
119 V.4.5 - Distribución de la sup
- Page 136 and 137:
121 V.4.7 - Cantidad y superficie d
- Page 138 and 139:
V.4.9 - Superficie implantada en la
- Page 140 and 141:
125 V.4.10 - Superficie implantada
- Page 142 and 143:
127 V.4.11 - Superficie implantada
- Page 144 and 145: 129 V.4.12 - Superficie implantada
- Page 146 and 147: 131 V.4.13 - Superficie implantada
- Page 148 and 149: 133 V.4.14 - HORTALIZAS. Superficie
- Page 150 and 151: 135 V.4.16- FORRAJERAS PERENNES. Su
- Page 152 and 153: V.4.18 - VIVEROS. Superficie implan
- Page 154 and 155: V.4.20- Superficie implantada en si
- Page 156 and 157: V.4.22- Explotaciones agropecuarias
- Page 158 and 159: V.4.24 - BOVINOS. Rodeo de tambo, e
- Page 160 and 161: V.4.26- CAPRINOS. Existencias segú
- Page 162 and 163: V.4.28- EQUINOS. Composición del r
- Page 164 and 165: 149 V.4.30- TRACTORES según escala
- Page 166 and 167: 151 V.5 - CENSO NACIONAL ECONOMICO
- Page 168 and 169: V.6- Permisos de Edificación. V.6.
- Page 170 and 171: V.7.2- COMUNICACIONES. A - Teledens
- Page 172 and 173: Capítulo VI - PRODUCTO BRUTO GEOGR
- Page 174 and 175: 159 VI.2 - PRODUCTO BRUTO GEOGRAFIC
- Page 176 and 177: CONTENIDO: Capítulo VII - ACTIVIDA
- Page 178 and 179: VII.1.2 - Sector Público No Financ
- Page 180 and 181: VII.1.4 - Sector Privado No Financi
- Page 182 and 183: VII.1.2 - Sector Público No Financ
- Page 184 and 185: VII.1.4 - Sector Privado No Financi
- Page 186 and 187: VIII.1 - Exportaciones "desde" la P
- Page 188 and 189: U$S 90.000.000 80.000.000 70.000.00
- Page 190 and 191: VIII.3- Valor de las exportaciones
- Page 192 and 193: D) A España. 2003 2004 2005 (*) 20