

CORRIENTES - Dirección de Estadística y Censos
CORRIENTES - Dirección de Estadística y Censos
CORRIENTES - Dirección de Estadística y Censos

Create successful ePaper yourself
Turn your PDF publications into a flip-book with our unique Google optimized e-Paper software.
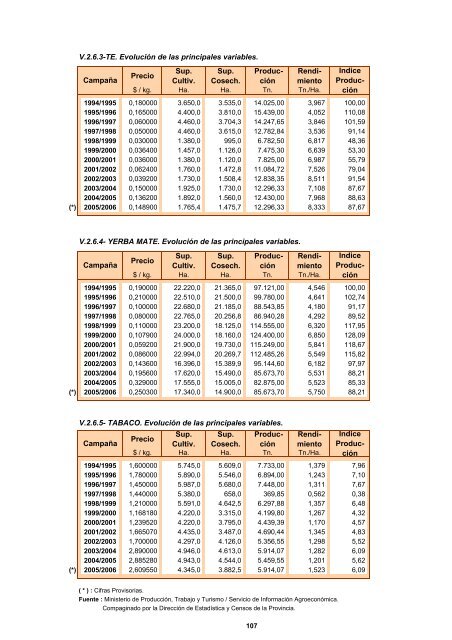
V.2.6.3-TE. Evolución <strong>de</strong> las principales variables.<br />
Campaña<br />
Precio<br />
Sup.<br />
Cultiv.<br />
Sup.<br />
Cosech.<br />
ProducciónRendimiento<br />
Indice<br />
Produc-<br />
$ / kg. Ha. Ha. Tn. Tn./Ha. ción<br />
1994/1995 0,180000 3.650,0 3.535,0 14.025,00 3,967 100,00<br />
1995/1996 0,165000 4.400,0 3.810,0 15.439,00 4,052 110,08<br />
1996/1997 0,060000 4.460,0 3.704,3 14.247,65 3,846 101,59<br />
1997/1998 0,050000 4.460,0 3.615,0 12.782,84 3,536 91,14<br />
1998/1999 0,030000 1.380,0 995,0 6.782,50 6,817 48,36<br />
1999/2000 0,036400 1.457,0 1.126,0 7.475,30 6,639 53,30<br />
2000/2001 0,036000 1.380,0 1.120,0 7.825,00 6,987 55,79<br />
2001/2002 0,062400 1.760,0 1.472,8 11.084,72 7,526 79,04<br />
2002/2003 0,039200 1.730,0 1.508,4 12.838,35 8,511 91,54<br />
2003/2004 0,150000 1.925,0 1.730,0 12.296,33 7,108 87,67<br />
2004/2005 0,136200 1.892,0 1.560,0 12.430,00 7,968 88,63<br />
(*) 2005/2006 0,148900 1.765,4 1.475,7 12.296,33 8,333 87,67<br />
V.2.6.4- YERBA MATE. Evolución <strong>de</strong> las principales variables.<br />
Campaña<br />
Precio<br />
Sup.<br />
Cultiv.<br />
Sup.<br />
Cosech.<br />
ProducciónRendimiento<br />
Indice<br />
Produc-<br />
$ / kg. Ha. Ha. Tn. Tn./Ha. ción<br />
1994/1995 0,190000 22.220,0 21.365,0 97.121,00 4,546 100,00<br />
1995/1996 0,210000 22.510,0 21.500,0 99.780,00 4,641 102,74<br />
1996/1997 0,100000 22.680,0 21.185,0 88.543,85 4,180 91,17<br />
1997/1998 0,080000 22.765,0 20.256,8 86.940,28 4,292 89,52<br />
1998/1999 0,110000 23.200,0 18.125,0 114.555,00 6,320 117,95<br />
1999/2000 0,107900 24.000,0 18.160,0 124.400,00 6,850 128,09<br />
2000/2001 0,059200 21.900,0 19.730,0 115.249,00 5,841 118,67<br />
2001/2002 0,086000 22.994,0 20.269,7 112.485,26 5,549 115,82<br />
2002/2003 0,143600 16.396,0 15.389,9 95.144,60 6,182 97,97<br />
2003/2004 0,195600 17.620,0 15.490,0 85.673,70 5,531 88,21<br />
2004/2005 0,329000 17.555,0 15.005,0 82.875,00 5,523 85,33<br />
(*) 2005/2006 0,250300 17.340,0 14.900,0 85.673,70 5,750 88,21<br />
V.2.6.5- TABACO. Evolución <strong>de</strong> las principales variables.<br />
Campaña<br />
Precio<br />
Sup.<br />
Cultiv.<br />
Sup.<br />
Cosech.<br />
ProducciónRendimiento<br />
Indice<br />
Produc-<br />
$ / kg. Ha. Ha. Tn. Tn./Ha. ción<br />
1994/1995 1,600000 5.745,0 5.609,0 7.733,00 1,379 7,96<br />
1995/1996 1,780000 5.890,0 5.546,0 6.894,00 1,243 7,10<br />
1996/1997 1,450000 5.987,0 5.680,0 7.448,00 1,311 7,67<br />
1997/1998 1,440000 5.380,0 658,0 369,85 0,562 0,38<br />
1998/1999 1,210000 5.591,0 4.642,5 6.297,88 1,357 6,48<br />
1999/2000 1,168180 4.220,0 3.315,0 4.199,80 1,267 4,32<br />
2000/2001 1,239520 4.220,0 3.795,0 4.439,39 1,170 4,57<br />
2001/2002 1,665070 4.435,0 3.487,0 4.690,44 1,345 4,83<br />
2002/2003 1,700000 4.297,0 4.126,0 5.356,55 1,298 5,52<br />
2003/2004 2,890000 4.946,0 4.613,0 5.914,07 1,282 6,09<br />
2004/2005 2,885280 4.943,0 4.544,0 5.459,55 1,201 5,62<br />
(*) 2005/2006 2,609550 4.345,0 3.882,5 5.914,07 1,523 6,09<br />
( * ) : Cifras Provisorias.<br />
Fuente : Ministerio <strong>de</strong> Producción, Trabajo y Turismo / Servicio <strong>de</strong> Información Agroeconómica.<br />
Compaginado por la <strong>Dirección</strong> <strong>de</strong> <strong>Estadística</strong> y <strong>Censos</strong> <strong>de</strong> la Provincia.<br />
107