

SPA_GED 2008_43_outlines.indd - Institut de statistique de l'Unesco
SPA_GED 2008_43_outlines.indd - Institut de statistique de l'Unesco
SPA_GED 2008_43_outlines.indd - Institut de statistique de l'Unesco

Create successful ePaper yourself
Turn your PDF publications into a flip-book with our unique Google optimized e-Paper software.
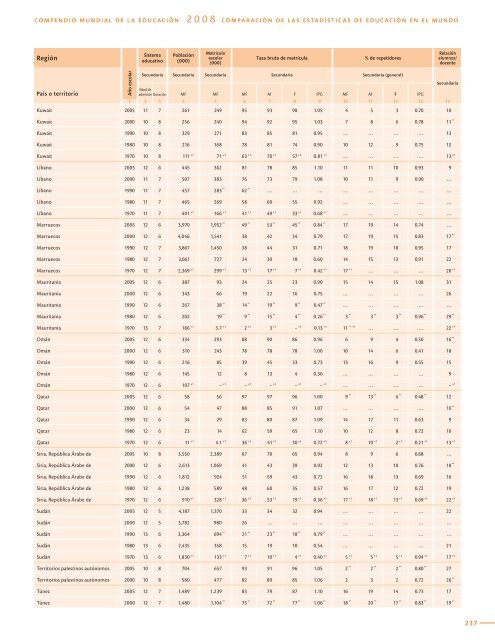
COMPENDIO MUNDIAL DE LA EDUCACIÓN<br />
<strong>2008</strong> COMPARACIÓN DE LAS ESTADÍSTICAS DE EDUCACIÓN EN EL MUNDO<br />
Región<br />
Sistema<br />
educativo<br />
Población<br />
(000)<br />
Matrícula<br />
escolar<br />
(000)<br />
Tasa bruta <strong>de</strong> matrícula<br />
% <strong>de</strong> repetidores<br />
Relación<br />
alumnos/<br />
docente<br />
País o territorio<br />
Año escolar<br />
Secundaria Secundaria Secundaria Secundaria Secundaria (general)<br />
Secundaria<br />
Edad <strong>de</strong><br />
admisión Duración MF MF MF M F IPG MF M F IPG<br />
1 2 3 4 5 6 7 8 9 10 11 12 13 14<br />
Kuwait 2005 11 7 261 249 95 93 98 1.05 4 5 3 0.70 10<br />
Kuwait 2000 10 8 256 240 94 92 95 1.03 7 8 6 0.78 11 **<br />
Kuwait 1990 10 8 329 271 83 85 81 0.95 … … … … 13<br />
Kuwait 1980 10 8 216 168 78 81 74 0.90 10 12 9 0.75 12<br />
Kuwait 1970 10 8 111 +1 71 +1 63 +1 70 +1 57 +1 0.81 +1 … … … … 13 +1<br />
Líbano 2005 12 6 445 362 81 78 85 1.10 11 11 10 0.93 9<br />
Líbano 2000 11 7 507 383 76 73 79 1.08 10 11 9 0.90 …<br />
Líbano 1990 11 7 457 283 ** 62 ** … … … … … … … …<br />
Líbano 1980 11 7 465 269 58 60 55 0.92 … … … … …<br />
Líbano 1970 11 7 401 +1 166 +1 41 +1 49 +1 33 +1 0.68 +1 … … … … …<br />
Marruecos 2005 12 6 3,970 1,952 ** 49 ** 53 ** 45 ** 0.84 ** 17 19 14 0.74 …<br />
Marruecos 2000 12 6 4,046 1,541 38 42 34 0.79 17 19 15 0.83 17 **<br />
Marruecos 1990 12 7 3,867 1,450 38 44 31 0.71 18 19 18 0.95 17<br />
Marruecos 1980 12 7 3,061 727 24 30 18 0.60 14 15 13 0.91 22<br />
Marruecos 1970 12 7 2,369 +1 299 +1 13 +1 17 +1 7 +1 0.42 +1 17 +1 … … … 20 +1<br />
Mauritania 2005 12 6 387 93 24 25 23 0.90 15 14 15 1.08 31<br />
Mauritania 2000 12 6 3<strong>43</strong> 66 19 22 16 0.75 … … … … 26<br />
Mauritania 1990 12 6 267 38 ** 14 ** 19 ** 9 ** 0.47 ** … … … … …<br />
Mauritania 1980 12 6 202 19 ** 9 ** 15 ** 4 ** 0.26 ** 3 ** 3 ** 3 ** 0.96 ** 29 **<br />
Mauritania 1970 13 7 186 +1 3.7 +1 2 +1 3 +1 - +1 0.13 +1 11 **, +1 … … … 22 +1<br />
Omán 2005 12 6 334 293 88 90 86 0.96 6 9 4 0.50 16 **<br />
Omán 2000 12 6 310 2<strong>43</strong> 78 78 78 1.00 10 14 6 0.41 18<br />
Omán 1990 12 6 216 85 39 45 33 0.73 13 16 9 0.55 15<br />
Omán 1980 12 6 145 12 8 13 4 0.30 … … … … 9<br />
Omán 1970 12 6 107 +1 - +1 - +1 - +1 - +1 - +1 … … … … - +1<br />
Qatar 2005 12 6 58 56 97 97 96 1.00 9 ** 13 ** 6 ** 0.48 ** 12<br />
Qatar 2000 12 6 54 47 88 85 91 1.07 … … … … 10 **<br />
Qatar 1990 12 6 34 29 83 80 87 1.09 14 17 11 0.63 9<br />
Qatar 1980 12 6 23 14 62 59 65 1.10 10 12 8 0.72 10<br />
Qatar 1970 12 6 11 +1 4.1 +1 36 +1 41 +1 30 +1 0.72 +1 8 +1 10 +1 2 +1 0.21 +1 13 +1<br />
Siria, República Árabe <strong>de</strong> 2005 10 8 3,550 2,389 67 70 65 0.94 8 9 6 0.68 …<br />
Siria, República Árabe <strong>de</strong> 2000 12 6 2,613 1,069 41 <strong>43</strong> 39 0.92 12 13 10 0.76 18 **<br />
Siria, República Árabe <strong>de</strong> 1990 12 6 1,812 924 51 59 <strong>43</strong> 0.72 16 18 13 0.69 16<br />
Siria, República Árabe <strong>de</strong> 1980 12 6 1,238 589 48 60 35 0.57 16 17 12 0.72 19<br />
Siria, República Árabe <strong>de</strong> 1970 12 6 910 +1 328 +1 36 +1 53 +1 19 +1 0.36 +1 17 +1 18 +1 13 +1 0.69 +1 22 +1<br />
Sudán 2005 12 5 4,187 1,370 33 34 32 0.94 … … … … 22<br />
Sudán 2000 12 5 3,782 980 26 … … … … … … … …<br />
Sudán 1990 13 6 3,364 694 ** 21 ** 23 ** 18 ** 0.79 ** … … … … …<br />
Sudán 1980 13 6 2,<strong>43</strong>5 358 15 19 10 0.54 … … … … 21<br />
Sudán 1970 13 6 1,830 +1 133 +1 7 +1 10 +1 4 +1 0.40 +1 5 +1 5 +1 5 +1 0.94 +1 17 +1<br />
Territorios palestinos autónomos 2005 10 8 704 657 93 91 96 1.05 2 ** 2 ** 2 ** 0.80 ** 27<br />
Territorios palestinos autónomos 2000 10 8 580 477 82 80 85 1.06 2 3 2 0.72 26 **<br />
Túnez 2005 12 7 1,489 1,239 83 79 87 1.10 16 19 14 0.73 17<br />
Túnez 2000 12 7 1,480 1,104 ** 75 ** 72 ** 77 ** 1.06 ** 18 ** 20 ** 17 ** 0.83 ** 19 **<br />
237


