Necesidades básicas - Instituto Nacional de EstadÃÂstica y Censo ...
Necesidades básicas - Instituto Nacional de EstadÃÂstica y Censo ...
Necesidades básicas - Instituto Nacional de EstadÃÂstica y Censo ...

Create successful ePaper yourself
Turn your PDF publications into a flip-book with our unique Google optimized e-Paper software.
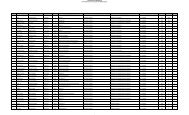
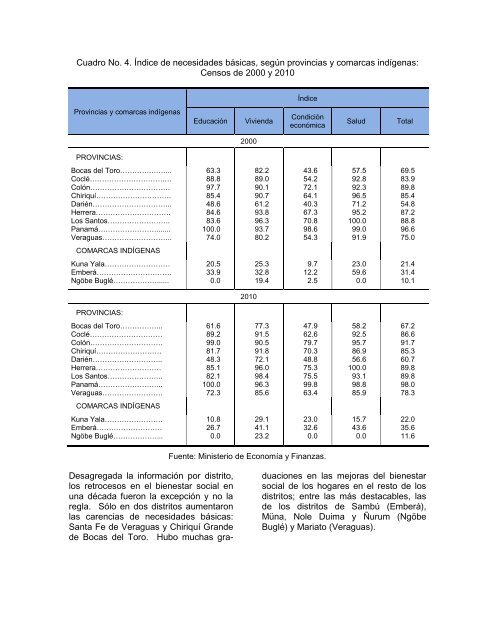
Cuadro No. 4. Índice <strong>de</strong> necesida<strong>de</strong>s básicas, según provincias y comarcas indígenas:<br />
<strong>Censo</strong>s <strong>de</strong> 2000 y 2010<br />
Índice<br />
Provincias y comarcas indígenas<br />
Educación<br />
Vivienda<br />
Condición<br />
económica<br />
Salud<br />
Total<br />
2000<br />
PROVINCIAS:<br />
Bocas <strong>de</strong>l Toro………….……... 63.3 82.2 43.6 57.5 69.5<br />
Coclé………………………….… 88.8 89.0 54.2 92.8 83.9<br />
Colón…………………………… 97.7 90.1 72.1 92.3 89.8<br />
Chiriquí…………………………. 85.4 90.7 64.1 96.5 85.4<br />
Darién…………………………... 48.6 61.2 40.3 71.2 54.8<br />
Herrera…………………………. 84.6 93.8 67.3 95.2 87.2<br />
Los Santos…………………….. 83.6 96.3 70.8 100.0 88.8<br />
Panamá……………………....... 100.0 93.7 98.6 99.0 96.6<br />
Veraguas……………………….. 74.0 80.2 54.3 91.9 75.0<br />
COMARCAS INDÍGENAS<br />
Kuna Yala……………………… 20.5 25.3 9.7 23.0 21.4<br />
Emberá…………………………. 33.9 32.8 12.2 59.6 31.4<br />
Ngöbe Buglé………………...... 0.0 19.4 2.5 0.0 10.1<br />
PROVINCIAS:<br />
2010<br />
Bocas <strong>de</strong>l Toro……………... 61.6 77.3 47.9 58.2 67.2<br />
Coclé………………………… 89.2 91.5 62.6 92.5 86.6<br />
Colón………………………… 99.0 90.5 79.7 95.7 91.7<br />
Chiriquí……………………… 81.7 91.8 70.3 86.9 85.3<br />
Darién……………………….. 48.3 72.1 48.8 56.6 60.7<br />
Herrera……………………… 85.1 96.0 75.3 100.0 89.8<br />
Los Santos………………….. 82.1 98.4 75.5 93.1 89.8<br />
Panamá……………………... 100.0 96.3 99.8 98.8 98.0<br />
Veraguas……………………. 72.3 85.6 63.4 85.9 78.3<br />
COMARCAS INDÍGENAS<br />
Kuna Yala…………………… 10.8 29.1 23.0 15.7 22.0<br />
Emberá……………………… 26.7 41.1 32.6 43.6 35.6<br />
Ngöbe Buglé………………... 0.0 23.2 0.0 0.0 11.6<br />
Fuente: Ministerio <strong>de</strong> Economía y Finanzas.<br />
Desagregada la información por distrito,<br />
los retrocesos en el bienestar social en<br />
una década fueron la excepción y no la<br />
regla. Sólo en dos distritos aumentaron<br />
las carencias <strong>de</strong> necesida<strong>de</strong>s básicas:<br />
Santa Fe <strong>de</strong> Veraguas y Chiriquí Gran<strong>de</strong><br />
<strong>de</strong> Bocas <strong>de</strong>l Toro. Hubo muchas graduaciones<br />
en las mejoras <strong>de</strong>l bienestar<br />
social <strong>de</strong> los hogares en el resto <strong>de</strong> los<br />
distritos; entre las más <strong>de</strong>stacables, las<br />
<strong>de</strong> los distritos <strong>de</strong> Sambú (Emberá),<br />
Müna, Nole Duima y Ñurum (Ngöbe<br />
Buglé) y Mariato (Veraguas).