Necesidades básicas - Instituto Nacional de EstadÃÂstica y Censo ...
Necesidades básicas - Instituto Nacional de EstadÃÂstica y Censo ...
Necesidades básicas - Instituto Nacional de EstadÃÂstica y Censo ...

Create successful ePaper yourself
Turn your PDF publications into a flip-book with our unique Google optimized e-Paper software.
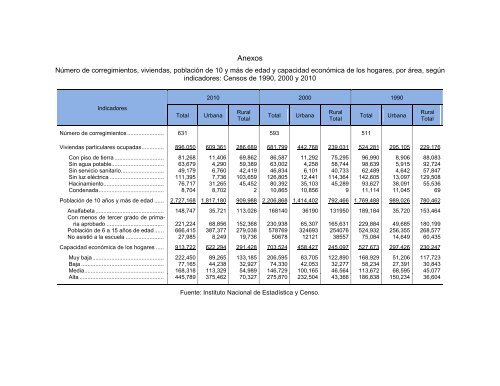
Anexos<br />
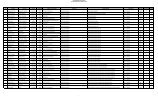
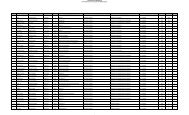
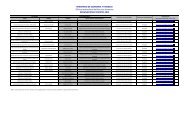
Número <strong>de</strong> corregimientos, viviendas, población <strong>de</strong> 10 y más <strong>de</strong> edad y capacidad económica <strong>de</strong> los hogares, por área, según<br />
indicadores: <strong>Censo</strong>s <strong>de</strong> 1990, 2000 y 2010<br />
2010 2000 1990<br />
Indicadores<br />
Total<br />
Urbana<br />
Rural<br />
Total<br />
Total<br />
Urbana<br />
Rural<br />
Total<br />
Total<br />
Urbana<br />
Rural<br />
Total<br />
Número <strong>de</strong> corregimientos ....................... 631 593 511<br />
Viviendas particulares ocupadas .............. 896,050 609,361 286,689 681,799 442,768 239,031 524,281 295,105 229,176<br />
Con piso <strong>de</strong> tierra ............................... 81,268 11,406 69,862 86,587 11,292 75,295 96,990 8,906 88,083<br />
Sin agua potable................................. 63,679 4,290 59,389 63,002 4,258 58,744 98,639 5,915 92,724<br />
Sin servicio sanitario ........................... 49,179 6,760 42,419 46,834 6,101 40,733 62,489 4,642 57,847<br />
Sin luz eléctrica .................................. 111,395 7,736 103,659 126,805 12,441 114,364 142,605 13,097 129,508<br />
Hacinamiento...................................... 76,717 31,265 45,452 80,392 35,103 45,289 93,627 38,091 55,536<br />
Con<strong>de</strong>nada ......................................... 8,704 8,702 2 10,865 10,856 9 11,114 11,045 69<br />
Población <strong>de</strong> 10 años y más <strong>de</strong> edad ...... 2,727,168 1,817,180 909,988 2,206,868 1,414,402 792,466 1,769,488 989,026 780,462<br />
Analfabeta ........................................... 148,747 35,721 113,026 168140 36190 131950 189,184 35,720 153,464<br />
Con menos <strong>de</strong> tercer grado <strong>de</strong> primaria<br />
aprobado .................................... 221,224 68,856 152,368 230,938 65,307 165,631 229,884 49,685 180,199<br />
Población <strong>de</strong> 6 a 15 años <strong>de</strong> edad ...... 666,415 387,377 279,038 578769 324693 254076 524,932 256,355 268,577<br />
No asistió a la escuela ........................ 27,985 8,249 19,736 50678 12121 38557 75,084 14,649 60,435<br />
Capacidad económica <strong>de</strong> los hogares ..... 913,722 622,294 291,428 703,524 458,427 245,097 527,673 297,426 230,247<br />
Muy baja ............................................. 222,450 89,265 133,185 206,595 83,705 122,890 168,929 51,206 117,723<br />
Baja .................................................... 77,165 44,238 32,927 74,330 42,053 32,277 58,234 27,391 30,843<br />
Media .................................................. 168,318 113,329 54,989 146,729 100,165 46,564 113,672 68,595 45,077<br />
Alta ..................................................... 445,789 375,462 70,327 275,870 232,504 43,366 186,838 150,234 36,604<br />
Fuente: <strong>Instituto</strong> <strong>Nacional</strong> <strong>de</strong> Estadística y <strong>Censo</strong>.