Necesidades básicas - Instituto Nacional de EstadÃÂstica y Censo ...
Necesidades básicas - Instituto Nacional de EstadÃÂstica y Censo ...
Necesidades básicas - Instituto Nacional de EstadÃÂstica y Censo ...

Create successful ePaper yourself
Turn your PDF publications into a flip-book with our unique Google optimized e-Paper software.
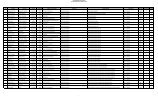
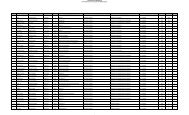
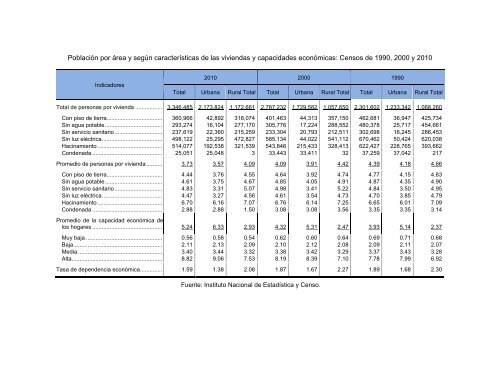
Población por área y según características <strong>de</strong> las viviendas y capacida<strong>de</strong>s económicas: <strong>Censo</strong>s <strong>de</strong> 1990, 2000 y 2010<br />
Indicadores<br />
2010 2000 1990<br />
Total Urbana Rural Total Total Urbana Rural Total Total Urbana Rural Total<br />
Total <strong>de</strong> personas por vivienda ................. 3,346,485 2,173,824 1,172,661 2,787,232 1,729,582 1,057,650 2,301,602 1,233,342 1,068,260<br />
Con piso <strong>de</strong> tierra................................... 360,966 42,892 318,074 401,463 44,313 357,150 462,681 36,947 425,734<br />
Sin agua potable .................................... 293,274 16,104 277,170 305,776 17,224 288,552 480,378 25,717 454,661<br />
Sin servicio sanitario .............................. 237,619 22,360 215,259 233,304 20,793 212,511 302,698 16,245 286,453<br />
Sin luz eléctrica ...................................... 498,122 25,295 472,827 585,134 44,022 541,112 670,462 50,424 620,038<br />
Hacinamiento ......................................... 514,077 192,538 321,539 543,846 215,433 328,413 622,427 228,765 393,662<br />
Con<strong>de</strong>nada ............................................ 25,051 25,048 3 33,443 33,411 32 37,259 37,042 217<br />
Promedio <strong>de</strong> personas por vivienda .......... 3.73 3.57 4.09 4.09 3.91 4.42 4.39 4.18 4.66<br />
Con piso <strong>de</strong> tierra................................... 4.44 3.76 4.55 4.64 3.92 4.74 4.77 4.15 4.83<br />
Sin agua potable .................................... 4.61 3.75 4.67 4.85 4.05 4.91 4.87 4.35 4.90<br />
Sin servicio sanitario .............................. 4.83 3.31 5.07 4.98 3.41 5.22 4.84 3.50 4.95<br />
Sin luz eléctrica ...................................... 4.47 3.27 4.56 4.61 3.54 4.73 4.70 3.85 4.79<br />
Hacinamiento ......................................... 6.70 6.16 7.07 6.76 6.14 7.25 6.65 6.01 7.09<br />
Con<strong>de</strong>nada ............................................ 2.88 2.88 1.50 3.08 3.08 3.56 3.35 3.35 3.14<br />
Promedio <strong>de</strong> la capacidad económica <strong>de</strong><br />
los hogares ............................................ 5.24 6.33 2.93 4.32 5.31 2.47 3.93 5.14 2.37<br />
Muy baja ................................................ 0.56 0.58 0.54 0.62 0.60 0.64 0.69 0.71 0.68<br />
Baja ........................................................ 2.11 2.13 2.09 2.10 2.12 2.08 2.09 2.11 2.07<br />
Media ..................................................... 3.40 3.44 3.32 3.38 3.42 3.29 3.37 3.43 3.28<br />
Alta ......................................................... 8.82 9.06 7.53 8.19 8.39 7.10 7.78 7.99 6.92<br />
Tasa <strong>de</strong> <strong>de</strong>pen<strong>de</strong>ncia económica .............. 1.59 1.38 2.08 1.87 1.67 2.27 1.89 1.68 2.30<br />
Fuente: <strong>Instituto</strong> <strong>Nacional</strong> <strong>de</strong> Estadística y <strong>Censo</strong>.