- Page 2 and 3:
La Portada Fotografía tomada en la
- Page 4 and 5:
Los felinos silvestres del departam
- Page 6 and 7:
www.mastozoologiamexicana.org
- Page 8 and 9:
A NEW SPECIES OF PHYLLOTIS FROM THE
- Page 10 and 11:
SINOPSIS DE LOS MAMÍFEROS SILVESTR
- Page 12 and 13:
SINOPSIS DE LOS MAMÍFEROS SILVESTR
- Page 14 and 15:
SINOPSIS DE LOS MAMÍFEROS SILVESTR
- Page 16 and 17:
SINOPSIS DE LOS MAMÍFEROS SILVESTR
- Page 18 and 19:
SINOPSIS DE LOS MAMÍFEROS SILVESTR
- Page 20 and 21:
SINOPSIS DE LOS MAMÍFEROS SILVESTR
- Page 22 and 23:
SINOPSIS DE LOS MAMÍFEROS SILVESTR
- Page 24 and 25:
SINOPSIS DE LOS MAMÍFEROS SILVESTR
- Page 26 and 27:
SINOPSIS DE LOS MAMÍFEROS SILVESTR
- Page 28 and 29:
SINOPSIS DE LOS MAMÍFEROS SILVESTR
- Page 30 and 31:
SINOPSIS DE LOS MAMÍFEROS SILVESTR
- Page 32 and 33:
SINOPSIS DE LOS MAMÍFEROS SILVESTR
- Page 34 and 35:
SINOPSIS DE LOS MAMÍFEROS SILVESTR
- Page 36 and 37:
SINOPSIS DE LOS MAMÍFEROS SILVESTR
- Page 38 and 39:
SINOPSIS DE LOS MAMÍFEROS SILVESTR
- Page 40 and 41:
SINOPSIS DE LOS MAMÍFEROS SILVESTR
- Page 42 and 43:
SINOPSIS DE LOS MAMÍFEROS SILVESTR
- Page 44 and 45:
SINOPSIS DE LOS MAMÍFEROS SILVESTR
- Page 46 and 47:
SINOPSIS DE LOS MAMÍFEROS SILVESTR
- Page 48 and 49:
SINOPSIS DE LOS MAMÍFEROS SILVESTR
- Page 50 and 51:
SINOPSIS DE LOS MAMÍFEROS SILVESTR
- Page 52 and 53:
SINOPSIS DE LOS MAMÍFEROS SILVESTR
- Page 54 and 55:
SINOPSIS DE LOS MAMÍFEROS SILVESTR
- Page 56 and 57:
SINOPSIS DE LOS MAMÍFEROS SILVESTR
- Page 58 and 59:
SINOPSIS DE LOS MAMÍFEROS SILVESTR
- Page 60 and 61:
SINOPSIS DE LOS MAMÍFEROS SILVESTR
- Page 63 and 64:
Activity Patterns of White-tailed d
- Page 65 and 66:
García et al. en invierno y el má
- Page 67 and 68:
García et al. (machos y hembras) c
- Page 69 and 70:
García et al. Tabla 2. Resultados
- Page 71 and 72:
García et al. En la misma zona ár
- Page 73 and 74:
García et al. Agradecimientos Lite
- Page 75 and 76:
García et al. Kamler, J. F., B. Jx
- Page 77 and 78:
Carnivores of the Sierra de Quila F
- Page 79 and 80:
Ramírez-Martínez, Iñiguez-Dával
- Page 81 and 82:
Ramírez-Martínez, Iñiguez-Dával
- Page 83 and 84:
Ramírez-Martínez, Iñiguez-Dával
- Page 85 and 86:
Ramírez-Martínez, Iñiguez-Dával
- Page 87 and 88:
Ramírez-Martínez, Iñiguez-Dával
- Page 89 and 90:
Estimación de la edad en el delfí
- Page 91 and 92:
Gallo-Reynoso, Francisco y Ortiz Me
- Page 93 and 94:
Gallo-Reynoso, Francisco y Ortiz Re
- Page 95 and 96:
Gallo-Reynoso, Francisco y Ortiz Di
- Page 97 and 98:
Gallo-Reynoso, Francisco y Ortiz Ac
- Page 99 and 100:
Gallo-Reynoso, Francisco y Ortiz 22
- Page 101 and 102:
Analysis of the papers presented at
- Page 103 and 104:
Briones-Salas et al un evento cuya
- Page 105 and 106:
Briones-Salas et al En cuanto a los
- Page 107 and 108:
Briones-Salas et al De acuerdo a lo
- Page 109 and 110:
Briones-Salas et al postgrado en ci
- Page 111 and 112:
Briones-Salas et al estatal, princi
- Page 113 and 114:
Briones-Salas et al Otro factor que
- Page 115 and 116:
Briones-Salas et al Agradecimientos
- Page 117 and 118:
Briones-Salas et al Vol. II, Asocia
- Page 119 and 120:
Briones-Salas et al N % Especies No
- Page 121 and 122:
A new species of Leaf-eared Mouse,
- Page 123 and 124:
Pacheco, Rengifo and Vivas Material
- Page 125 and 126:
Pacheco, Rengifo and Vivas Figure 1
- Page 127 and 128:
Pacheco, Rengifo and Vivas vibrissa
- Page 129 and 130:
Pacheco, Rengifo and Vivas conditio
- Page 131 and 132:
Pacheco, Rengifo and Vivas procingu
- Page 133 and 134:
Pacheco, Rengifo and Vivas gerbillu
- Page 135 and 136: Pacheco, Rengifo and Vivas Phylloti
- Page 137 and 138: Pacheco, Rengifo and Vivas P. anita
- Page 139 and 140: Pacheco, Rengifo and Vivas The kary
- Page 141 and 142: Pacheco, Rengifo and Vivas Acknowle
- Page 143 and 144: Pacheco, Rengifo and Vivas the Life
- Page 145 and 146: Pacheco, Rengifo and Vivas Salazar-
- Page 147: Pacheco, Rengifo and Vivas 30’ 27
- Page 150 and 151: AGE STRUCTURE AND REPRODUCTION IN W
- Page 152 and 153: AGE STRUCTURE AND REPRODUCTION IN W
- Page 154 and 155: AGE STRUCTURE AND REPRODUCTION IN W
- Page 156 and 157: AGE STRUCTURE AND REPRODUCTION IN W
- Page 158 and 159: AGE STRUCTURE AND REPRODUCTION IN W
- Page 160 and 161: AGE STRUCTURE AND REPRODUCTION IN W
- Page 162 and 163: AGE STRUCTURE AND REPRODUCTION IN W
- Page 164 and 165: AGE STRUCTURE AND REPRODUCTION IN W
- Page 166 and 167: AGE STRUCTURE AND REPRODUCTION IN W
- Page 168 and 169: AGE STRUCTURE AND REPRODUCTION IN W
- Page 170 and 171: AGE STRUCTURE AND REPRODUCTION IN W
- Page 172 and 173: AGE STRUCTURE AND REPRODUCTION IN W
- Page 174 and 175: AGE STRUCTURE AND REPRODUCTION IN W
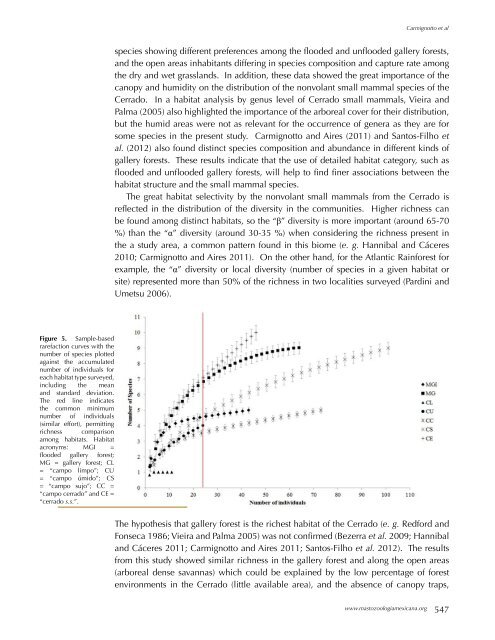
- Page 176 and 177: NONVOLANT SMALL MAMMALS FROM BRAZIL
- Page 178 and 179: NONVOLANT SMALL MAMMALS FROM BRAZIL
- Page 180 and 181: NONVOLANT SMALL MAMMALS FROM BRAZIL
- Page 182 and 183: NONVOLANT SMALL MAMMALS FROM BRAZIL
- Page 184 and 185: NONVOLANT SMALL MAMMALS FROM BRAZIL
- Page 188 and 189: NONVOLANT SMALL MAMMALS FROM BRAZIL
- Page 190 and 191: NONVOLANT SMALL MAMMALS FROM BRAZIL
- Page 192 and 193: NONVOLANT SMALL MAMMALS FROM BRAZIL
- Page 194 and 195: NONVOLANT SMALL MAMMALS FROM BRAZIL
- Page 196 and 197: NONVOLANT SMALL MAMMALS FROM BRAZIL
- Page 198 and 199: NONVOLANT SMALL MAMMALS FROM BRAZIL
- Page 200 and 201: UN CARIOTIPO DE CAROLLIA BREVICAUDA
- Page 202 and 203: UN CARIOTIPO DE CAROLLIA BREVICAUDA
- Page 204 and 205: UN CARIOTIPO DE CAROLLIA BREVICAUDA
- Page 207 and 208: The highest altitude record of Gali
- Page 209 and 210: Escobar-Lasso y Guzmán-Hernández
- Page 211 and 212: Escobar-Lasso y Guzmán-Hernández
- Page 213: Escobar-Lasso y Guzmán-Hernández
- Page 216 and 217: LOS FELINOS SILVESTRES DEL DEPARTAM
- Page 218 and 219: LOS FELINOS SILVESTRES DEL DEPARTAM
- Page 220 and 221: LOS FELINOS SILVESTRES DEL DEPARTAM
- Page 222 and 223: LOS FELINOS SILVESTRES DEL DEPARTAM
- Page 224 and 225: LOS FELINOS SILVESTRES DEL DEPARTAM
- Page 226 and 227: LOS FELINOS SILVESTRES DEL DEPARTAM
- Page 228 and 229: LOS FELINOS SILVESTRES DEL DEPARTAM
- Page 230 and 231: VARIACIÓN DE CRYPTOTIS AROENSIS EN
- Page 232 and 233: VARIACIÓN DE CRYPTOTIS AROENSIS EN
- Page 234 and 235: VARIACIÓN DE CRYPTOTIS AROENSIS EN
- Page 236 and 237:
VARIACIÓN DE CRYPTOTIS AROENSIS EN
- Page 238 and 239:
VARIACIÓN DE CRYPTOTIS AROENSIS EN
- Page 240 and 241:
VARIACIÓN DE CRYPTOTIS AROENSIS EN
- Page 242 and 243:
HÁBITAT DEL MANATÍ EN AGUA DULCE
- Page 244 and 245:
HÁBITAT DEL MANATÍ EN AGUA DULCE
- Page 246 and 247:
HÁBITAT DEL MANATÍ EN AGUA DULCE
- Page 248 and 249:
HÁBITAT DEL MANATÍ EN AGUA DULCE
- Page 250 and 251:
HÁBITAT DEL MANATÍ EN AGUA DULCE
- Page 252 and 253:
HÁBITAT DEL MANATÍ EN AGUA DULCE
- Page 254 and 255:
HÁBITAT DEL MANATÍ EN AGUA DULCE
- Page 256 and 257:
ROEDORES Y MURCIÉLAGOS EN SAN CRIS
- Page 258 and 259:
ROEDORES Y MURCIÉLAGOS EN SAN CRIS
- Page 260 and 261:
ROEDORES Y MURCIÉLAGOS EN SAN CRIS
- Page 262 and 263:
ROEDORES Y MURCIÉLAGOS EN SAN CRIS
- Page 264 and 265:
ROEDORES Y MURCIÉLAGOS EN SAN CRIS
- Page 266 and 267:
ROEDORES Y MURCIÉLAGOS EN SAN CRIS
- Page 268 and 269:
ROEDORES Y MURCIÉLAGOS EN SAN CRIS
- Page 270 and 271:
ROEDORES Y MURCIÉLAGOS EN SAN CRIS
- Page 273 and 274:
The rodents from Jalisco, Mexico: i
- Page 275 and 276:
Godinez y Guerrero mundial (Carleto
- Page 277 and 278:
Godinez y Guerrero tanto morfológi
- Page 279 and 280:
Godinez y Guerrero Figura 2. Medida
- Page 281 and 282:
Godinez y Guerrero la del dorso del
- Page 283 and 284:
Godinez y Guerrero el proceso hamul
- Page 285 and 286:
Godinez y Guerrero la cola, son de
- Page 287 and 288:
Godinez y Guerrero espinas sobre el
- Page 289 and 290:
Godinez y Guerrero 3'. Especie de t
- Page 291 and 292:
Godinez y Guerrero región supraorb
- Page 293 and 294:
Godinez y Guerrero que la base (Fig
- Page 295 and 296:
Godinez y Guerrero conspicuamente d
- Page 297 and 298:
Godinez y Guerrero relativamente ro
- Page 299 and 300:
Godinez y Guerrero 12'. Cola por lo
- Page 301 and 302:
Godinez y Guerrero diente adquiere
- Page 303 and 304:
Godinez y Guerrero 22. Superficie d
- Page 305 and 306:
Godinez y Guerrero en esta especie
- Page 307 and 308:
Godinez y Guerrero 30. Orejas, anil
- Page 309 and 310:
Godinez y Guerrero es generalmente
- Page 311 and 312:
Godinez y Guerrero mesopterigoidea
- Page 313 and 314:
Godinez y Guerrero Agradecimientos
- Page 315 and 316:
Godinez y Guerrero Fernández, J. A
- Page 317 and 318:
Godinez y Guerrero Merriam, C. H. 1
- Page 319 and 320:
In Memoriam: THERYA, abril, 2013 Vo
- Page 321 and 322:
Moncada-Moncada et al. “Lagomorph
- Page 323 and 324:
Moncada-Moncada et al. grado acadé
- Page 325 and 326:
Moncada-Moncada et al. Conocí a Gl
- Page 327 and 328:
Moncada-Moncada et al. pero tambié
- Page 329 and 330:
Moncada-Moncada et al. Querida Glor
- Page 331 and 332:
Moncada-Moncada et al. el entusiasm
- Page 333 and 334:
Moncada-Moncada et al. Yolanda Hort