La Tutela y el Derecho a la Salud - DefensorÃa del Pueblo
La Tutela y el Derecho a la Salud - DefensorÃa del Pueblo
La Tutela y el Derecho a la Salud - DefensorÃa del Pueblo

You also want an ePaper? Increase the reach of your titles
YUMPU automatically turns print PDFs into web optimized ePapers that Google loves.
<strong>La</strong> tut<strong>el</strong>a y <strong>el</strong> derecho a <strong>la</strong> salud<br />
Período 2006 - 2008<br />
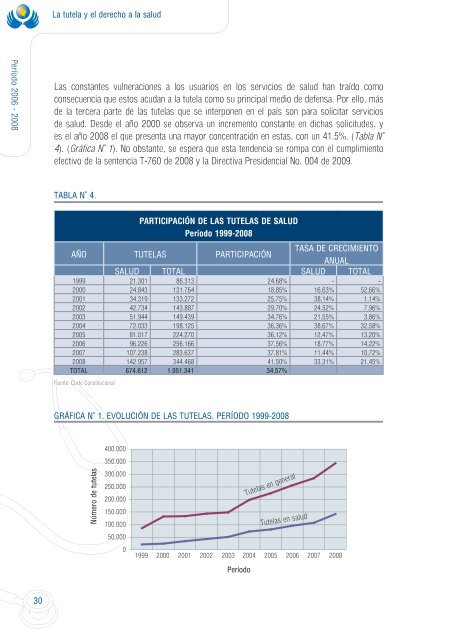
<strong>La</strong>s constantes vulneraciones a los usuarios en los servicios de salud han traído como<br />
consecuencia que estos acudan a <strong>la</strong> tut<strong>el</strong>a como su principal medio de defensa. Por <strong>el</strong>lo, más<br />
de <strong>la</strong> tercera parte de <strong>la</strong>s tut<strong>el</strong>as que se interponen en <strong>el</strong> país son para solicitar servicios<br />
de salud. Desde <strong>el</strong> año 2000 se observa un incremento constante en dichas solicitudes, y<br />
es <strong>el</strong> año 2008 <strong>el</strong> que presenta una mayor concentración en estas, con un 41.5%. (Tab<strong>la</strong> N°<br />
4). (Gráfica N° 1). No obstante, se espera que esta tendencia se rompa con <strong>el</strong> cumplimiento<br />
efectivo de <strong>la</strong> sentencia T-760 de 2008 y <strong>la</strong> Directiva Presidencial No. 004 de 2009.<br />
TABLA N° 4.<br />
PARTICIPACIÓN DE LAS TUTELAS DE SALUD<br />
Período 1999-2008<br />
AÑO TUTELAS PARTICIPACIÓN<br />
TASA DE CRECIMIENTO<br />
ANUAL<br />
SALUD TOTAL SALUD TOTAL<br />
1999 21.301 86.313 24,68% - -<br />
2000 24.843 131.764 18,85% 16,63% 52,66%<br />
2001 34.319 133.272 25,75% 38,14% 1,14%<br />
2002 42.734 143.887 29,70% 24,52% 7,96%<br />
2003 51.944 149.439 34,76% 21,55% 3,86%<br />
2004 72.033 198.125 36,36% 38,67% 32,58%<br />
2005 81.017 224.270 36,12% 12,47% 13,20%<br />
2006 96.226 256.166 37,56% 18,77% 14,22%<br />
2007 107.238 283.637 37,81% 11,44% 10,72%<br />
2008 142.957 344.468 41,50% 33,31% 21,45%<br />
TOTAL 674.612 1.951.341 34,57%<br />
Fuente: Corte Constitucional<br />
GRÁFICA N° 1. EVOLUCIÓN DE LAS TUTELAS. PERÍODO 1999-2008<br />
400.000<br />
350.000<br />
Número de tut<strong>el</strong>as<br />
300.000<br />
250.000<br />
200.000<br />
150.000<br />
100.000<br />
50.000<br />
0<br />
<strong>Tut<strong>el</strong>a</strong>s en general<br />
<strong>Tut<strong>el</strong>a</strong>s en salud<br />
1999 2000 2001 2002 2003 2004 2005 2006 2007 2008<br />
Período<br />
30