Curso de Análisis Tecnico - Actinver
Curso de Análisis Tecnico - Actinver
Curso de Análisis Tecnico - Actinver

You also want an ePaper? Increase the reach of your titles
YUMPU automatically turns print PDFs into web optimized ePapers that Google loves.
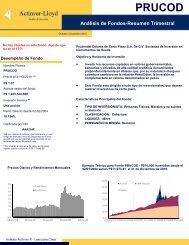
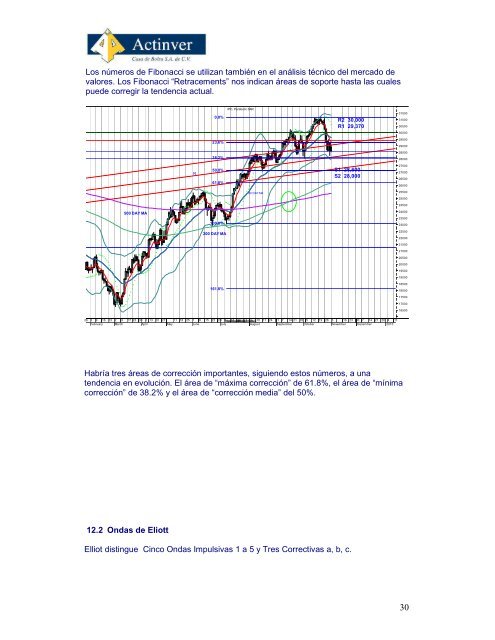
Los números <strong>de</strong> Fibonacci se utilizan también en el análisis técnico <strong>de</strong>l mercado <strong>de</strong><br />
valores. Los Fibonacci “Retracements” nos indican áreas <strong>de</strong> soporte hasta las cuales<br />
pue<strong>de</strong> corregir la ten<strong>de</strong>ncia actual.<br />
IPC, Parabolic SAR<br />
0.0%<br />
R2 30,000<br />
R1 29,370<br />
31500<br />
31000<br />
30500<br />
30000<br />
23.6%<br />
29500<br />
29000<br />
38.2%<br />
28500<br />
28000<br />
R<br />
50.0%<br />
61.8%<br />
S1 28,600<br />
S2 28,000<br />
27500<br />
27000<br />
26500<br />
26000<br />
30 DAY MA<br />
25500<br />
500 DAY MA<br />
100.0%<br />
200 DAY MA<br />
161.8%<br />
25000<br />
24500<br />
24000<br />
23500<br />
23000<br />
22500<br />
22000<br />
21500<br />
21000<br />
20500<br />
20000<br />
19500<br />
19000<br />
18500<br />
18000<br />
17500<br />
17000<br />
16500<br />
26 3 9 16 23 2 9<br />
February March<br />
17 23 30 6 13 20 27 11 18 25 1 8<br />
April<br />
May<br />
June<br />
15 22 29 6Relative Stochastic 13 MACD Strength 20 Oscillator 27 In<strong>de</strong>x 3 10 17 24 31 7 14 21 28 5 12 19 26 3 16 23 30 7 14 21 28 4 11<br />
July<br />
August<br />
September October<br />
November December 2010<br />
Habría tres áreas <strong>de</strong> corrección importantes, siguiendo estos números, a una<br />
ten<strong>de</strong>ncia en evolución. El área <strong>de</strong> “máxima corrección” <strong>de</strong> 61.8%, el área <strong>de</strong> “mínima<br />
corrección” <strong>de</strong> 38.2% y el área <strong>de</strong> “corrección media” <strong>de</strong>l 50%.<br />
12.2 Ondas <strong>de</strong> Eliott<br />
Elliot distingue Cinco Ondas Impulsivas 1 a 5 y Tres Correctivas a, b, c.<br />
30