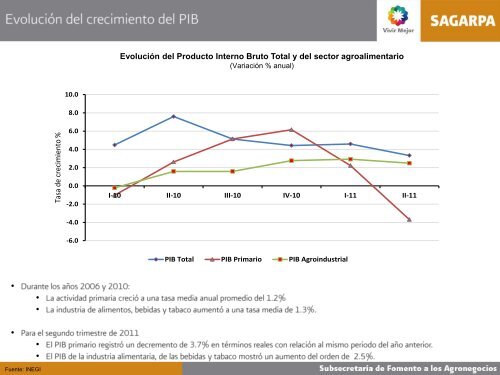
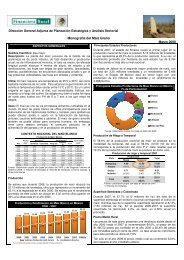
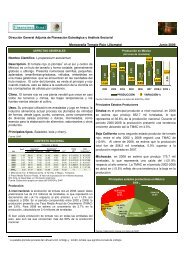
Tasa de crecimiento %Evolución del Producto Interno Bruto Total y del sector agroalimentario(Variación % anual)10.08.06.04.02.00.0-2.0I-10 II-10 III-10 IV-10 I-11 II-11-4.0-6.0PIB Total PIB Primario PIB Agroindustrial••••••Fuente: INEGI
PIB TOTALAgricultura, ganaderia, aprovechamientoforestal; pesca y cazaIndustria alimentaria, bebidas y tabacoPERIODOMillones depesosVar. %respecto almismo periodoaño anteriorMillones depesosParticipación% en el PIBTotalVar. %respecto almismo periodoaño anteriorMillones depesosParticipación % en elPIB TotalVar. %respecto almismo periodoaño anterior2009 8,369,087 -6.1 307,388 3.7 -2.2 434,214 5.2 -0.4I 8,042,200 -7 286,478 3.6 0.1 434,844 5.4 -0.1II 8,148,382 -10 332,168 4.1 -1.4 434,002 5.3 -1.9III 8,483,296 -6 273,361 3.2 -3.5 429,431 5.1 0.1IV 8,802,471 -2 337,545 3.8 -3.7 438,581 5.0 0.62010 8,820,038 5.4 317,540 3.6 3.3 440,429 5.0 1.4I 8,402,486 4.5 283,552 3.4 -1.0 433,908 5.2 -0.2II 8,767,558 7.6 340,881 3.9 2.6 440,871 5.0 1.6III 8,918,560 5.1 287,400 3.2 5.1 436,220 4.9 1.6IV 9,191,549 4.4 358,325 3.9 6.2 450,716 4.9 2.82011I 8,788,056 4.6 289,866 3.3 2.2 446,592 5.1 2.9II 9,059,061 3.3 328,311 3.6 -3.7 451,830 5.0 2.5
- Page 3 and 4: 8.0Producto Interno Bruto(Crecimien
- Page 5 and 6: Interno Bruto (Semestral)Producto I
- Page 7 and 8: 350,000300,000250,0004.3 1.4 3.3 2.
- Page 9 and 10: 320,000PIB Primario en Primer Semes
- Page 11: Tasa de crecimiento %Tasa de crecim
- Page 16 and 17: AñoAgriculturaMillones de pesos -
- Page 18 and 19: AñoComportamiento PIB Agroindustri
- Page 20 and 21: I-05II-05III-05IV-05I-06II-06III-06
- Page 22 and 23: Participación estatal en el Produc
- Page 24 and 25: Participación estatal en el Produc
- Page 26 and 27: (%)ene-08feb-08mar-08abr-08may-08ju
- Page 29 and 30: Centro22%Producción pecuariaNorest
- Page 31 and 32: FUENTE: SIAP 2010
- Page 33 and 34: 14,00012,00010,0008,0006,0004,0002,
- Page 35 and 36: Avance de la cosecha de cultivos pe
- Page 37 and 38: PRODUCTO 2009 2010 Var. %GANADO EN
- Page 40 and 41: 1,041,1501,115,8211,131,5991,113,27
- Page 43 and 44: (Millones de dólares)Evolución de
- Page 45 and 46: subsector / Grupo de ProductosEnero
- Page 47 and 48: Estructura de las Exportaciones Agr
- Page 49 and 50: Estructura de las Importaciones Agr
- Page 51: * Cifras preliminaresBALANZA COMERC