AñoAgriculturaMillones de pesos - Base 2003)GanaderíaApoyoforestal,pesca y cazaComportamiento PIB Primario1993 142,225 60,548 21,343 224,117Total Primario Agricultura GanaderíaVariación (%) anualApoyo forestal,pesca y cazaTotalPrimario1994 147,194 63,249 23,294 233,738 3.5 4.5 9.1 4.31995 149,301 66,066 21,579 236,947 1.4 4.5 -7.4 1.41996 155,867 64,844 24,011 244,721 4.4 -1.9 11.3 3.31997 157,221 68,650 23,686 249,557 0.9 5.9 -1.4 2.01998 157,151 73,246 24,218 254,615 0.0 6.7 2.2 2.01999 162,128 77,981 24,916 265,025 3.2 6.5 2.9 4.12000 160,503 81,600 27,123 269,225 -1.0 4.6 8.9 1.62001 167,884 85,608 24,745 278,237 4.6 4.9 -8.8 3.32002 166,438 87,661 23,493 277,592 -0.9 2.4 -5.1 -0.22003 170,936 89,441 25,375 285,751 2.7 2.0 8.0 2.92004 173,899 93,027 25,880 292,806 1.7 4.0 2.0 2.52005 164,458 94,956 25,826 285,240 -5.4 2.1 -0.2 -2.62006 178,878 98,117 26,311 303,305 8.8 3.3 1.9 6.32007 181,566 101,473 27,322 310,360 1.5 3.4 3.8 2.32008 183,729 104,033 26,402 314,164 1.2 2.5 -3.4 1.22009 173,350 107,496 26,542 307,388 -5.6 3.3 0.5 -2.22010 180,286 109,733 27,520 317,540 4.0 2.1 3.7 3.3TMCA 1.4 3.6 1.5 2.1FUENTE: INEGI
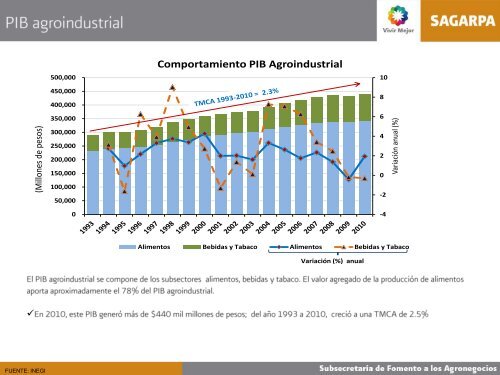
500,000Comportamiento PIB Agroindustrial10(Millones de pesos)450,000400,000350,000300,000250,000200,000150,000100,00050,000086420-2-4Variación anual (%)Alimentos Bebidas y Tabaco Alimentos Bebidas y TabacoVariación (%) anualFUENTE: INEGI
- Page 3 and 4: 8.0Producto Interno Bruto(Crecimien
- Page 5 and 6: Interno Bruto (Semestral)Producto I
- Page 7 and 8: 350,000300,000250,0004.3 1.4 3.3 2.
- Page 9 and 10: 320,000PIB Primario en Primer Semes
- Page 11 and 12: Tasa de crecimiento %Tasa de crecim
- Page 13 and 14: PIB TOTALAgricultura, ganaderia, ap
- Page 18 and 19: AñoComportamiento PIB Agroindustri
- Page 20 and 21: I-05II-05III-05IV-05I-06II-06III-06
- Page 22 and 23: Participación estatal en el Produc
- Page 24 and 25: Participación estatal en el Produc
- Page 26 and 27: (%)ene-08feb-08mar-08abr-08may-08ju
- Page 29 and 30: Centro22%Producción pecuariaNorest
- Page 31 and 32: FUENTE: SIAP 2010
- Page 33 and 34: 14,00012,00010,0008,0006,0004,0002,
- Page 35 and 36: Avance de la cosecha de cultivos pe
- Page 37 and 38: PRODUCTO 2009 2010 Var. %GANADO EN
- Page 40 and 41: 1,041,1501,115,8211,131,5991,113,27
- Page 43 and 44: (Millones de dólares)Evolución de
- Page 45 and 46: subsector / Grupo de ProductosEnero
- Page 47 and 48: Estructura de las Exportaciones Agr
- Page 49 and 50: Estructura de las Importaciones Agr
- Page 51: * Cifras preliminaresBALANZA COMERC