AñoComportamiento PIB AgroindustrialMillones de pesos - Base 2003)Variación (%) anualAlimentosBebidas yTabacoTotalAgroindustrialAlimentosBebidas yTabacoTotalAgroindustrial1993 232,847 57,655 290,5021994 239,259 59,468 298,727 2.8 3.1 2.81995 241,576 58,502 300,079 1.0 -1.6 0.51996 246,818 62,166 308,983 2.2 6.3 3.01997 254,951 64,614 319,565 3.3 3.9 3.41998 264,493 70,449 334,942 3.7 9.0 4.81999 273,426 73,942 347,368 3.4 5.0 3.72000 285,091 75,965 361,056 4.3 2.7 3.92001 290,758 74,979 365,738 2.0 -1.3 1.32002 296,639 76,010 372,649 2.0 1.4 1.92003 301,409 76,093 377,502 1.6 0.1 1.32004 311,406 81,626 393,033 3.3 7.3 4.12005 319,592 87,397 406,989 2.6 7.1 3.62006 325,196 92,877 418,073 1.8 6.3 2.72007 332,808 96,056 428,863 2.3 3.4 2.62008 337,372 98,432 435,804 1.4 2.5 1.62009 335,957 98,258 434,214 -0.4 -0.2 -0.42010 342,469 97,960 440,429 1.9 -0.3 1.4TMCA 2.3 3.2 2.5FUENTE: INEGI
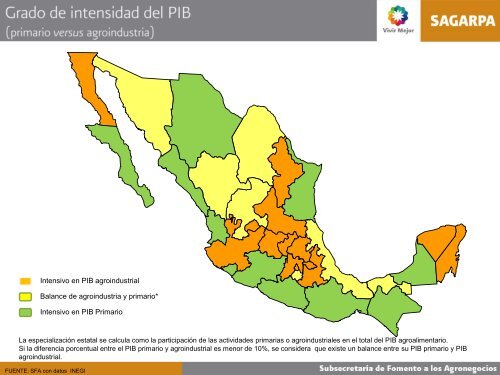
1Intensivo en PIB agroindustrialBalance de agroindustria y primario*Intensivo en PIB PrimarioLa especialización estatal se calcula como la participación de las actividades primarias o agroindustriales en el total del PIB agroalimentario.Si la diferencia porcentual entre el PIB primario y agroindustrial es menor de 10%, se considera que existe un balance entre su PIB primario y PIBagroindustrial.FUENTE: SFA con datos INEGI
- Page 3 and 4: 8.0Producto Interno Bruto(Crecimien
- Page 5 and 6: Interno Bruto (Semestral)Producto I
- Page 7 and 8: 350,000300,000250,0004.3 1.4 3.3 2.
- Page 9 and 10: 320,000PIB Primario en Primer Semes
- Page 11 and 12: Tasa de crecimiento %Tasa de crecim
- Page 13 and 14: PIB TOTALAgricultura, ganaderia, ap
- Page 16 and 17: AñoAgriculturaMillones de pesos -
- Page 20 and 21: I-05II-05III-05IV-05I-06II-06III-06
- Page 22 and 23: Participación estatal en el Produc
- Page 24 and 25: Participación estatal en el Produc
- Page 26 and 27: (%)ene-08feb-08mar-08abr-08may-08ju
- Page 29 and 30: Centro22%Producción pecuariaNorest
- Page 31 and 32: FUENTE: SIAP 2010
- Page 33 and 34: 14,00012,00010,0008,0006,0004,0002,
- Page 35 and 36: Avance de la cosecha de cultivos pe
- Page 37 and 38: PRODUCTO 2009 2010 Var. %GANADO EN
- Page 40 and 41: 1,041,1501,115,8211,131,5991,113,27
- Page 43 and 44: (Millones de dólares)Evolución de
- Page 45 and 46: subsector / Grupo de ProductosEnero
- Page 47 and 48: Estructura de las Exportaciones Agr
- Page 49 and 50: Estructura de las Importaciones Agr
- Page 51: * Cifras preliminaresBALANZA COMERC