Global Forest, Paper & Packaging Industry Survey - Financiera Rural
Global Forest, Paper & Packaging Industry Survey - Financiera Rural
Global Forest, Paper & Packaging Industry Survey - Financiera Rural
- No tags were found...
Create successful ePaper yourself
Turn your PDF publications into a flip-book with our unique Google optimized e-Paper software.
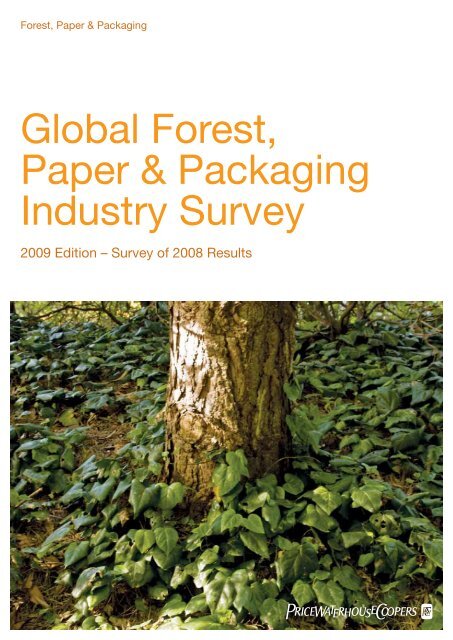
PricewaterhouseCoopers’ <strong>Global</strong> <strong>Forest</strong>, <strong>Paper</strong> & <strong>Packaging</strong> <strong>Industry</strong> <strong>Survey</strong>: 2009 Edition – <strong>Survey</strong> of 2008 Results
Leaders’ messageWelcome to the PricewaterhouseCoopers <strong>Global</strong> <strong>Forest</strong>,<strong>Paper</strong> & <strong>Packaging</strong> <strong>Industry</strong> <strong>Survey</strong> † – 2009 Edition. Thegoal of the <strong>Survey</strong>, now in its 12th year, is to provideinsight into the major companies and an overview ofthe issues and events shaping the industry. This year’s<strong>Survey</strong> summarises the 2008 publicly available financialinformation for the PwC Top 100, the 100 largest forest,paper and packaging (FPP) companies in the world,ranked by sales revenue.This year’s <strong>Survey</strong> results reflect the significant challenges faced by the sector,with the PwC Top 100 companies’ net income sliding into the red, as well asreturn on equity and return on capital employed falling sharply from the levelsseen in 2007. Large sections of the FPP industry are struggling to survive inthe current global recession and there can be little doubt that major changeswill need to occur in order for companies to remain competitive in the face offalling global demand. Whether or not the industry will truly be transformed —either via long-overdue consolidation, notably in Europe, or a shift in businessmodels, or both — remains to be seen.Our 22nd Annual <strong>Global</strong> <strong>Forest</strong> & <strong>Paper</strong> <strong>Industry</strong> Conference held in May 2009in Vancouver, Canada stimulated extensive discussion of the industry’s future,particularly around bio-energy and the opportunities and challenges it maycreate for the sector. The conference drew close to 400 executives, engagingthem in dialogue about the challenges and opportunities facing the industry.We include a summary of the event in this report, starting on page 26 and moredetails are available on our website: www.pwc.com/forestconf09. We lookforward to hosting the 23rd Annual Conference in Vancouver on 11 May, 2010.PricewaterhouseCoopers’ thought leadership and depth of industryknowledge have enabled us to satisfy our clients’ business needs andsurpass their expectations by offering proactive solutions to help them identifyand capitalise on trends. For more information about the services offeredby PricewaterhouseCoopers’ <strong>Global</strong> <strong>Forest</strong>, <strong>Paper</strong> & <strong>Packaging</strong> <strong>Industry</strong>Practice, please contact one of the professionals in your region listed insidethe back cover of this <strong>Survey</strong>. We hope you enjoy the 2009 edition of thePricewaterhouseCoopers <strong>Global</strong> <strong>Forest</strong>, <strong>Paper</strong> & <strong>Packaging</strong> <strong>Industry</strong> <strong>Survey</strong>.Clive Suckling<strong>Global</strong> Leader,<strong>Forest</strong>, <strong>Paper</strong> & <strong>Packaging</strong>PricewaterhouseCoopersLondon, UKCraig CampbellPartner, Performance Improvement,<strong>Forest</strong>, <strong>Paper</strong> & <strong>Packaging</strong>PricewaterhouseCoopersVancouver, CanadaTable 1: PwC Top 100 Companies(US $ billions 1 )2008$2007$2006$2005$Sales revenue 357.1 333.3 317.3 335.9 328.2Operating profit 21.2 26.1 23.5 21.7 24.5Net income (loss) (8.0) 13.8 11.9 9.2 13.72004$Return on equity (%) 1.9% 8.0% 6.5% 6.2% 9.4%Return on capital employed 2 (%) 2.4% 4.9% 4.6% 4.9% 5.3%Capital expenditures 24.8 24.5 21.9 20.6 19.3Depreciation 20.9 19.9 20.6 21.4 21.9Cash flow from operations 3 26.4 30.8 34.8 29.9 35.71. Throughout the <strong>Survey</strong> all currency references are in US dollars unless otherwise noted. Source: PricewaterhouseCoopers LLP2. Refer to the Methodology section on page 24 for the definition of return on capital employed.3. 2007 and 2008 cash flow are reported before working capital.† Inclusive of paper packaging only© 2009 PricewaterhouseCoopers LLP 1
PricewaterhouseCoopers’ <strong>Global</strong> <strong>Forest</strong>, <strong>Paper</strong> & <strong>Packaging</strong> <strong>Industry</strong> <strong>Survey</strong>: 2009 Edition – <strong>Survey</strong> of 2008 Results
PwC Top 100HighlightsSales and net incomeThe total sales of the PwC Top 100 were $357 billionin 2008, up from $333 billion in 2007, however theincrease was mainly due to the appreciation of theEuro against the US dollar. The 20 largest companiesaccounted for nearly 58% of total sales, consistentwith 2007. Operating income of $21 billion representeda decrease of 19% compared to prior year results.Net income tumbled from positive $14 billion torecord losses of $8 billion in 2008, the first net lossrecorded since we began tracking the net income ofthe PwC Top 100 in 1996. This sharp decline is mainlydue to the impact of losses realised by major players inmany of the mature markets (North America, WesternEurope) as a result of low demand, goodwill and fixedasset impairments, restructuring, severance and highoperating costs.Despite the huge drop in net income, cash flow fromoperations only dropped 16%, to $26 billion in 2008from $31 billion in 2007. The reduction in cash flowessentially mirrors the drop in operating income ascompanies focus on conserving cash. Much of theimpact on the companies’ bottom lines was a result ofnon-cash or long-term items.Figure 9: Sales(US $ billions)EuropeUSJapanCanadaEmergingMarkets2008Other20070 30 60 90 120 150Source: PricewaterhouseCoopers LLPFigure 10: Net Income (Loss)(US $ billions)EuropeUSJapanCanadaEmergingMarketsOther20082007-4 -3 -2 -1 0 1 2 3 4 5 6Source: PricewaterhouseCoopers LLPFigure 11: Largest Losses(US $ millions)Smurfit-StoneUSAbitibiBowaterCanadaInternational <strong>Paper</strong>USAracruzBrazil2008Stora Enso2007Finland-3,000 -1,500 0 1,500Source: PricewaterhouseCoopers LLP8PricewaterhouseCoopers’ <strong>Global</strong> <strong>Forest</strong>, <strong>Paper</strong> & <strong>Packaging</strong> <strong>Industry</strong> <strong>Survey</strong>: 2009 Edition – <strong>Survey</strong> of 2008 Results
Return on capital employed (ROCE)The average ROCE of the PwC Top 100 dropped from 4.9% in 2007 to2.4% in 2008. Only six companies earned a return of more than 10% in2008, compared to 14 in 2007.Six companies (three in Latin America and three in China) made our listof ROCE leaders, achieving ROCE of greater than 10%. In 2008, only twocompanies from China generated a ROCE of greater than 10% comparedwith three companies in 2007, reflecting the widespread impact of theglobal slowdown. In 2007 emerging market producers were among theleaders in ROCE. Emerging Asia ROCE for 2008 remained flat at 7.2%(2007: 7.7%). Chinese companies’ ROCE at 8.1% showed resiliencecompared to Latin American producers. The ROCE for Latin Americadwindled to 3.0% from 9.0% in 2007.Figure 12: Highest ROCE(Percent)Figure 13: Highest Earnings(US $ millions)Kimberly-Clark MexicoMexicoKimberly-ClarkUSSino-<strong>Forest</strong>Canada/ChinaLee & Man <strong>Paper</strong>ChinaSonocoUS200820070 5 10 15 20 25Source: PricewaterhouseCoopers LLPKimberly-ClarkUSSCASwedenAraucoChileKimberly-Clark MexicoMexicoNine DragonsChina200820070 500 1,000 1,500 2,000Source: PricewaterhouseCoopers LLP© 2009 PricewaterhouseCoopers LLP 9
charge, also outlining how it had moved to cutproduction by 15% to 30% according to segment andreduce planned capital expenditure by 25 to 30%.While most of the European companies in thePwC Top 100 have portfolios which are dominated bypulp, paper and packaging businesses, for those inwood products, 2008 was nearly universally as grim asoversupply in the face of falling construction demandcaused prices to fall. Despite massive efforts to reducecapacity, it will take some time to establish a stablesupply and demand balance in the European market.Far-reaching consolidation failed to materialise inEurope in 2008. Overall deal volume declined 10%from 2007 to 2008. The biggest 2008 deal wasFinland’s M-real’s $1 billion sale of its coated graphicpaper business to South Africa’s Sappi. Anothersignficant deal was the Stora Enso sale of its whollyowned paper and packaging merchant, Papyrus, tothe Swedish private equity company Altor Partners for$974 million in April 2008. Increasing financial distressis likely to drive more activity across the sector in theface of grim market conditions.Financial performanceSales by the 30 European-based companies includedin the PwC Top 100 amounted to $128 billion, up 5.1%from the $122 billion reported for 2007. However, whenreported in Euros, 2008 sales actually decreased by1.9% to €87 billion from €89 billion, due to the 7%depreciation of the US dollar against the Euro in 2008.European companies’ sales were higher than UScompanies for the second year in a row.Net losses amounted to $1.5 billion, reversing thenet income of $3.3 billion reported in 2007. FourteenEuropean companies posted net losses in 2008,compared to only four during 2007. The sharpdecrease in net income is attributed to both marketconditions and asset impairments; in some cases therewere also significant foreign exchange losses.Sequana Capital (fine and specialty paper productionand paper merchanting) showed the steepest decline,moving from $195 million in net income in 2007 to anet loss of $630 million in 2008. Stora Enso (paper,packaging and wood products) was next at $991 millionin net losses, down $697 million from the $294 millionin net losses reported in 2007. Sequana’s losses weremainly due to discontinued operations, impairment andrestructuring charges which amounted to €500 million,while Stora Enso’s losses from restructuring andimpairments amounted to €1 billion.SCA (tissue and personal care, packaging, graphicpapers and wood products) was the most profitableEuropean company in 2008 with net income of$857 million (2007: $1.1 billion). Similar to Kimberly-Clarkin North America, SCA’s net income benefited from itsstrong exposure to the less-cyclical hygiene segment.ROCE was 2.9% in 2008, down from 5.0% in 2007.DS Smith (mainly packaging) and Heinzel Group(mainly pulp) earned the highest ROCE in Europe at10% and 9.9% respectively. Results for DS Smith arebased on a company year-end of April 30, 2008, sodo not reflect the impact of global downturn later inthe year. Heinzel Group benefited from the favorablepulp markets until the third quarter, as well as gains onexchange derivative values.Three European companies entered or rejoined the PwCTop 100 in 2008: Reno de Medici (Italy), ExacomptaClairfontaine (France) and Moelven (Norway).© 2009 PricewaterhouseCoopers LLP 15
PwC Top 100 — Results by country/regionUnited StatesEconomic and market overviewUS GDP growth slowed from 2.1% in 2007 to1.1% in 2008, with a significant decrease in thelast half of the year. The fourth quarter experiencedcontraction at an annualised rate of 6.3%. In additionto slow domestic growth, the global economicdownturn caused US producers to face a markeddrop in demand from emerging markets, and acorresponding decline in exports.Many companies are faced with reduced leverage,smaller balance sheets and reduced growth potential.As already noted, US companies debt to equity ratioexploded in 2008, nearly doubling to reach a balancesheet gearing level of 210%. The housing marketremains bleak, despite an initial upturn at the beginningof 2008. The year ended with housing starts at thelowest level seen in decades. Forecasts suggest noimmediate improvement.As in Europe, many US companies reduced or shiftedcapacity. The AF&PA reported an overall capacityreduction of 0.8% for the year, and that paper andpaperboard capacity has contracted 7.3% since its2000 peak.The volume of North American FPP deal-making rosein 2008 but, with the notable exception of International<strong>Paper</strong>’s $6 billion acquisition of Weyerhaeuser’spackaging assets, the vast majority of deal-makingwas focused on smaller transactions than in theimmediately preceding years. Thus, while deal volumewas up 15%, total value declined by 32%, from$17 billion in 2007 to $12 billion in 2008. The declineis even greater given that the International <strong>Paper</strong>/Weyerhaeuser deal accounted for half the total dollardeal value. In terms of trends, timberland asset valuesremained relatively strong, and further consolidationwas seen in the packaging sector.The tough times faced by the industry were reflectedby Smurfit-Stone’s decision to file for bankruptcyprotection in January 2009.In recent months, the industry has focused quiteintently upon a provision of the US tax laws thatprovide tax refunds and credits for alternative energy.Some paper manufacturers who use a bio-fuel knownas black liquor are eligible for the credits and someestimates suggest the industry could receive as muchas $6 billion in tax credits from the US government bythe end of 2009, and many papermakers have alreadycollected millions of dollars in the first few monthsof 2009. Hawkins Wright estimates the impact of thecredit to be in the range of $125–$150 per tonne,so it could have a major impact on the relativecompetitiveness of producers based or operating in theUS in the short-term before the credit sunsets at theend of the 2009.Financial performanceThe 24 US-based companies in the PwC Top 100reported aggregated sales of $104 billion. Collectivelythey represent 29% of the total sales of the PwCTop 100. This compares with $100 billion or 30% oftotal sales in 2007. Overall sales revenues increased by amodest 3.8% compared to last year.16PricewaterhouseCoopers’ <strong>Global</strong> <strong>Forest</strong>, <strong>Paper</strong> & <strong>Packaging</strong> <strong>Industry</strong> <strong>Survey</strong>: 2009 Edition – <strong>Survey</strong> of 2008 Results
Net income for the 24 US companies decreased sharply from $5.6 billion positivein 2007 to $2.9 billion in net losses in 2008. Eleven out of the 24 companiesreported net losses totalling $5.5 billion in 2008 compared with eight companiesin 2007 reporting $0.5 billion in net losses. US companies with positive resultssaw a decline in their net income, with the exception of Buckeye Technologies($17 million increase, cellulose-based products) and Rock-Tenn (resultsunchanged from 2007, packaging). The net losses line was dominated bySmurfit-Stone’s $2.8 billion loss due primarily to goodwill and other intangibleasset impairment charges of $2.7 billion, and International <strong>Paper</strong>’s $1.3 billionnet losses, which include $1.8 billion of goodwill impairment charges and$179 million of restructuring and other charges.ROCE amounted to 2.9% in 2008, down from 5.2% in 2007. Kimberly-Clarkat 14.8% (2007: 15.2%) and Sonoco at 10.3% (2007: 10.5%) were the onlytwo companies that earned a ROCE greater than 10%.Missing from the list is Potlatch, now replaced by its spin-off Clearwater <strong>Paper</strong>.Table 4: Top US <strong>Forest</strong>, <strong>Paper</strong> & <strong>Packaging</strong> Companies(US $ millions)Company Name Sales Net Income (Loss) ROCE2008 2007 2008 2007 2008 2007$ $ $ $ % %International <strong>Paper</strong> 24,829 21,890 (1,282) 1,168 1.5 5.7Kimberly-Clark 19,415 18,266 1,690 1,823 14.8 15.2Smurfit-Stone 7,042 7,420 (2,818) (103) -16.2 2.0MeadWestvaco 6,637 6,407 90 285 2.8 4.8Weyerhaeuser 6,610 8,465 181 586 2.8 0.5NewPage Corporation 4,356 2,168 (142) (22) 1.8 3.1Sonoco 4,122 4,040 165 214 10.3 10.5Graphic <strong>Packaging</strong> 4,079 2,421 (100) (75) 1.2 3.1Temple-Inland 3,884 3,926 (8) 1,305 0.9 0.7Boise Cascade 2,978 5,413 (288) 128 -8.8 8.2Rock-Tenn 2,839 2,316 82 82 7.4 7.8<strong>Packaging</strong> Corp of America 2,361 2,316 136 170 9.1 10.4Universal <strong>Forest</strong> Products 2,232 2,513 4 21 2.4 4.9Verso <strong>Paper</strong> Holdings 1,767 1,629 (63) (111) 2.6 -0.5Louisiana-Pacific 1,376 1,705 (579) (180) -10.8 -2.9P H Glatfelter 1,273 1,157 58 63 5.8 2.6Clearwater <strong>Paper</strong> 1,256 1,183 10 25 3.2 6.2Rayonier 1,232 1,172 79 177 5.8 11.6Wausau-Mosinee <strong>Paper</strong> 1,192 1,240 (16) (2) 0.2 1.4Plum Creek Timber Co. 1,182 1,273 5 52 2.0 3.8Appleton <strong>Paper</strong>s 965 963 (97) (6) -2.1 3.4Buckeye Technologies 826 769 47 30 7.8 6.5Caraustar Industries 820 854 (99) (25) -3.3 0.2Schweitzer-Mauduit 768 715 1 3 3.9 5.5104,041 100,221 (2,944) 5,608 2.9 5.2Source: PricewaterhouseCoopers LLP17© 2009 PricewaterhouseCoopers LLP 17
PwC Top 100 — Results by country/regionJapanEconomic and market overviewJapan’s GDP growth declined from2.4% in 2007 to -0.6% in 2008.Japan’s economy was one of thehardest hit by the global decline– in the fourth quarter of 2008 itcontracted at a rate of 12.1%,the country’s worst economicperformance in 35 years. The severeimpact on Japan can be tracedto falling demand and the sharpappreciation of the Yen by 25%in Q4. In 2008 Japan experiencedthe sharpest export decline in thecountry’s post-war history. Forecastssuggest that a turn-around is notimminent, but as in other markets,the outlook is uncertain.Japanese companies expect tofocus on other markets in Asia andOceania as a way to cope with thedomestic malaise. Nippon <strong>Paper</strong>announced the purchase of <strong>Paper</strong>Australia, a subsidiary of <strong>Paper</strong>linX,in February 2009. Company pressreleases report Nippon’s view thatAustralia offers a promising papermarket, given that the Japanesedomestic market is near saturation.Financial performanceJapanese FPP companies all have their fiscal years ending on March 31.Their financial data included in this <strong>Survey</strong> are for the 12 months endedMarch 31, 2008. Consequently, the results included in the <strong>Survey</strong> are notreflective of the calendar year 2008, especially the deterioration of theeconomy starting September 2008.Sales for the 12 Japanese companies for the 12 months endedMarch 31, 2008 rose by 18.2%, however net income for the yeardecreased to $597 million from $764 million in 2007. The increase in saleswas mainly due to the appreciation of the Yen against the dollar duringthe first quarter of 2008. When reported in Yen, sales increased slightly to¥5,150 billion from ¥4,987 billion in 2007, and net income decreased by32% from ¥90 billion in March 31, 2007 to ¥61 billion in 2008. The averageROCE decreased to 2.1% in 2008 from 2.5% in 2007.The slowdown in global economic activity has also impacted the Japanesecompanies’ performance for the fiscal year ended March 31, 2009.Preliminary announcements indicate that sales for the 12 companiesremained flat at $50 billion while net income dropped markedly from$597 million to close to $50 million.Table 5: Top Japanese <strong>Forest</strong>, <strong>Paper</strong> & <strong>Packaging</strong> Companies(US $ millions)Company Name Sales Net Income (Loss) ROCE2008 2007 2008 2007 2008 2007$ $ $ $ % %Oji <strong>Paper</strong> 12,788 10,758 114 146 1.6 2.3Nippon Unipac 11,753 9,990 55 195 1.2 2.1Sumitomo <strong>Forest</strong>ry 4,374 4,257 28 45 1.8 2.2Daio <strong>Paper</strong> 4,421 3,520 47 90 1.9 3.2Rengo 4,353 3,500 56 80 1.9 2.5Unicharm 3,268 2,566 162 128 9.7 8.8Mitsubishi <strong>Paper</strong> 2,508 2,076 35 62 2.5 1.8Daiken 1,616 1,431 8 (37) 1.4 -0.5Hokuetsu <strong>Paper</strong> 1,675 1,351 40 38 2.0 2.8Tomoku 1,417 1,263 13 6 2.1 2.2Chuetsu Pulp & <strong>Paper</strong> 1,099 960 12 (15) 1.7 0.1The Pack 816 710 27 26 9.2 11.050,088 42,382 597 764 2.1 2.5Source: PricewaterhouseCoopers LLP18PricewaterhouseCoopers’ <strong>Global</strong> <strong>Forest</strong>, <strong>Paper</strong> & <strong>Packaging</strong> <strong>Industry</strong> <strong>Survey</strong>: 2009 Edition – <strong>Survey</strong> of 2008 Results
CanadaEconomic and market overviewGDP growth declined from 2.7%in 2007 to a mere 0.5% in 2008.The Canadian economy contractedat an annualised rate of 3.4% inthe fourth quarter, compared witha 6.3% annualised decline in the USeconomy during the same period.While Canada’s forest and paperindustry realised improvementsin product prices during the firsthalf of the year, the onset of theglobal financial crisis and reductionin demand resulted in inventoryincreases and reductions in salesvolumes for the last half of the year.Many companies recorded writedowns and asset impairments, ascompanies looked to restructureand clean up their balance sheets.A number of Canadian producersdescribed the year as the worstdownturn and most difficult inrecent history.Financial performanceCanadian companies were hard hit by the global economic situation andreductions in prices and shipments, as is evident in reduced sales andparticipation in the PwC Top 100 in 2008. Only 11 Canadian companiesmade the PwC Top 100 in 2008, down from 13 in 2007. Interfor andAinsworth’s sales plummeted to $413 million and $339 million respectively,causing them to drop out of the PwC Top 100. Seven out of the 11Canadian participants still included were ranked lower than in 2007.The 11 companies accounted for 8.4% of PwC Top 100 sales. Their salesvalue of $30 billion was 8.7% greater than the comparable value of the 11in 2007, however much of the $2.4 billion increase in sales is attributableto the inclusion of full year results for Abitibi, which merged with Bowaterin October 2007. If the AbitibiBowater results are excluded, sales remainedflat compared to prior year.Net losses rose 355% to $4.0 billion (2007: $0.9 billion). All 11 Canadiancompanies reported a net loss in 2008, compared with eight out of 13companies reporting losses in 2007. Net losses were deepened by astronger Canadian dollar, goodwill and other asset impairment charges.AbitibiBowater reported the most significant decline in profitability, with a netloss of $2.2 billion in 2008, compared with a 2007 net loss of $0.49 billion.The company sought creditor protection proceedings in April 2009.Overall ROCE decreased to -5.0% in 2008, down from 0.0% in 2007.Cascades (primarily packaging) was the only Canadian company in thePwC Top 100 to report a positive ROCE in 2008 at 0.9% (4.6% in theprevious year), followed by Domtar (primarily fine paper) at 0.0% (4.5%).All other companies reported a negative ROCE.Conditions remain very difficult in 2009.Table 6: Top Canadian <strong>Forest</strong>, <strong>Paper</strong> & <strong>Packaging</strong> Companies(US $ millions)Company Name Sales Net Income (Loss) ROCE2008 2007 2008 2007 2008 2007$ $ $ $ % %AbitibiBowater 6,771 3,876 (2,234) (490) -9.8 -4.0Domtar 6,394 5,947 (573) 70 0.0 4.5Cascades 3,792 3,674 (52) 89 0.9 4.6West Fraser Timber 3,010 3,100 (129) (34) -3.8 -0.4Canfor 2,466 3,063 (326) (337) -6.9 -3.0Tembec 2,243 2,571 (142) (46) -7.2 -0.1Catalyst 1,746 1,603 (209) (30) -2.1 2.5Mercer International 1,060 996 (107) 30 -3.8 5.7Norbord 943 1,104 (116) (45) -5.9 -1.4Western <strong>Forest</strong> Products 769 833 (81) (52) -10.4 -6.1Fraser <strong>Paper</strong>s 689 715 (72) (44) -16.1 -11.929,883 27,482 (4,041) (889) -5.0 0.0Source: PricewaterhouseCoopers LLP© 2009 PricewaterhouseCoopers LLP 19
PwC Top 100 — Results by country/regionLatin AmericaEconomic and market overviewLatin America’s fortunes arestrongly dependent upon those ofits neighbours to the north, and notsurprisingly the region’s economiesare also suffering from the impactof the global downturn. Thosecountries with the strongest tradeties to the US, such as Mexico, feltthe impact most immediately. Tightfinancial conditions and weakerexternal demand have proved adrag on growth in the region. Mexicoslid into a recession in 2008, whilegrowth in Brazil decelerated.Pulp markets closed 2008 in anoversupply situation despite marketcurtailments. Performance of LatinAmerican companies is unlikely toshow major improvement until pulpdemand and prices pick up.Capacity is set to increase in 2009,with output from VCP’s new pulpmill in Tres Lagoas scheduled toreach the market by mid-year. In2008 VCP began the process ofacquiring control of Aracruz. Theprocess was sidelined for severalmonths due to Aracruz’s exposureto currency derivatives, howeverin January 2009 VCP resumed themerger process, expanding theirstake in two stages in Aracruzto 84% and with further steps toacquire the minority. This mergercreates the world’s largest producerof short-fibre pulp.Financial performanceThe nine Latin American based companies on the PwC Top 100 listreported aggregate sales of $18 billion, or 5.0% of total sales of the PwCTop 100. This compares with $17 billion in 2007. The modest level ofincrease, in sharp contrast to strong growth in recent years, is largely dueto the decline in pulp prices and production in the fourth quarter as a resultof the worldwide downturn in demand for commodities. During most of2008, Latin American producers were also negatively impacted by therelative strength of their currencies in relation to the US dollar.Net losses amounted to $1.3 billion in 2008, a sharp drop from the$3.8 billion in net earnings achieved in 2007. Much of the drop can beattributed to Aracruz, which reported a charge of $2.1 billion from exposureto foreign currency derivatives. Five companies reported net losses in2008, while only Durango (Mexico) reported a loss in 2007. Again, currencyfluctuations drove most of this change, as the appreciation of the Real andthe sudden increase in input costs during the first half of 2008 put pressureon results reported in US dollars.Latin American companies did not replicate the 2007 average ROCE of9.0%; average ROCE dropped to 3.0% in 2008. Kimberly-Clark Mexico wasthe only exception, reporting the highest ROCE in 2008 at 22.3%, up from2007’s 20.3%. The company benefited from strong exposure to the tissuepapers segment, where demand has been less severely impacted by theeconomic crisis. Arauco kept second place with 2008 ROCE at 6.8%, downfrom 11.9% in 2007. VCP’s ROCE fell to -3.9% from 10.9% in 2007 mainlydue to losses on foreign currency derivatives and an equity investment lossin Aracruz.Table 7: Top Latin American <strong>Forest</strong>, <strong>Paper</strong> & <strong>Packaging</strong> Companies(US $ millions)Company Name Country Sales Net Income (Loss) ROCE2008 2007 2008 2007 2008 2007$ $ $ $ % %Arauco Chile 3,689 3,576 479 696 6.8 10.3CMPC Chile 2,945 3,227 203 502 3.4 8.3Suzano Brazil 2,264 1,759 (251) 277 -0.9 6.1Kimberly-Clark Mexico Mexico 2,091 1,976 300 343 22.3 20.3Aracruz Brazil 1,911 1,884 (1,239) 422 4.6 9.5Klabin Brazil 1,725 1,443 (194) 321 2.7 9.2Votorantim Celulose (VCP) Brazil 1,366 1,333 (404) 1,221 -3.9 10.9Masisa SA Chile 1,054 966 44 41 4.8 2.5Grupo Industrial Durango Mexico 769 766 (209) (44) -6.9 1.417,814 16,930 (1,271) 3,779 3.0 9.0Source: PricewaterhouseCoopers LLP20PricewaterhouseCoopers’ <strong>Global</strong> <strong>Forest</strong>, <strong>Paper</strong> & <strong>Packaging</strong> <strong>Industry</strong> <strong>Survey</strong>: 2009 Edition – <strong>Survey</strong> of 2008 Results
Emerging AsiaEconomic and market overviewEmerging Asia is strongly dependenton manufacturing exports, whichhave been suffering due to theglobal slowdown. While overall GDPgrowth in the region was around8% for 2008, this represents asignificant drop-off from 2007’sstrong performance. China’s GDPgrowth slowed from 13% in 2007to 9.0% in 2008; forecasts for 2009vary, but most recent projectionsanticipate a further decline in growthrates for 2009.In the second half of 2008 Chinaexperienced reduced profitability inthe corporate sector. To compensatefor expected continued drops inexport demand, China is shiftingits focus to serving domesticdemand and rebalancing growthexpectations towards domesticconsumption and services.China is also spear-heading regionalefforts to head off the impact of thefalloff in global investment and trade,through fiscal stimulus packagesequivalent to 3.6% of regional GDP,by some estimates. China’s stimuluspackage is the largest in the regionat about 12% of 2009 GDP to beimplemented through to the endof 2010.Table 8: Top Emerging Asia <strong>Forest</strong>, <strong>Paper</strong> & <strong>Packaging</strong> Companies(US $ millions)Company Name Country Sales Net Income (Loss) ROCE2008 2007 2008 2007 2008 2007$ $ $ $ % %Shandong Chenming China 2,239 2,002 155 128 7.8 6.3Nine Dragons <strong>Paper</strong> China 2,035 1,298 271 264 7.7 13.0Siam Pulp & <strong>Paper</strong> Thailand 1,442 1,404 51 75 5.3 8.0Yuen Foong Yu <strong>Paper</strong> Taiwan 1,381 1,266 (11) 34 -0.3 2.1Hansol <strong>Paper</strong> Korea 1,243 1,209 3 (10) 2.9 1.2Lee & Man <strong>Paper</strong> China 1,155 660 185 129 12.4 15.0Cheng Loong Taiwan 1,087 1,028 3 19 2.0 3.6Sino <strong>Forest</strong> China 901 714 229 152 12.7 12.8Shandong Huatai <strong>Paper</strong> China 866 796 53 66 7.1 8.6Shan Dong Sun <strong>Paper</strong> China 836 671 33 50 8.3 9.2Ballarpur Industries India 654 556 69 61 8.6 8.313,840 11,604 1,041 968 7.2 7.7Source: PricewaterhouseCoopers LLPChina continued to face fibre deficits during 2008. If secondary fibre sourcesare excluded, China is only able to meet around half of its demand forvirgin fibre from domestic sources. As already noted in our discussion offibre supply, in the second half of 2008 Chinese demand for imported pulpdid not always track domestic or global demand for paper. Analyst reportssuggest that in addition to stockpiling in order to take advantage of lowerpulp prices, some papermakers have been substituting imported pulp forlower quality domestic sources of wood and non-wood pulp, now that doingso has become cost-competitive.In recent years China has been rapidly expanding paper producing capacity,but some construction projects, expansions and investments are beingpostponed in light of weakened demand growth expectations. One exampleis Shandong Chenming <strong>Paper</strong> Holding’s decision to delay a pulp mill project.India has also been driving growth in the region in recent years, with healthyrates of expansion, but is now seeing huge challenges. Major players inIndonesia and China who have been faced with sharply declining demandfrom North America and Europe may look to push large quantities of coatedand uncoated wood-free grades of paper into the Indian market, whichmay put pressure on prices. Indian papermakers also need to contend withserious fibre shortages, and fragmented land holdings and concerns overland-use make efforts to increase pulp production more challenging.© 2009 PricewaterhouseCoopers LLP 21
PwC Top 100 — Results by country/regionFinancial performanceCompanies in Emerging Asia increased their sales to$14 billion in 2008, 19% higher than the $12 billion in2007. Net profits were $1.04 billion in 2008 comparedto $0.97 billion in 2007. While the results for EmergingAsia initially appear to be significantly better thanthose of peers in other regions, it should be notedthat Nine Dragons and Ballarpur both have June 30fiscal year-ends, while Lee & Man’s is March 31, 2008.Consequently, 2008 results for these companies do notreflect the adverse market conditions that occurred inthe second half of 2008.The performance of this group was dominated bythe six Chinese companies. Sales by the Chinesebased companies included in this group amounted to$8.0 billion, up by 31% from the $6.1 billion reportedin 2007, and representing 58% of the total sales ofthe group. The increase in sales was led by Lee &Man <strong>Paper</strong> and Nine Dragons <strong>Paper</strong> (both mainlycontainerboard) posting increases of 75% and 57%respectively. As a result, Lee & Man moved to the 74thplace on the PwC Top 100 list, up from 95th place,and Nine Dragons moved up to 52nd place on the list,up from 65th.Both Lee & Man and Nine Dragons have increasedcapacity, but due to market conditions, bothcompanies have revised further expansion plans inresponse to the downturn in the global economy.ROCE was 7.2% slightly down from 7.7% in 2007.Sino-<strong>Forest</strong> (mainly Chinese plantations investor andtrader) had the highest ROCE in the region at 12.7%followed by Lee & Man at 12.4%. They were the onlycompanies that achieved over 10% ROCE in 2008.Overall, ROCE of the six Chinese companies was 8.1%down from 10.4 % in 2007. Shandong Chenming wasthe only Chinese company that recognised a modestgrowth in its ROCE at 7.8% (2007: 6.3%), in additionto Ballarpur (India) and Hansol (Korea) at 8.6% (2007:8.3%), and 2.9% (2007: 1.2%) respectively. Thisimprovement is mainly due to higher production andsales volumes. Production efficiency was improved bycontinued closures of old capacity and the benefit ofnew, more efficient capacity coming on stream.
RussiaDue either to limited publicly available financialinformation or size there are no Russian companies inthe PwC Top 100 list and their financial results are notaddressed here.Despite the limited scale of Russian companies,the country has had a major impact on global FPPdevelopments. It possesses the world’s largest forestresources and had assumed primacy in recent yearsas the world’s largest exporter of unprocessed timber.As part of moves aimed at encouraging investmentin value added processing in Russia, the governmenthad introduced an escalating scale of export duties onunprocessed roundwood, with the largest increase dueto take effect in January 2009.In November 2008, the Russian government announcedthat the increases would be postponed by nine to twelvemonths. Companies in regions where Russian exportsform a large component of fibre supply have beenlooking to reduce their dependence on Russian sources;shipments to China, Finland, and Japan, all majorbuyers of Russian logs, declined substantially in 2008.Press reports indicate that rough timber exports overalldecreased by 54%, although the global economicslowdown may also have been a factor here.Finnish press reports in June 2009 quote Prime MinisterVladimir Putin as saying that Russia no longer plans tofurther raise duties on exported wood, but at the timeof finalising this report, official confirmation from theRussian government was outstanding.Other regionsOur PwC Top 100 includes companies from someregions not addressed in detail in this analysis,notably Australia and South Africa. Sales for theone Australian (<strong>Paper</strong>linX) and two South Africancompanies (Sappi & Nampak) remained flat at$13.3 billion, compared to $12.9 billion in 2007. Netprofit dropped notably for the two South Africancompanies, declining from $241 million in 2007 to$72 million in 2008, primarily as a result of impairmentand restructuring charges.Table 9: Financial Summary Information by Country/Region(US $ millions)Company Name Sales Net Income ROCE Cash Flow Debt to Return on Return on(Loss) from Ops Equity Sales Equity2008 2007 Change 2008 2007 Change 2008 2007 2008 2007 2008 2007 2008 2007 2008 2007$ $ % $ $ % % % $ $ % % % %EuropeFinland 44,428 43,684 1.7 (1,624) (189) 757.8 1.0 3.0 2,268 3,748 0.87 0.70 0.4 2.5 0.8 4.6Sweden 26,766 25,401 5.4 1,482 1,913 -22.6 4.8 5.4 2,191 2,902 0.78 0.40 5.0 6.9 6.9 7.7Other 56,983 52,578 8.4 (1,342) 1,573 -185.4 3.2 6.6 3,723 3,732 1.14 0.90 0.4 4.4 1.0 10.6Total Europe 128,177 121,663 5.4 (1,484) 3,297 -145.1 2.9 5.0 8,182 10,382 0.94 0.67 1.3 4.2 2.7 7.5US 104,041 100,221 3.8 (2,944) 5,608 -152.5 2.9 5.2 6,950 9,838 2.10 1.20 0.8 3.7 2.8 9.7Japan 50,088 42,382 18.2 597 764 -22.0 2.1 2.5 3,731 3,247 1.46 0.81 1.5 2.2 3.9 5.5Canada 29,883 27,482 8.7 (4,041) (889) 354.7 -5.0 0.0 502 537 1.90 1.15 -7.9 -2.4 -22.4 -5.1Emerging MarketsLatin America 17,814 16,930 5.2 (1,271) 3,779 -133.7 3.0 9.0 4,525 4,467 0.94 0.61 3.7 18.2 3.1 14.3Emerging Asia 13,840 11,604 19.3 1,041 968 7.0 7.2 7.7 2,026 1,482 0.97 0.68 7.4 8.2 11.0 12.7South Africa 6,904 6,421 7.5 72 241 -70.1 4.6 5.2 431 682 1.60 1.19 3.5 3.8 11.5 11.5Australia 6,387 6,551 -2.5 62 67 -7.5 3.0 5.0 80 120 0.47 0.65 0.3 1.0 1.5 5.0357,134 333,254 7.2 (7,968) 13,835 -157.6 2.4 4.9 26,427 30,755 1.30 0.90 0.9 4.1 1.9 8.0Source: PricewaterhouseCoopers LLP© 2009 PricewaterhouseCoopers LLP 23
<strong>Survey</strong> methodologyThe PricewaterhouseCoopers <strong>Global</strong> <strong>Forest</strong>, <strong>Paper</strong> & <strong>Packaging</strong><strong>Industry</strong> <strong>Survey</strong> examines the 100 largest forest, paper andpackaging products companies in the world — whether state,private, publicly owned, or a division of a larger entity — rankedby sales, provided there is sufficient public disclosure to allowmeaningful analysis.The data reported is drawn from a number of sourcesincluding annual reports, websites, press releasesand the companies. Information may be unaudited.There are known to be several companies, mainlyprivately-owned entities, that are of sufficient size towarrant inclusion in the Top 100, but which have beenexcluded due to no or limited financial informationbeing available. These companies include but are notlimited to:North AmericaGeorgia-Pacific (part of Koch Industries), Kruger, Tolkoand MenashaEuropeTetrapak (Sweden), SAICA (Spain), Fritz Egger (Austria),Elopak (Norway), Papierfabrik Palm (Germany),Fedrigoni Group (Italy) and Ilim Pulp (Russia)Asia PacificAsia Pulp and <strong>Paper</strong> (APP) (Indonesia and China),APRIL (Singapore/Indonesia), Rank Group (NewZealand) and Visy Industries (Australia)The PwC Top 100 results include only companieswhose forest, paper and fibre packaging productsbusiness comprise more than 50% of total sales.Companies are grouped based on the location of theirhead offices. Financial results are for the companies’fiscal year ends. The 2008 Japanese data is fortheir fiscal year ended March 31, 2008. The 2007comparative corporate data included in this <strong>Survey</strong> issourced from the data reported in the companies’ 2008annual reports. PwC has made adjustments to reportedfigures as footnoted on the PwC Top 100. PwC takes noresponsibility for the accuracy of the adjusted figures.Return On Capital Employed (ROCE) is calculated asnet income before unusual items, minority interestand interest expense, on an after-tax basis, divided byaverage total assets less average non-interest bearingcurrent liabilities. Cash flow from operations excludeschanges in working capital.Foreign exchange fluctuations can have a significantimpact on the data presented. This <strong>Survey</strong> hasdirectly adopted the results of companies that reportin US dollars; otherwise we have translated incomestatement items at the 2008 and 2007 average ratesfor the calendar years (irrespective of year ends within2008). Balance sheet items have been translated at therates as of December 31, 2008 and 2007 respectively.24PricewaterhouseCoopers’ <strong>Global</strong> <strong>Forest</strong>, <strong>Paper</strong> & <strong>Packaging</strong> <strong>Industry</strong> <strong>Survey</strong>: 2009 Edition – <strong>Survey</strong> of 2008 Results
Table 10: Exchange RatesCurrency Type Year End USD@Dec 31USDAverageEuro@Dec 31EuroAverageAustralian Dollar 2008 0.703 0.853 0.4900 0.5774Australian Dollar 2007 0.876 0.838 0.5950 0.6120Brazilian Real 2008 0.432 0.557 0.3030 0.3775Brazilian Real 2007 0.565 0.516 0.3840 0.3760British Pound 2008 1.459 1.855 1.0272 1.2597British Pound 2007 1.997 2.001 1.3570 1.4620Canadian Dollar 2008 0.820 0.944 0.5806 0.6419Canadian Dollar 2007 1.019 0.935 0.6930 0.6820Chilean Peso (000s) 2008 1.560 1.950 1.1290 1.3200Chilean Peso (000s) 2007 2.010 1.920 1.3700 1.4000Chinese Renminbi 2008 0.147 0.144 0.1041 0.0986Chinese Renminbi 2007 0.137 0.132 0.0930 0.0960Euro 2008 1.397 1.471 1.0000 1.0000Euro 2007 1.473 1.370 1.0000 1.0000Hong Kong Dollar 2008 0.129 0.128 0.0914 0.0878Hong Kong Dollar 2007 0.128 0.128 0.0871 0.0937Indonesian Rupiah (000s) 2008 0.090 0.100 0.0642 0.0700Indonesian Rupiah (000s) 2007 0.110 0.110 0.0700 0.0800Indian Rupie 2008 0.021 0.023 0.0144 0.0157Indian Rupie 2007 0.025 0.024 0.0170 0.0170Japanese Yen (000s) 2008 11.020 9.700 6.3820 6.1900Japanese Yen (000s) 2007 8.910 8.500 6.3600 6.6800Korean Won (000s) 2008 0.790 0.930 0.5637 0.6300Korean Won (000s) 2007 1.070 1.080 0.7300 0.7900Mexican Peso 2008 0.073 0.091 0.0520 0.0616Mexican Peso 2007 0.092 0.092 0.0620 0.0670New Zealand Dollar 2008 0.579 0.715 0.4109 0.4844New Zealand Dollar 2007 0.775 0.736 0.5260 0.5370Norwegian Krone 2008 0.144 0.180 0.1009 0.1219Norwegian Krone 2007 0.185 0.171 0.1250 0.1250Singapore Dollar 2008 0.698 0.708 0.4920 0.4824Singapore Dollar 2007 0.692 0.664 0.4700 0.4850South African Rand 2008 0.105 0.123 0.0752 0.0836South African Rand 2007 0.156 0.142 0.0990 0.1040Swedish Krona 2008 0.128 0.154 0.0912 0.1042Swedish Krona 2007 0.156 0.148 0.1060 0.1080Swiss Franc 2008 0.933 0.926 0.6720 0.6306Swiss Franc 2007 0.888 0.834 0.6030 0.6080Taiwan Dollar 2008 0.030 0.032 0.0216 0.0217Taiwan Dollar 2007 0.031 0.031 0.0210 0.0220Thai Baht 2008 0.029 0.031 0.0207 0.0209Thai Baht 2007 0.034 0.032 0.0210 0.0230© 2009 PricewaterhouseCoopers LLP 25
PricewaterhouseCoopers 22 nd Annual<strong>Global</strong> <strong>Forest</strong> & <strong>Paper</strong><strong>Industry</strong> ConferenceRe-energising the forest,paper and packaging industryDuring a difficult economy and a severely troubledtime in the industry, Bruce McIntyre, Canadian Leaderof PricewaterhouseCoopers (PwC) <strong>Forest</strong>, <strong>Paper</strong> &<strong>Packaging</strong> practice, welcomed close to 400 peoplefrom across the globe to PwC’s 22nd Annual <strong>Global</strong><strong>Forest</strong> and <strong>Paper</strong> (FPP) <strong>Industry</strong> Conference on14 May in Vancouver.At this year’s conference we welcomed colleagues notonly from the FPP sector but also in the bioenergy,government and energy sectors who brought newperspectives to the conference’s theme of re‐energisingthe forest and paper industry.Throughout the day participants heard views on themultiple issues facing the sector today and engagedin discussion of new opportunities.The financial wallCraig Campbell rightly commented that the forestindustry has experienced some of the heaviest lossesin its entire history.“The economic tsunami that hit last Fall washed awayhopes of an upswing in the sector,” said Campbell.“We’re working with this new version of normal, wherelow prices, low earnings, and pessimistic forecasts arethe way things are.”Jock Finlayson agreed with Campbell. “While everyoneknows the dismal year we are in,” Finlayson said “atleast 2009 is only 12 months”.Don Roberts echoed Finlayson, when he said it’sdifficult for even those companies with strong balancesheets to operate due to capital rationing. However,Don sees some bright spots on the horizon—forinstance, China’s CAD $725 billion stimulus package.The impact is already showing, with a clear turnaroundin the perceived business conditions in China. ButRoberts wonders is this enough? Clearly, he said “theindustry’s transformation is just starting”.According to Mike Vermette, “To survive the downturnand position for post 2011 success, operationalimprovements will also be required.” Vermette citesproduction curtailments, sales of non-core assets andfreezing of non-strategic expenditures among otherimprovements to undertake.There seems to be a perfect storm of challenges forthe industry highlighted by Market Outlook panelists,Chris McIver, Roman Hohol, Daniel Veniez andClark Binkley. Common themes were decreaseddemand in most product categories and a need forfundamental change.McIver cites new home volumes which have beendropping since mid 2006 but also believes thatdemographics in the US indicate strong future housingdemand. For his part, Hohol believes that setting asidethe cyclical drop, there is a secular slide in demand forprinting and writing papers, with the rapid adoption ofnew media technologies being the main contributor,and that future demand will be impacted by consumermedia and entertainment spending habits, changesin media distribution channels, media company andadvertiser strategies and environmental issues. Yetaccording to Hohol, China, and its potential voraciousdemand could still be a life saver for graphics papers.Meanwhile Binkley commented on timber demand,which is derived from mill capacity. With the closureof manufacturing capacity that means that timberdemand and prices will not recover as rapidly asproduct prices. According to Binkley, “The longer thedownturn, the slower the recovery: timber is being“stored on the stump” and that supply will tend toattenuate price increases.”Veniez knows the problems, which are well documented.The first step according to Veniez, “Start at the top. Notonly does there have to be a political will for changebut boards, unions and government will have to worktogether. Fundamental reform is the only solution.”26PricewaterhouseCoopers’ <strong>Global</strong> <strong>Forest</strong>, <strong>Paper</strong> & <strong>Packaging</strong> <strong>Industry</strong> <strong>Survey</strong>: 2009 Edition – <strong>Survey</strong> of 2008 Results
The innovation imperativeInnovation will be key. FPP companies must developnew and creative strategies to reduce costs, improvemargins and implement new solutions.John Allan feels that one emerging bright light isthe potential in British Columbia (BC) to build aworld class bioenergy capability. John says woodis the best product and BC is in a unique positionto take advantage of the convergence of economic,environmental, and energy security concerns.Donna Harman encourages new technology andbelieves that the advent of new industry entrants will helpexisting producers weather the financial storm. CurrentAF&PA competitiveness policy issues include bioenergymandates, climate change, increasing energy supply,tax policies, green procurement for wood and paperproducts, and recycling.When it comes to government intervention, theHonorable Lisa Raitt believes strongly in collaboration.Jobs are being lost and lives in the forest-dependenteconomy are being affected by the downturn. Sheencouraged the Canadian forest industry to not justweather the storm, but to chart its own course andcall the shots. She noted that the government doeshave programs in place to ensure the industry is readyfor when the upswing comes. The CAD$1 billionCommunity Adjustment Fund announced at theconference is intended to provide support tocommunities across Canada so that they can exploreand develop new ideas, broaden and diversify to createjobs, especially in the resources sector.Further, Ottawa has said it will help Canadian pulpproducers struggling because of the renewable energytax credits gained by their US rivals.Options and challengesDevelopments in the bioenergy field offer newopportunities for re-energizing the forest industry,according to speakers from Catchlight Energy, InduforOy and Pristine Power.Catchlight is a Chevron and Weyerhaeuser jointventure created to commercialize large scaleproduction of liquid transportation fuels fromsustainable forest based resources.“A joint venture in all aspects of the value chain,” saidMichael Burnside. But they face many challenges.According to Burnside, it is critical to get sustainabilityright or the business model will not work well.Furthermore, he feels overcoming many hurdles,including the need to demonstrate to a skepticalpublic that the model is genuinely sustainable, isessential. Due to the cost of fibre used in productionof energy, the price of oil will also play a critical role.Burnside feels that as the economy starts to improveso will the demand for oil. “The breaking point is atabout $70 per barrel, but biofuels should supplement,not totally displace oil.”Petri Lehtonen doesn’t think that forest owners willbe able to rely solely on bioenergy, rather they mustdiversify and partner. “Joint ventures have theiradvantages since the cost to convert canbe staggering.”“We have to work cooperatively,” said HarvieCampbell, Executive Vice President with Pristine PowerInc, which in the business of developing, owning andoperating independent biomass power facilities thatwill produce and sell electricity, and in some cases,sell process steam to industrial users. “The policies inplace are ok. It’s implementation that’s key.”© 2009 PricewaterhouseCoopers LLP 27
PricewaterhouseCoopers 22 nd Annual <strong>Global</strong> <strong>Forest</strong> & <strong>Paper</strong> <strong>Industry</strong> ConferenceWhat are they going to do about it?When CEOs sat on stage and discussed the future ofthe industry, they were filled with hope from lessonslearned as well as working towards revitalised businessplans and strategies. For many it’s a survival andstrategy story. According to Jim Shepard, the downturncould be an opportunity for BC to once again becomea real competitive player in the market, but it will take aconcerted effort from everyone involved—companies,labour, government etc.Although it is on their agenda, bioenergy is not yeta priority for many companies. Shepard says thatbioenergy will be based on good economics and ongovernment stimulus. Yet, it’s always good practiceto consider the best use of a tree once it has fallen—first lumber, second chips and third the residue. Butwhole tree harvesting for energy is not viable. “It’s tooexpensive to generate something like electricity fromthat tree.”Magnus Hall noted that bioenergy will depend on thecost and making the best use of the tree—emphasisingthat a forest is a renewable resource and if properlyused could provide increased value to a company.This is a point Richard Garneau agreed with, howeverhe remarked that “consumers will be the ones payinghigher prices” if costs increase. Garneau also notedthat the industry is green by default and everyone iscommitted and looking to define the green credentialsand reputation of the forest industry.Indeed, Hall says, companies are taking more decisiveaction and 2008 has proved that the industry is learningand capitalizing on the opportunities ahead of them.But bioenergy demand has the potential to destroy orsave the pulp and paper industry, largely based on theability to pay. Hall notes that the facilities should aimfor self-sufficiency and take mind of possible powerproducer monopolies.So what’s next?Certainly collaboration and diversification will behigh on the list of action items. The industry needs totransform itself with new ways of doing business inaddition to the fundamentals of reducing costs andexpanding markets. Indeed, the opportunity exists torevitalise the forest industry and its competitivenessby making use of technology and abundant forestresources for the production of forest and paperproducts, bioenergy and other bioproducts in anenvironmentally conscious manner, thus enhancingsustainable economic development.
Panelists:John AllanPresident, BC Lumber Trade CouncilPresident & CEOCouncil of <strong>Forest</strong> IndustriesVancouverClark BinkleyManaging Director, International<strong>Forest</strong>ry Investment Advisors, LLCBostonMichael BurnsidePresident & CEO, Catchlight Energy LLCSan FranciscoCraig CampbellLeader, Performance Improvement,<strong>Forest</strong>, <strong>Paper</strong> & <strong>Packaging</strong> PracticePricewaterhouseCoopers LLPVancouverHarvie CampbellExecutive Vice-PresidentPristine Power Inc.VancouverJock FinlaysonExecutive Vice-President, PolicyBusiness Council of British ColumbiaVancouverRichard GarneauPresident and CEOCatalyst <strong>Paper</strong>VancouverMagnus HallCEOHolmen ABChairman, Confederation of European<strong>Paper</strong> IndustriesStockholmDonna HarmanPresident & CEOAmerican <strong>Forest</strong> & <strong>Paper</strong> AssociationWashington, DCRoman HoholDirector, Marketing Practice AreaAMEC <strong>Forest</strong> <strong>Industry</strong> ConsultingTorontoPetri LehtonenDeputy Managing DirectorIndufor OyHelsinkiChris McIverVice-President, Lumber SalesWest Fraser TimberQuesnelDon RobertsManaging DirectorCIBC World Markets Inc.OttawaJames ShepardCEOCanfor CorporationVancouverDaniel VeniezChairmanDDV Enterprises LimitedVancouverMike VermettePartner, Corporate Advisoryand RestructuringPricewaterhouseCoopers LLPVancouverLuncheon speaker:Hon. Lisa RaittMember of Parliament for Halton, Ontarioand Minister of Natural ResourcesMark yourcalendarPricewaterhouseCoopers 23 rdAnnual <strong>Global</strong> <strong>Forest</strong> & <strong>Paper</strong><strong>Industry</strong> ConferenceMay 11, 2010 – Vancouver, CanadaWestin Bayshore Resort & Marina
Publications from PricewaterhouseCoopers <strong>Forest</strong>, <strong>Paper</strong> & <strong>Packaging</strong>practice are available to download from www.pwc.com/fpp<strong>Global</strong> reviews<strong>Forest</strong>, <strong>Paper</strong> and <strong>Packaging</strong> Deals —<strong>Global</strong> deals activity in the forest, paper &packaging industry (2009)This publication reviews 2008 deal activity in the forestry,paper and fibre packaging sectors, exploring the key driversbehind transactions in the industry. The analysis also focuseson deal activity by key regions and considers the futuretransactions outlook. The 2009 edition included a series ofdeal dialogues around the following issues: making the mostof M&A opportunities in a downturn; re-energising the forestproducts industry through the use of available wood feedstockand industry infrastructure to generate new sources of revenuefrom bioenergy, biofuels, biochemicals and other bioproducts;and the widening scope of funders’ sustainability screening.CEO Perspectives — Viewpoints of CEOs in forest,paper & packaging companies worldwide (2008)Our second edition of CEO Perspectives summarises thethoughts of 26 CEOs, or equivalent, from the forest, paper &non-paper packaging sectors around the world on key issuesfacing the industry. The thoughts of CEOs of companiesbased in North America; South America; the Middle East,Europe & Africa (EMEA); and Asia, were drawn from face-tofaceand telephone interviews conducted between Augustand December 2007. The combined sales revenue of thecompanies interviewed was over $120 billion. Questionswere focused, but not exclusively, on the following topics:cost structure, customers, supply chain and sustainability.The third edition is scheduled for publication in Fall 2009.IFRS in FPP — Applying IFRS in the forest,paper & packaging industry (2007)This publication and corresponding website (www.pwc.com/fpp/ifrs) contain our developing solutions to help our clients inunderstanding the implications of IFRS on the forest, paper &packaging industry.Technical issuesRegional reviewsPutting IFRS in Motion — The impact of InternationalFinancial Reporting Standards (IFRS) on theCanadian forest, paper and packaging sector (2009)This report draws on PwC’s experience working with morethan 12,000 companies during their IFRS transition and detailsvaluable lessons applicable to Canada’s forest, paper andpackaging sector. In particular the report discusses some ofthe differences between Canadian GAAP and IFRS and howwe can manage your transition to the new reporting language.Risks & Rewards – <strong>Forest</strong>, paper & packaging inSouth America (2007)This publication addresses the state of the industry inSouth America — a series of interesting growth markets forforest, paper and packaging products — and reflects on keyconsiderations for potential investors. With the lowest woodcosts of any leading producer region, South America looksset to become a dominant producer of market pulp globally.The publication includes a major focus on Brazil as well assections on other key South American markets — Argentina,Chile, Colombia & Uruguay.Related materialsOutlook for Newspaper Publishingin the Digital Age (2009)This study examines the outlook for newspaper publishersas they deal with long-term structural challenges relatedto declining circulation and ad sales, adapt to the digitalrevolution, and cope with the continuing fallout of the globaleconomic slowdown. Research by PwC’s Entertainment &Media <strong>Industry</strong> practice, carried out in cooperation with theWorld Association of Newspapers (WAN), focuses on twokey issues: the change of consumer behaviour with respectto their consumption of news content, and the response ofnewspaper publishers, advertisers, advertising agencies andmedia buyers to these changes.<strong>Forest</strong> <strong>Industry</strong>: Application Review of IAS 41,Agriculture: The Fair Value of Standing Timber (2009)This study reviews how fair value is being applied by forestowning companies using IFRS. It aims to provide insight intothe key judgments that are being made or have been made bypreparers from around the world and highlights some of thedifficulties as well as similarities and differences.30PricewaterhouseCoopers’ <strong>Global</strong> <strong>Forest</strong>, <strong>Paper</strong> & <strong>Packaging</strong> <strong>Industry</strong> <strong>Survey</strong>: 2009 Edition – <strong>Survey</strong> of 2008 Results
PricewaterhouseCoopers <strong>Global</strong> <strong>Forest</strong>, <strong>Paper</strong> & <strong>Packaging</strong> practicecomprises a network of industry professionals located in over 35countries around the world.<strong>Global</strong> LeaderClive SucklingPhone: +44 (20) 7213 4887<strong>Global</strong> MarketingJoy WintonPhone: +44 (20) 7804 6008Performance Improvement Leader,<strong>Global</strong> FPPCraig CampbellPhone: +1 (604) 806 7603ArgentinaMariano TomatisPhone: +54 (11) 4850 4716FranceBenoît PinochePhone: +33 (2) 5184 3636Middle EastRobert BarndenPhone: +966 (01) 465 4240South AfricaHeinz ZastrauPhone: +27 (11) 797 4431AustraliaAndrew McPhersonPhone: +61 (2) 8266 3275GermanyAlexander WinterPhone: +49 (89) 5790 5400NetherlandsRob DekkerPhone: +31 (10) 407 5230South KoreaKwang-Oh KimPhone: +82 (2) 709 0690AustriaIan MurdochPhone: +43 (1) 5018 81420IndiaRajan WadhawanPhone: +91 (124) 462 0555New ZealandJonathan FreemanPhone: +64 (9) 355 8303SpainJavier DomingoPhone: +34 (94) 602 2511BrazilMarcelo OrlandoPhone: +55 (11) 3674 3875IndonesiaJumadi AngganaPhone: +62 (21) 521 2901NorwayErling ElsrudPhone: +47 (95) 260 005SwedenBo LagerströmPhone: +46 (8) 5553 3041CanadaBruce McIntyrePhone: +1 (604) 806 7595ChileRicardo ArranoPhone: +56 (2) 940 0000ChinaKenny Ch YeungPhone: +852 2289 2310ColombiaGustavo DreispielPhone: +57 (1) 635 4802EcuadorRoberto TugendhatPhone: +593 (4) 228 8199 641FinlandJuha WahlroosPhone: +358 (9) 2280 1437IrelandJohn McdonnellPhone: +353 (1) 792 8559ItalyMaria Teresa BernelliPhone: +39 (461) 237 004JapanMasahiko HagimoriPhone: +81 (0) 80 3158 6698MalaysiaKah Seong FanPhone: +60 (82) 423 308MexicoJavier MonroyPhone: +52 (55) 5263 6114PolandEwa WoroszylPhone: +48 (22) 523 4381PortugalAntónio CorreiaPhone: +351 (225) 433 114Russia (+ CEE)Alexei IvanovPhone: +7 495 967 6000SingaporeTeck Soon ChewPhone: +65 (62) 363 328SlovakiaMaria FruhwaldovaPhone: +421 (2) 5935 0400SwitzerlandArno FrieserPhone: +41 (58) 792 2656UKClive SucklingPhone: +44 (20) 7213 4887UruguayDaniel GarciaPhone: +598 (2) 916 0463U.S.Todd StroupPhone: +1 (678) 419 1418VenezuelaVictor NietoPhone: +58 (281) 418 7935www.pwc.com/fpp
www.pwc.com/fppPricewaterhouseCoopers is committed to environmentalstewardship, including sound paper procurement andusage practices that ensure the sustainability of forestsand other natural resources.To reach this goal we have developed policies andprocedures to guide our paper procurement and use,to promote the responsible use of natural resources,and to recognize and support the environmentalinitiatives of our suppliers.The text pages of this document 1 are printed onElectrastar 45, containing 100% certified wood fiber,and produced by Catalyst <strong>Paper</strong> in accordance withPricewaterhouseCoopers Independent Chain of CustodyStandard. (www.pwc.com/fpp/icoc). This Standardfacilitates tracking of the environmental attributes ofpaper and wood products from the forest to the customerincluding wood fiber certified to CSA, SFI, PEFC andFSC sustainable forest management standards.The cover is printed on Domtar Cougar 80lb coverwhich contains 10% post-consumer waste and isderived from well-managed forests.This document was printed by Teldon Print Media,Richmond, British Columbia, using vegetable-based inks.www.pwc.com/fpp© 2009 PricewaterhouseCoopers LLP. All rights reserved.“PricewaterhouseCoopers” refers to the network of member of firmsof PricewaterhouseCoopers International Limited, each of which is aseparate and independent legal entity.Registration by PricewaterhouseCoopers LLP (Canada): detailsof Certificate # PwC-ICOC-217 at http://www.catalystpaper.com1. Printing specifications refer to the original published document.


