


Create successful ePaper yourself
Turn your PDF publications into a flip-book with our unique Google optimized e-Paper software.
III SECTOR EXTERNO<br />
Valor<br />
(Millones <strong>de</strong> dó<strong>la</strong>res)<br />
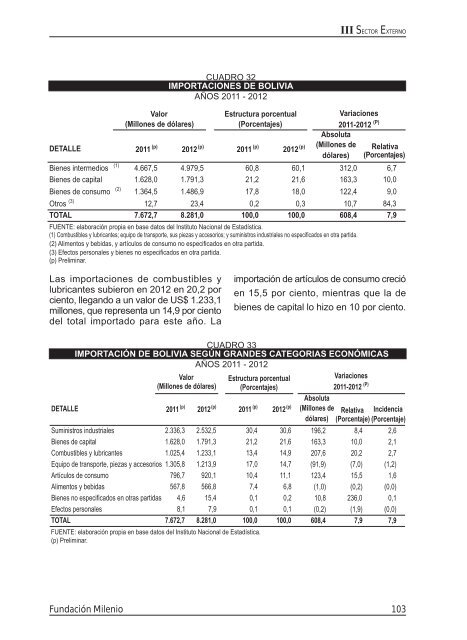
CUADRO 32<br />
IMPORTACIONES DE BOLIVIA<br />
AÑOS 2011 - <strong>2012</strong><br />
Estructura porcentual<br />
(Porcentajes)<br />
DETALLE 2011 (p) <strong>2012</strong> (p) 2011 (p) <strong>2012</strong> (p) (Millones <strong>de</strong><br />
dó<strong>la</strong>res)<br />
Absoluta<br />
Variaciones<br />
2011-<strong>2012</strong> (P)<br />
Re<strong>la</strong>tiva<br />
(Porcentajes)<br />
Bienes intermedios (1) 4.667,5 4.979,5 60,8 60,1 312,0 6,7<br />
Bienes <strong>de</strong> capital 1.628,0 1.791,3 21,2 21,6 163,3 10,0<br />
Bienes <strong>de</strong> consumo (2) 1.364,5 1.486,9 17,8 18,0 122,4 9,0<br />
Otros (3) 12,7 23,4 0,2 0,3 10,7 84,3<br />
TOTAL 7.672,7 8.281,0 100,0 100,0 608,4 7,9<br />
FUENTE: e<strong>la</strong>boración propia en base datos <strong>de</strong>l Instituto Nacional <strong>de</strong> Estadística.<br />
(1) Combustibles y lubricantes; equipo <strong>de</strong> transporte, sus piezas y accesorios; y suministros industriales no especificados en otra partida.<br />
(2) Alimentos y bebidas, y artículos <strong>de</strong> consumo no especificados en otra partida.<br />
(3) Efectos personales y bienes no especificados en otra partida.<br />
(p) Preliminar.<br />
Las importaciones <strong>de</strong> combustibles y<br />
lubricantes subieron en <strong>2012</strong> en 20,2 por<br />
ciento, llegando a un valor <strong>de</strong> US$ 1.233,1<br />
millones, que representa un 14,9 por ciento<br />
<strong>de</strong>l total importado para este año. La<br />
importación <strong>de</strong> artículos <strong>de</strong> consumo creció<br />
en 15,5 por ciento, mientras que <strong>la</strong> <strong>de</strong><br />
bienes <strong>de</strong> capital lo hizo en 10 por ciento.<br />
CUADRO 33<br />
IMPORTACIÓN DE BOLIVIA SEGÚN GRANDES CATEGORIAS ECONÓMICAS<br />
AÑOS 2011 - <strong>2012</strong><br />
Valor<br />
(Millones <strong>de</strong> dó<strong>la</strong>res)<br />
Estructura porcentual<br />
(Porcentajes)<br />
Variaciones<br />
2011-<strong>2012</strong> (P)<br />
DETALLE 2011 (p) <strong>2012</strong> (p) 2011 (p) <strong>2012</strong> (p) (Millones <strong>de</strong> Re<strong>la</strong>tiva Inci<strong>de</strong>ncia<br />
Absoluta<br />
dó<strong>la</strong>res) (Porcentaje) (Porcentaje)<br />
Suministros industriales 2.336,3 2.532,5 30,4 30,6 196,2 8,4 2,6<br />
Bienes <strong>de</strong> capital 1.628,0 1.791,3 21,2 21,6 163,3 10,0 2,1<br />
Combustibles y lubricantes 1.025,4 1.233,1 13,4 14,9 207,6 20,2 2,7<br />
Equipo <strong>de</strong> transporte, piezas y accesorios 1.305,8 1.213,9 17,0 14,7 (91,9) (7,0) (1,2)<br />
Artículos <strong>de</strong> consumo 796,7 920,1 10,4 11,1 123,4 15,5 1,6<br />
Alimentos y bebidas 567,8 566,8 7,4 6,8 (1,0) (0,2) (0,0)<br />
Bienes no especificados en otras partidas 4,6 15,4 0,1 0,2 10,8 236,0 0,1<br />
Efectos personales 8,1 7,9 0,1 0,1 (0,2) (1,9) (0,0)<br />
TOTAL 7.672,7 8.281,0 100,0 100,0 608,4 7,9 7,9<br />
FUENTE: e<strong>la</strong>boración propia en base datos <strong>de</strong>l Instituto Nacional <strong>de</strong> Estadística.<br />
(p) Preliminar.<br />
Fundación <strong>Milenio</strong><br />
103