


You also want an ePaper? Increase the reach of your titles
YUMPU automatically turns print PDFs into web optimized ePapers that Google loves.
IV LA POLÍTICA ECONÓMICA<br />
En <strong>2012</strong> <strong>la</strong> mayor parte <strong>de</strong> los gastos (82,7<br />
por ciento, ó Bs. 5.476,8 millones <strong>de</strong> Bs.<br />
<strong>de</strong> 6.618,6 millones), correspon<strong>de</strong>n a<br />
gastos <strong>de</strong> capital. Estos incluyen <strong>la</strong><br />
formación bruta <strong>de</strong> capital fijo, y <strong>la</strong>s<br />
transferencias <strong>de</strong> capital (tanto al sector<br />
privado como al público), <strong>de</strong> <strong>la</strong>s cuales<br />
<strong>la</strong>s más importantes son <strong>la</strong>s <strong>de</strong>voluciones<br />
<strong>de</strong>l IDH al nivel central <strong>de</strong>l Estado por<br />
concepto <strong>de</strong> Renta Dignidad. La<br />
acumu<strong>la</strong>ción <strong>de</strong> saldo <strong>de</strong> caja y bancos,<br />
criticada constantemente por el MEFP, es<br />
en gran parte el resultado <strong>de</strong>l superávit<br />
<strong>de</strong>partamental, reflejado en el crédito<br />
interno negativo que tienen los GAD con<br />
el BCB, que para <strong>2012</strong> alcanza a Bs.<br />
1.263,6 millones.<br />
1.6. Operaciones <strong>de</strong> los gobiernos<br />
autónomos municipale<br />
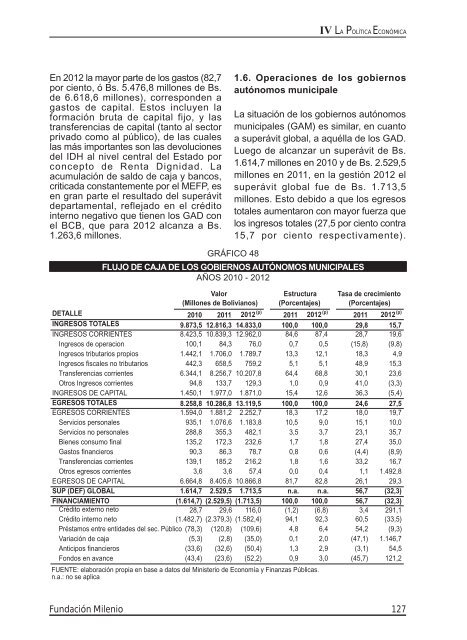
La situación <strong>de</strong> los gobiernos autónomos<br />
municipales (GAM) es simi<strong>la</strong>r, en cuanto<br />
a superávit global, a aquél<strong>la</strong> <strong>de</strong> los GAD.<br />
Luego <strong>de</strong> alcanzar un superávit <strong>de</strong> Bs.<br />
1.614,7 millones en 2010 y <strong>de</strong> Bs. 2.529,5<br />
millones en 2011, en <strong>la</strong> <strong>gestión</strong> <strong>2012</strong> el<br />
superávit global fue <strong>de</strong> Bs. 1.713,5<br />
millones. Esto <strong>de</strong>bido a que los egresos<br />
totales aumentaron con mayor fuerza que<br />
los ingresos totales (27,5 por ciento contra<br />
15,7 por ciento respectivamente).<br />
GRÁFICO 48<br />
FLUJO DE CAJA DE LOS GOBIERNOS AUTÓNOMOS MUNICIPALES<br />
AÑOS 2010 - <strong>2012</strong><br />
Valor<br />
(Millones <strong>de</strong> Bolivianos)<br />
Estructura<br />
(Porcentajes)<br />
Tasa <strong>de</strong> crecimiento<br />
(Porcentajes)<br />
DETALLE 2010 2011 <strong>2012</strong> (p) 2011 <strong>2012</strong> (p) 2011 <strong>2012</strong> (p)<br />
INGRESOS TOTALES 9.873,5 12.816,3 14.833,0 100,0 100,0 29,8 15,7<br />
INGRESOS CORRIENTES 8.423,5 10.839,3 12.962,0 84,6 87,4 28,7 19,6<br />
Ingresos <strong>de</strong> operacion 100,1 84,3 76,0 0,7 0,5 (15,8) (9,8)<br />
Ingresos tributarios propios 1.442,1 1.706,0 1.789,7 13,3 12,1 18,3 4,9<br />
Ingresos fiscales no tributarios 442,3 658,5 759,2 5,1 5,1 48,9 15,3<br />
Transferencias corrientes 6.<strong>34</strong>4,1 8.256,7 10.207,8 64,4 68,8 30,1 23,6<br />
Otros Ingresos corrientes 94,8 133,7 129,3 1,0 0,9 41,0 (3,3)<br />
INGRESOS DE CAPITAL 1.450,1 1.977,0 1.871,0 15,4 12,6 36,3 (5,4)<br />
EGRESOS TOTALES 8.258,8 10.286,8 13.119,5 100,0 100,0 24,6 27,5<br />
EGRESOS CORRIENTES 1.594,0 1.881,2 2.252,7 18,3 17,2 18,0 19,7<br />
Servicios personales 935,1 1.076,6 1.183,8 10,5 9,0 15,1 10,0<br />
Servicios no personales 288,8 355,3 482,1 3,5 3,7 23,1 35,7<br />
Bienes consumo final 135,2 172,3 232,6 1,7 1,8 27,4 35,0<br />
Gastos financieros 90,3 86,3 78,7 0,8 0,6 (4,4) (8,9)<br />
Transferencias corrientes 139,1 185,2 216,2 1,8 1,6 33,2 16,7<br />
Otros egresos corrientes 3,6 3,6 57,4 0,0 0,4 1,1 1.492,8<br />
EGRESOS DE CAPITAL 6.664,8 8.405,6 10.866,8 81,7 82,8 26,1 29,3<br />
SUP (DEF) GLOBAL 1.614,7 2.529,5 1.713,5 n.a. n.a. 56,7 (32,3)<br />
FINANCIAMIENTO (1.614,7) (2.529,5) (1.713,5) 100,0 100,0 56,7 (32,3)<br />
Crédito externo neto 28,7 29,6 116,0 (1,2) (6,8) 3,4 291,1<br />
Crédito interno neto (1.482,7) (2.379,3) (1.582,4) 94,1 92,3 60,5 (33,5)<br />
Préstamos entre entida<strong>de</strong>s <strong>de</strong>l sec. Público (78,3) (120,8) (109,6) 4,8 6,4 54,2 (9,3)<br />
Variación <strong>de</strong> caja (5,3) (2,8) (35,0) 0,1 2,0 (47,1) 1.146,7<br />
Anticipos financieros (33,6) (32,6) (50,4) 1,3 2,9 (3,1) 54,5<br />
Fondos en avance (43,4) (23,6) (52,2) 0,9 3,0 (45,7) 121,2<br />
FUENTE: e<strong>la</strong>boración propia en base a datos <strong>de</strong>l Ministerio <strong>de</strong> <strong>Economía</strong> y Finanzas Públicas.<br />
n.a.: no se aplica<br />
Fundación <strong>Milenio</strong><br />
127