INFORME ECONÓMICO DE MILENIO GESTIÓN <strong>2012</strong> 1. Crecimiento, inf<strong>la</strong>ción y <strong>de</strong>sempleo mundial De acuerdo con el FMI 2 , el ritmo <strong>de</strong> crecimiento <strong>de</strong>l Producto Interno Bruto (PIB) <strong>de</strong> <strong>la</strong> economía global continuó <strong>de</strong>sacelerándose, pasando <strong>de</strong> una tasa <strong>de</strong> crecimiento <strong>de</strong> 3,9 por ciento en 2011, a registrar un crecimiento aún más mo<strong>de</strong>rado <strong>de</strong>l 3,2 por ciento en <strong>2012</strong> (ver cuadro 1). Las economías avanzadas registraron el mismo patrón <strong>de</strong> comportamiento, pasaron <strong>de</strong> crecer a un ritmo <strong>de</strong>l 1,6 por ciento en 2011 a registrar una tasa <strong>de</strong> 1,3 por ciento en <strong>2012</strong>. Sin embargo, este no fue el caso <strong>de</strong> los Estados Unidos que creció a una tasa mayor en <strong>2012</strong>; 2,3 por ciento frente al 1,8 por ciento registrado en 2011. Estados Unidos parece haber recuperado el ritmo <strong>de</strong> crecimiento <strong>de</strong> 2,4 por ciento registrado en 2010. Japón, también parece haber superado <strong>la</strong> leve recesión marcada por una tasa <strong>de</strong> crecimiento negativa <strong>de</strong> 0,6 por ciento en 2011. Los p<strong>la</strong>nes <strong>de</strong> estímulo implementados en este país, marcados por un mayor re<strong>la</strong>jamiento monetario, han logrado estimu<strong>la</strong>r el crecimiento a corto p<strong>la</strong>zo. La economía japonesa creció en <strong>2012</strong> a un ritmo <strong>de</strong> 2,0 por ciento, si bien esta tasa está muy por <strong>de</strong>bajo <strong>de</strong>l 4,5 por ciento alcanzado en 2010, <strong>la</strong> recesión se confirma como transitoria. El <strong>de</strong>sempeño económico en <strong>la</strong> zona <strong>de</strong>l euro es <strong>la</strong> excepción al proceso <strong>de</strong> recuperación <strong>de</strong> <strong>la</strong> economía global. Esta zona registró una tasa <strong>de</strong> crecimiento negativa <strong>de</strong> -0,4 por ciento, menor a <strong>la</strong> tasa <strong>de</strong> crecimiento <strong>de</strong> 1,4 alcanzada en <strong>la</strong> <strong>gestión</strong> 2011. Si bien <strong>la</strong>s economías emergentes y en <strong>de</strong>sarrollo, entre <strong>la</strong>s que <strong>de</strong>stacan China, India y Rusia, continuaron <strong>la</strong> <strong>de</strong>saceleración iniciada en 2011, alcanzaron un ritmo <strong>de</strong> crecimiento muy por encima <strong>de</strong>l promedio mundial. India creció a una tasa <strong>de</strong> 4,5 por ciento y China alcanzó un ritmo <strong>de</strong> crecimiento <strong>de</strong>l 7,8 por ciento. Rusia, <strong>la</strong> economía que creció a una menor tasa, registró una tasa promedio <strong>de</strong> 3,6 por ciento en <strong>2012</strong>. CUADRO 1 PRODUCTO, INFLACIÓN Y DESEMPLEO EN EL MUNDO AÑOS 2010 - <strong>2012</strong> PIB (Porcentaje) Inf<strong>la</strong>ción (Porcentaje) Tasa <strong>de</strong> <strong>de</strong>sempleo promedio (Porcentaje) PAÍS 2010 2011 <strong>2012</strong> 2010 2011 <strong>2012</strong> 2010 2011 <strong>2012</strong> Mundo 5,1 3,9 3,2 - - - - - - <strong>Economía</strong>s avanzadas 3,0 1,6 1,3 1,9 2,5 1,7 8,3 7,9 8,0 Estados Unidos 2,4 1,8 2,3 1,7 3,1 1,6 9,6 9,0 8,2 Zona <strong>de</strong>l Euro 2,0 1,4 (0,4) 2,2 2,7 2,1 10,1 10,2 11,2 Alemania 4,0 3,1 0,9 1,9 2,3 2,2 7,1 6,0 5,2 Francia 1,7 1,7 0,2 1,5 2,1 1,9 9,7 9,6 10,1 Italia 1,8 0,4 (2,1) 2,1 3,7 1,5 8,4 8,4 10,6 España (0,3) 0,4 (1,4) 2,9 2,4 3,3 20,1 21,7 24,9 Japón 4,5 (0,6) 2,0 (0,3) (0,3) (0,2) 5,0 4,6 4,5 Reino Unido 1,8 0,9 (0,2) 3,4 4,7 2,2 7,9 8,0 8,1 China 10,4 9,3 7,8 4,6 4,1 2,8 4,1 4,1 4,1 India 10,1 7,9 4,5 9,5 6,5 13,0 - - - Rusia 4,3 4,3 3,6 8,8 6,1 6,7 7,5 6,5 6,0 FUENTE: e<strong>la</strong>boración propia en base a datos <strong>de</strong>l Fondo Monetario Internacional (World Economic Outlook Database). 2 Fondo Monetario Internacional. World Economic Outlook Database (www.imf.org). 2 Fundación <strong>Milenio</strong>
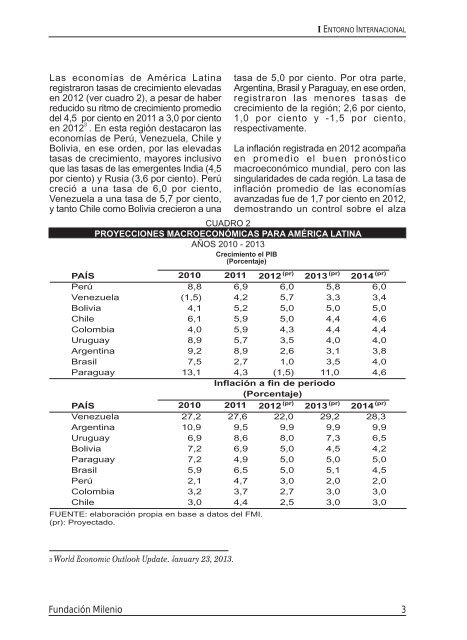
I ENTORNO INTERNACIONAL Las economías <strong>de</strong> América Latina registraron tasas <strong>de</strong> crecimiento elevadas en <strong>2012</strong> (ver cuadro 2), a pesar <strong>de</strong> haber reducido su ritmo <strong>de</strong> crecimiento promedio <strong>de</strong>l 4,5 por ciento en 2011 a 3,0 por ciento en <strong>2012</strong> 3 . En esta región <strong>de</strong>stacaron <strong>la</strong>s economías <strong>de</strong> Perú, Venezue<strong>la</strong>, Chile y Bolivia, en ese or<strong>de</strong>n, por <strong>la</strong>s elevadas tasas <strong>de</strong> crecimiento, mayores inclusivo que <strong>la</strong>s tasas <strong>de</strong> <strong>la</strong>s emergentes India (4,5 por ciento) y Rusia (3,6 por ciento). Perú creció a una tasa <strong>de</strong> 6,0 por ciento, Venezue<strong>la</strong> a una tasa <strong>de</strong> 5,7 por ciento, y tanto Chile como Bolivia crecieron a una tasa <strong>de</strong> 5,0 por ciento. Por otra parte, Argentina, Brasil y Paraguay, en ese or<strong>de</strong>n, registraron <strong>la</strong>s menores tasas <strong>de</strong> crecimiento <strong>de</strong> <strong>la</strong> región; 2,6 por ciento, 1,0 por ciento y -1,5 por ciento, respectivamente. La inf<strong>la</strong>ción registrada en <strong>2012</strong> acompaña en promedio el buen pronóstico macroeconómico mundial, pero con <strong>la</strong>s singu<strong>la</strong>rida<strong>de</strong>s <strong>de</strong> cada región. La tasa <strong>de</strong> inf<strong>la</strong>ción promedio <strong>de</strong> <strong>la</strong>s economías avanzadas fue <strong>de</strong> 1,7 por ciento en <strong>2012</strong>, <strong>de</strong>mostrando un control <strong>sobre</strong> el alza CUADRO 2 PROYECCIONES MACROECONÓMICAS PARA AMÉRICA LATINA AÑOS 2010 - 2013 Crecimiento el PIB (Porcentaje) PAÍS 2010 2011 <strong>2012</strong> (pr) 2013 (pr) 2014 (pr) Perú 8,8 6,9 6,0 5,8 6,0 Venezue<strong>la</strong> (1,5) 4,2 5,7 3,3 3,4 Bolivia 4,1 5,2 5,0 5,0 5,0 Chile 6,1 5,9 5,0 4,4 4,6 Colombia 4,0 5,9 4,3 4,4 4,4 Uruguay 8,9 5,7 3,5 4,0 4,0 Argentina 9,2 8,9 2,6 3,1 3,8 Brasil 7,5 2,7 1,0 3,5 4,0 Paraguay 13,1 4,3 (1,5) 11,0 4,6 Inf<strong>la</strong>ción a fin <strong>de</strong> periodo (Porcentaje) PAÍS 2010 2011 <strong>2012</strong> (pr) 2013 (pr) 2014 (pr) Venezue<strong>la</strong> 27,2 27,6 22,0 29,2 28,3 Argentina 10,9 9,5 9,9 9,9 9,9 Uruguay 6,9 8,6 8,0 7,3 6,5 Bolivia 7,2 6,9 5,0 4,5 4,2 Paraguay 7,2 4,9 5,0 5,0 5,0 Brasil 5,9 6,5 5,0 5,1 4,5 Perú 2,1 4,7 3,0 2,0 2,0 Colombia 3,2 3,7 2,7 3,0 3,0 Chile 3,0 4,4 2,5 3,0 3,0 FUENTE: e<strong>la</strong>boración propia en base a datos <strong>de</strong>l FMI. (pr): Proyectado. 3 World Economic Outlook Update. January 23, 2013. Fundación <strong>Milenio</strong> 3
- Page 3 and 4: Fundación Milenio INFORME de MILEN
- Page 5 and 6: CONTENIDO RESUMEN EJECUTIVO i I. EN
- Page 7 and 8: RESUMEN EJECUTIVO El contexto exter
- Page 9 and 10: mejor manera el desempeño del sect
- Page 11: I ENTORNO INTERNACIONAL La gestión
- Page 15 and 16: I ENTORNO INTERNACIONAL los países
- Page 17 and 18: I ENTORNO INTERNACIONAL se comprome
- Page 19 and 20: I ENTORNO INTERNACIONAL financieros
- Page 21 and 22: I ENTORNO INTERNACIONAL que incluy
- Page 23 and 24: I ENTORNO INTERNACIONAL US$ / BARRI
- Page 25 and 26: I ENTORNO INTERNACIONAL En la zona
- Page 27 and 28: II DESEMPEÑO PRODUCTIVO E INVERSI
- Page 29 and 30: II DESEMPEÑO PRODUCTIVO E INVERSI
- Page 31 and 32: II DESEMPEÑO PRODUCTIVO E INVERSI
- Page 33 and 34: II DESEMPEÑO PRODUCTIVO E INVERSI
- Page 35 and 36: II DESEMPEÑO PRODUCTIVO E INVERSI
- Page 37 and 38: II DESEMPEÑO PRODUCTIVO E INVERSI
- Page 39 and 40: II DESEMPEÑO PRODUCTIVO E INVERSI
- Page 41 and 42: II DESEMPEÑO PRODUCTIVO E INVERSI
- Page 43 and 44: II DESEMPEÑO PRODUCTIVO E INVERSI
- Page 45 and 46: II DESEMPEÑO PRODUCTIVO E INVERSI
- Page 47 and 48: II DESEMPEÑO PRODUCTIVO E INVERSI
- Page 49 and 50: II DESEMPEÑO PRODUCTIVO E INVERSI
- Page 51 and 52: II DESEMPEÑO PRODUCTIVO E INVERSI
- Page 53 and 54: II DESEMPEÑO PRODUCTIVO E INVERSI
- Page 55 and 56: II DESEMPEÑO PRODUCTIVO E INVERSI
- Page 57 and 58: II DESEMPEÑO PRODUCTIVO E INVERSI
- Page 59 and 60: II DESEMPEÑO PRODUCTIVO E INVERSI
- Page 61 and 62: II DESEMPEÑO PRODUCTIVO E INVERSI
- Page 63 and 64:
II DESEMPEÑO PRODUCTIVO E INVERSI
- Page 65 and 66:
II DESEMPEÑO PRODUCTIVO E INVERSI
- Page 67 and 68:
II DESEMPEÑO PRODUCTIVO E INVERSI
- Page 69 and 70:
II DESEMPEÑO PRODUCTIVO E INVERSI
- Page 71 and 72:
II DESEMPEÑO PRODUCTIVO E INVERSI
- Page 73 and 74:
II DESEMPEÑO PRODUCTIVO E INVERSI
- Page 75 and 76:
II DESEMPEÑO PRODUCTIVO E INVERSI
- Page 77 and 78:
II DESEMPEÑO PRODUCTIVO E INVERSI
- Page 79 and 80:
II DESEMPEÑO PRODUCTIVO E INVERSI
- Page 81 and 82:
II DESEMPEÑO PRODUCTIVO E INVERSI
- Page 83 and 84:
II DESEMPEÑO PRODUCTIVO E INVERSI
- Page 85 and 86:
II DESEMPEÑO PRODUCTIVO E INVERSI
- Page 87 and 88:
II DESEMPEÑO PRODUCTIVO E INVERSI
- Page 89 and 90:
II DESEMPEÑO PRODUCTIVO E INVERSI
- Page 91 and 92:
II DESEMPEÑO PRODUCTIVO E INVERSI
- Page 93 and 94:
II DESEMPEÑO PRODUCTIVO E INVERSI
- Page 95 and 96:
II DESEMPEÑO PRODUCTIVO E INVERSI
- Page 97 and 98:
II DESEMPEÑO PRODUCTIVO E INVERSI
- Page 99 and 100:
II DESEMPEÑO PRODUCTIVO E INVERSI
- Page 101 and 102:
II DESEMPEÑO PRODUCTIVO E INVERSI
- Page 103 and 104:
II DESEMPEÑO PRODUCTIVO E INVERSI
- Page 105 and 106:
II DESEMPEÑO PRODUCTIVO E INVERSI
- Page 107 and 108:
III SECTOR EXTERNO El desempeño de
- Page 109 and 110:
III SECTOR EXTERNO 1.1.1.1 Exportac
- Page 111 and 112:
III SECTOR EXTERNO Durante el 2012,
- Page 113 and 114:
III SECTOR EXTERNO Valor (Millones
- Page 115 and 116:
III SECTOR EXTERNO 1.200 1.000 GRÁ
- Page 117 and 118:
III SECTOR EXTERNO MILLONES DE DÓL
- Page 119 and 120:
III SECTOR EXTERNO CUADRO 38 SALDO
- Page 121 and 122:
III SECTOR EXTERNO CUADRO 39 TIPO D
- Page 123 and 124:
III SECTOR EXTERNO No obstante el
- Page 125 and 126:
IV LA POLÍTICA ECONÓMICA 1. La ge
- Page 127 and 128:
IV LA POLÍTICA ECONÓMICA 1.1. Ope
- Page 129 and 130:
IV LA POLÍTICA ECONÓMICA CUADRO 4
- Page 131 and 132:
IV LA POLÍTICA ECONÓMICA GRÁFICO
- Page 133 and 134:
IV LA POLÍTICA ECONÓMICA de renta
- Page 135 and 136:
IV LA POLÍTICA ECONÓMICA 1.4. Ope
- Page 137 and 138:
IV LA POLÍTICA ECONÓMICA En 2012
- Page 139 and 140:
IV LA POLÍTICA ECONÓMICA Estos da
- Page 141 and 142:
IV LA POLÍTICA ECONÓMICA años 20
- Page 143 and 144:
IV LA POLÍTICA ECONÓMICA MILLONES
- Page 145 and 146:
IV LA POLÍTICA ECONÓMICA GRÁFICO
- Page 147 and 148:
IV LA POLÍTICA ECONÓMICA CUADRO 5
- Page 149 and 150:
IV LA POLÍTICA ECONÓMICA 1.600 GR
- Page 151 and 152:
IV LA POLÍTICA ECONÓMICA El cuadr
- Page 153 and 154:
V EL SISTEMA FINANCIERO 1. Sistema
- Page 155 and 156:
V EL SISTEMA FINANCIERO 80 GRÁFICO
- Page 157 and 158:
V EL SISTEMA FINANCIERO CUADRO 57 I
- Page 159 and 160:
V EL SISTEMA FINANCIERO las accione
- Page 161 and 162:
V EL SISTEMA FINANCIERO DETALLE CUA
- Page 163 and 164:
V EL SISTEMA FINANCIERO 100 90 GRÁ
- Page 165 and 166:
V EL SISTEMA FINANCIERO expectativa
- Page 167 and 168:
V EL SISTEMA FINANCIERO GRÁFICO 64
- Page 169 and 170:
V EL SISTEMA FINANCIERO coyuntural
- Page 171 and 172:
V EL SISTEMA FINANCIERO D E T A L L
- Page 173 and 174:
ANEXO ESTIMACIÓN DE LA FORMACIÓN
- Page 175 and 176:
ANEXO CUADRO 1 COEFICIENTES DE ASIG
- Page 177 and 178:
ANEXO GENERAL Fundación Milenio 16
- Page 179 and 180:
ANEXO GENERAL ANEXO 1 BOLIVIA: INDI
- Page 181 and 182:
ANEXO GENERAL ANEXO 3a BOLIVIA: PRO
- Page 183 and 184:
ANEXO GENERAL ANEXO 5a BOLIVIA: FOR
- Page 185 and 186:
ANEXO GENERAL DETALLE 1998 1999 200
- Page 187 and 188:
ANEXO GENERAL ANEXO 9 BOLIVIA: ESTR
- Page 189 and 190:
ANEXO GENERAL ANEXO 11 BOLIVIA: IMP
- Page 191 and 192:
ANEXO GENERAL ANEXO 13 MONTOS NEGOC
- Page 193 and 194:
ANEXO GENERAL ANEXO 15 PENSIONES: D
- Page 195 and 196:
ANEXO GENERAL ANEXO 17 PRIMAS DIREC
- Page 197 and 198:
ANEXO GENERAL ANEXO 20 NÚMERO DE C
- Page 199 and 200:
ANEXO REGIONAL Fundación Milenio 1
- Page 201 and 202:
ANEXO REGIONAL ANEXO 1 CUADRO SÍNT
- Page 203 and 204:
ANEXO REGIONAL ANEXO 5a PIB: AGRICU
- Page 205 and 206:
ANEXO REGIONAL DETALLE 1997 1998 19
- Page 207 and 208:
ANEXO REGIONAL ANEXO 5i PIB: ESTABL
- Page 209 and 210:
ANEXO REGIONAL ANEXO 6a EXPORTACION
- Page 211 and 212:
ANEXO REGIONAL ANEXO 9 PRODUCTO INT