

MEDICIÓN DEL GASTO EN SIDA HONDURAS
chyH308iNSE
chyH308iNSE

You also want an ePaper? Increase the reach of your titles
YUMPU automatically turns print PDFs into web optimized ePapers that Google loves.
<strong>MEDICIÓN</strong> <strong>DEL</strong> <strong>GASTO</strong> <strong>EN</strong> <strong>SIDA</strong> / <strong>HONDURAS</strong> 2013 - 2014<br />
Tabla 2. Gasto por población beneficiaria, Honduras 2013 y 2014.<br />
POBLACIÓN B<strong>EN</strong>EFICIARIA<br />
HNL USD % HNL USD %<br />
Personas con VIH 236,097,304 11,584,755 32% 135,772,882 6,459,224 22%<br />
Población general 180,923,538 8,877,504 25% 200,890,472 9,557,111 33%<br />
Intervenciones no dirigidas 82,447,947 4,045,532 11% 81,655,824 3,884,673 13%<br />
Población en mayor riesgo 36,862,430 1,808,755 5% 46,969,890 2,234,533 8%<br />
Otras poblaciones clave 126,491,607 6,206,654 17% 63,997,614 3,044,606 10%<br />
Poblaciones específicas 71,358,696 3,501,408 10% 85,102,992 4,048,668 14%<br />
TOTAL 734,181,522 36,024,609 100% 614,389,673 29,228,814 100%<br />
Fuente: Estudios MEGAS Honduras 2013 y 2014<br />
MEGAS 2013 MEGAS 2014<br />
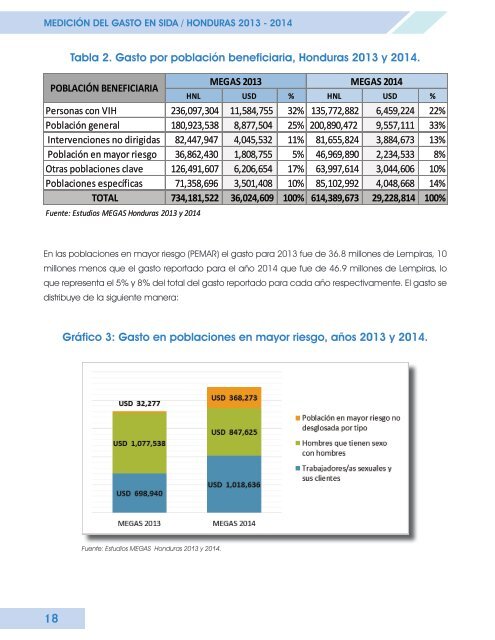
En las poblaciones en mayor riesgo (PEMAR) el gasto para 2013 fue de 36.8 millones de Lempiras, 10<br />
millones menos que el gasto reportado para el año 2014 que fue de 46.9 millones de Lempiras, lo<br />
que representa el 5% y 8% del total del gasto reportado para cada año respectivamente. El gasto se<br />
distribuye de la siguiente manera:<br />
Gráfico 3: Gasto en poblaciones en mayor riesgo, años 2013 y 2014.<br />
Fuente: Estudios MEGAS Honduras 2013 y 2014.<br />
18