

MEDICIÓN DEL GASTO EN SIDA HONDURAS
chyH308iNSE
chyH308iNSE

You also want an ePaper? Increase the reach of your titles
YUMPU automatically turns print PDFs into web optimized ePapers that Google loves.
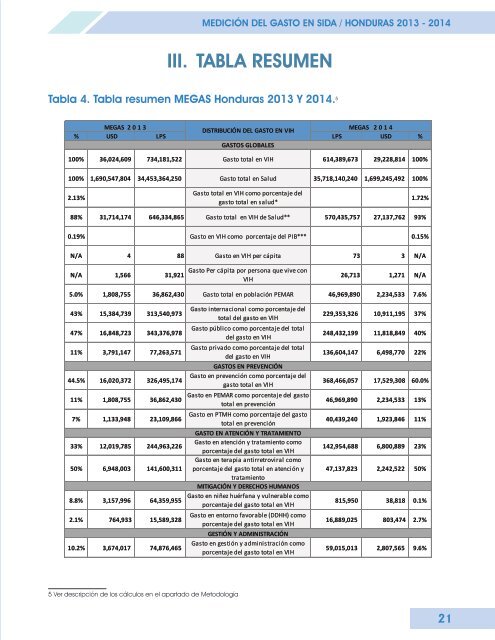
<strong>MEDICIÓN</strong> <strong>DEL</strong> <strong>GASTO</strong> <strong>EN</strong> <strong>SIDA</strong> / <strong>HONDURAS</strong> 2013 - 2014<br />
III. TABLA RESUM<strong>EN</strong><br />
Tabla 4. Tabla resumen MEGAS Honduras 2013 Y 2014. 5<br />
MEGAS 2 0 1 3<br />
DISTRIBUCIÓN <strong>DEL</strong> <strong>GASTO</strong> <strong>EN</strong> VIH<br />
MEGAS 2 0 1 4<br />
% USD LPS LPS USD %<br />
<strong>GASTO</strong>S GLOBALES<br />
100% 36,024,609 734,181,522 Gasto total en VIH 614,389,673 29,228,814 100%<br />
100% 1,690,547,804 34,453,364,250 Gasto total en Salud 35,718,140,240 1,699,245,492 100%<br />
2.13%<br />
Gasto total en VIH como porcentaje del<br />
gasto total en salud*<br />
1.72%<br />
88% 31,714,174 646,334,865 Gasto total en VIH de Salud** 570,435,757 27,137,762 93%<br />
0.19% Gasto en VIH como porcentaje del PIB*** 0.15%<br />
N/A 4 88 Gasto en VIH per cápita 73 3 N/A<br />
N/A 1,566 31,921<br />
Gasto Per cápita por persona que vive con<br />
VIH<br />
26,713 1,271 N/A<br />
5.0% 1,808,755 36,862,430 Gasto total en población PEMAR 46,969,890 2,234,533 7.6%<br />
43% 15,384,739 313,540,973<br />
47% 16,848,723 343,376,978<br />
11% 3,791,147 77,263,571<br />
44.5% 16,020,372 326,495,174<br />
11% 1,808,755 36,862,430<br />
7% 1,133,948 23,109,866<br />
33% 12,019,785 244,963,226<br />
50% 6,948,003 141,600,311<br />
8.8% 3,157,996 64,359,955<br />
2.1% 764,933 15,589,328<br />
10.2% 3,674,017 74,876,465<br />
Gasto internacional como porcentaje del<br />
total del gasto en VIH<br />
Gasto público como porcentaje del total<br />
del gasto en VIH<br />
Gasto privado como porcentaje del total<br />
del gasto en VIH<br />
<strong>GASTO</strong>S <strong>EN</strong> PREV<strong>EN</strong>CIÓN<br />
Gasto en prevención como porcentaje del<br />
gasto total en VIH<br />
Gasto en PEMAR como porcentaje del gasto<br />
total en prevención<br />
Gasto en PTMH como porcentaje del gasto<br />
total en prevención<br />
<strong>GASTO</strong> <strong>EN</strong> AT<strong>EN</strong>CIÓN Y TRATAMI<strong>EN</strong>TO<br />
Gasto en atención y tratamiento como<br />
porcentaje del gasto total en VIH<br />
Gasto en terapia antirretroviral como<br />
porcentaje del gasto total en atención y<br />
tratamiento<br />
MITIGACIÓN Y DERECHOS HUMANOS<br />
Gasto en niñez huérfana y vulnerable como<br />
porcentaje del gasto total en VIH<br />
Gasto en entorno favorable (DDHH) como<br />
porcentaje del gasto total en VIH<br />
GESTIÓN Y ADMINISTRACIÓN<br />
Gasto en gestión y administración como<br />
porcentaje del gasto total en VIH<br />
229,353,326 10,911,195 37%<br />
248,432,199 11,818,849 40%<br />
136,604,147 6,498,770 22%<br />
368,466,057 17,529,308 60.0%<br />
46,969,890 2,234,533 13%<br />
40,439,240 1,923,846 11%<br />
142,954,688 6,800,889 23%<br />
47,137,823 2,242,522 50%<br />
815,950 38,818 0.1%<br />
16,889,025 803,474 2.7%<br />
59,015,013 2,807,565 9.6%<br />
5 Ver descripción de los cálculos en el apartado de Metodología<br />
21