rapport final de la mission - Ministère de l'Habitat, de l'urbanisme et ...
rapport final de la mission - Ministère de l'Habitat, de l'urbanisme et ...
rapport final de la mission - Ministère de l'Habitat, de l'urbanisme et ...

Create successful ePaper yourself
Turn your PDF publications into a flip-book with our unique Google optimized e-Paper software.
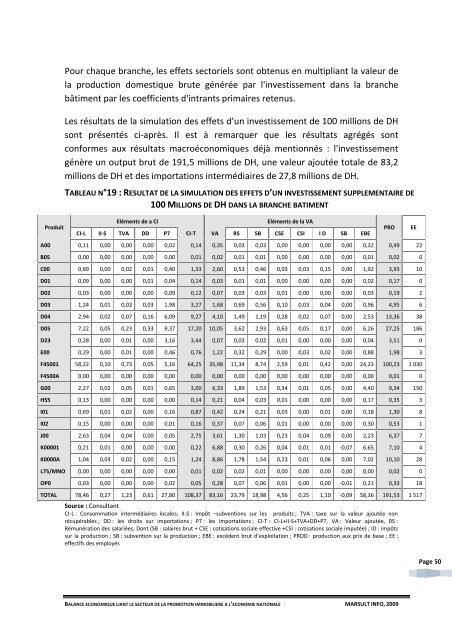
ProduitPour chaque branche, les eff<strong>et</strong>s sectoriels sont obtenus en multipliant <strong>la</strong> valeur <strong>de</strong><strong>la</strong> production domestique brute générée par l'investissement dans <strong>la</strong> branchebâtiment par les coefficients d'intrants primaires r<strong>et</strong>enus.Les résultats <strong>de</strong> <strong>la</strong> simu<strong>la</strong>tion <strong>de</strong>s eff<strong>et</strong>s d’un investissement <strong>de</strong> 100 millions <strong>de</strong> DHsont présentés ci-après. Il est à remarquer que les résultats agrégés sontconformes aux résultats macroéconomiques déjà mentionnés : l'investissementgénère un output brut <strong>de</strong> 191,5 millions <strong>de</strong> DH, une valeur ajoutée totale <strong>de</strong> 83,2millions <strong>de</strong> DH <strong>et</strong> <strong>de</strong>s importations intermédiaires <strong>de</strong> 27,8 millions <strong>de</strong> DH.TABLEAU N°19 : RESULTAT DE LA SIMULATION DES EFFETS D’UN INVESTISSEMENT SUPPLEMENTAIRE DE100 MILLIONS DE DH DANS LA BRANCHE BATIMENTEléments <strong>de</strong> a CIEléments <strong>de</strong> <strong>la</strong> VACI-L II-S TVA DD P7 CI-T VA RS SB CSE CSI I D SB EBEA00 0,11 0,00 0,00 0,00 0,02 0,14 0,35 0,03 0,03 0,00 0,00 0,00 0,00 0,32 0,49 22B05 0,00 0,00 0,00 0,00 0,00 0,01 0,02 0,01 0,01 0,00 0,00 0,00 0,00 0,01 0,02 0C00 0,89 0,00 0,02 0,01 0,40 1,33 2,60 0,53 0,46 0,03 0,03 0,15 0,00 1,92 3,93 10D01 0,09 0,00 0,00 0,01 0,04 0,14 0,03 0,01 0,01 0,00 0,00 0,00 0,00 0,02 0,17 0D02 0,03 0,00 0,00 0,00 0,09 0,12 0,07 0,03 0,03 0,01 0,00 0,00 0,00 0,03 0,19 2D03 1,24 0,01 0,02 0,03 1,98 3,27 1,68 0,69 0,56 0,10 0,03 0,04 0,00 0,96 4,95 6D04 2,94 0,02 0,07 0,16 6,09 9,27 4,10 1,49 1,19 0,28 0,02 0,07 0,00 2,53 13,36 38D05 7,22 0,05 0,23 0,33 9,37 17,20 10,05 3,62 2,93 0,63 0,05 0,17 0,00 6,26 27,25 186D23 0,28 0,00 0,01 0,00 3,16 3,44 0,07 0,03 0,02 0,01 0,00 0,00 0,00 0,04 3,51 0E00 0,29 0,00 0,01 0,00 0,46 0,76 1,22 0,32 0,29 0,00 0,03 0,02 0,00 0,88 1,98 3F45001 58,22 0,10 0,73 0,05 5,16 64,25 35,98 11,34 8,74 2,59 0,01 0,42 0,00 24,23 100,23 1 030F4500A 0,00 0,00 0,00 0,00 0,00 0,00 0,00 0,00 0,00 0,00 0,00 0,00 0,00 0,00 0,01 0G00 2,27 0,02 0,05 0,01 0,65 3,00 6,33 1,89 1,53 0,34 0,01 0,05 0,00 4,40 9,34 150H55 0,13 0,00 0,00 0,00 0,00 0,14 0,21 0,04 0,03 0,01 0,00 0,00 0,00 0,17 0,35 3I01 0,69 0,01 0,02 0,00 0,16 0,87 0,42 0,24 0,21 0,03 0,00 0,01 0,00 0,18 1,30 8I02 0,15 0,00 0,00 0,00 0,01 0,16 0,37 0,07 0,06 0,01 0,00 0,00 0,00 0,30 0,53 1J00 2,63 0,04 0,04 0,00 0,05 2,75 3,61 1,30 1,03 0,23 0,04 0,09 0,00 2,23 6,37 7K00001 0,21 0,01 0,00 0,00 0,00 0,22 6,88 0,30 0,26 0,04 0,01 0,01 -0,07 6,65 7,10 4K0000A 1,04 0,03 0,02 0,00 0,15 1,24 8,86 1,78 1,54 0,23 0,01 0,06 0,00 7,02 10,10 28L75/MNO 0,00 0,00 0,00 0,00 0,00 0,01 0,02 0,02 0,01 0,00 0,00 0,00 0,00 0,00 0,02 0OP0 0,03 0,00 0,00 0,00 0,02 0,05 0,28 0,07 0,06 0,01 0,00 0,00 -0,01 0,21 0,33 18TOTAL 78,46 0,27 1,23 0,61 27,80 108,37 83,16 23,79 18,98 4,56 0,25 1,10 -0,09 58,36 191,53 1 517Source : ConsultantCI-L : Consommation intermédiaires locales; II-S : Impôt –subventions sur les produits ; TVA : taxe sur <strong>la</strong> valeur ajoutée nonrécupérables ; DD : les droits sur importations ; P7 : les importations ; CI-T : CI-L+II-S+TVA+DD+P7, VA : Valeur ajoutée, RS :Rémunération <strong>de</strong>s sa<strong>la</strong>riées; Dont (SB : sa<strong>la</strong>ires brut + CSE : cotisations sociale effective +CSI : cotisations sociale imputée) ; ID : impôtssur <strong>la</strong> production ; SB : subvention sur <strong>la</strong> production ; EBE : excé<strong>de</strong>nt brut d’exploitation ; PROD : production aux prix <strong>de</strong> base ; EE :effectifs <strong>de</strong>s employésPROEEPage 50BALANCE ECONOMIQUE LIANT LE SECTEUR DE LA PROMOTION IMMOBILIERE A L’ECONOMIE NATIONALE | MARSULT INFO, 2009