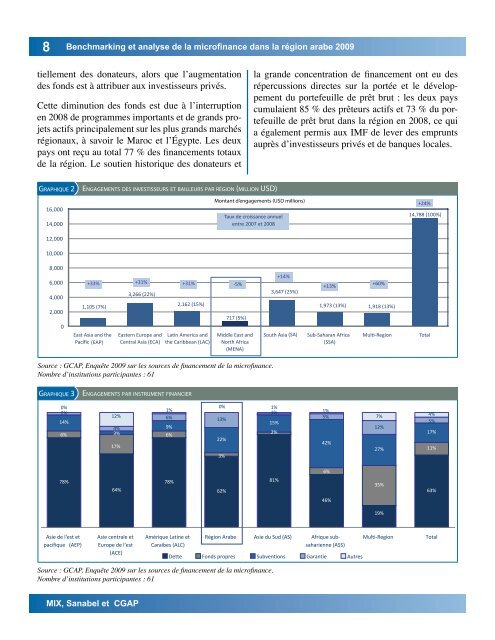
8<strong>Benchmarking</strong> <strong>et</strong> <strong>analyse</strong> <strong>de</strong> <strong>la</strong> <strong>microfinance</strong> <strong>dans</strong> <strong>la</strong> région <strong>arabe</strong> 2009tiellement <strong>de</strong>s donateurs, alors que l’augmentation<strong>de</strong>s fonds est à attribuer aux investisseurs privés.C<strong>et</strong>te diminution <strong>de</strong>s fonds est due à l’interruptionen 2008 <strong>de</strong> programmes importants <strong>et</strong> <strong>de</strong> grands proj<strong>et</strong>sactifs principalement sur les plus grands marchésrégionaux, à savoir le Maroc <strong>et</strong> l’Égypte. Les <strong>de</strong>uxpays ont reçu au total 77 % <strong>de</strong>s financements totaux<strong>de</strong> <strong>la</strong> région. Le soutien historique <strong>de</strong>s donateurs <strong>et</strong><strong>la</strong> gran<strong>de</strong> concentration <strong>de</strong> financement ont eu <strong>de</strong>srépercussions directes sur <strong>la</strong> portée <strong>et</strong> le développementdu portefeuille <strong>de</strong> prêt brut : les <strong>de</strong>ux payscumu<strong>la</strong>ient 85 % <strong>de</strong>s prêteurs actifs <strong>et</strong> 73 % du portefeuille<strong>de</strong> prêt brut <strong>dans</strong> <strong>la</strong> région en 2008, ce quia également permis aux IMF <strong>de</strong> lever <strong>de</strong>s empruntsauprès d’investisseurs privés <strong>et</strong> <strong>de</strong> banques locales.Graphique 2Engagements <strong>de</strong>s investisseurs <strong>et</strong> bailleurs par région (million USD)Source : GCAP, Enquête 2009 sur les sources <strong>de</strong> financement <strong>de</strong> <strong>la</strong> <strong>microfinance</strong>.Nombre d’institutions participantes : 61Graphique 3Engagements par instrument financier0%0% 1%1%2%1%12%6%13%14% 15%4%9%6% 3%2%6%22%17%3%1%5%42%7%12%27%4%5%17%11%6%78%64%78% 81%62%35%63%46%19%Asie <strong>de</strong> l'est <strong>et</strong>pacifique (AEP)Asie centrale <strong>et</strong>Europe <strong>de</strong> l'est(ACE)Amérique Latine <strong>et</strong>Caraibes (ALC)Région Arabe Asie du Sud (AS) Afrique subsaharienne(ASS)D<strong>et</strong>te Fonds propres Subventions Garantie AutresMulti-RegionTotalSource : GCAP, Enquête 2009 sur les sources <strong>de</strong> financement <strong>de</strong> <strong>la</strong> <strong>microfinance</strong>.Nombre d’institutions participantes : 61MIX, Sanabel <strong>et</strong> CGAP
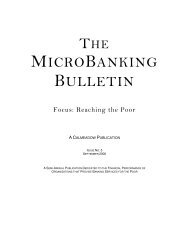
<strong>Benchmarking</strong> <strong>et</strong> <strong>analyse</strong> <strong>de</strong> <strong>la</strong> <strong>microfinance</strong> <strong>dans</strong> <strong>la</strong> région <strong>arabe</strong> 2009 9Graphique 480%70%60%50%40%30%20%10%0%Structure financière: ratio Fonds propres/actif2004 2005 2006 2007 2008Région <strong>arabe</strong>EgypteMarocJordanieSource : Microfinance Information Exchange, Inc., Benchmarks 2004-2008Structure <strong>de</strong> financement <strong>et</strong> prêteurs IMF 8Comme l’illustre <strong>la</strong> section précé<strong>de</strong>nte, <strong>la</strong> d<strong>et</strong>te jouedésormais un rôle primordial <strong>dans</strong> <strong>la</strong> croissance <strong>de</strong> <strong>la</strong><strong>microfinance</strong>, les IMF <strong>arabe</strong>s n’ayant que peu d’alternatives.Les organisations à but non lucratif quireprésentent 85 % <strong>de</strong>s IMF ne peuvent donc pas, <strong>de</strong>par leur statut, attirer <strong>de</strong>s investissements en fondspropres, même si les récentes modifications <strong>de</strong> <strong>la</strong> loien Syrie, au Yémen <strong>et</strong> en Égypte pourraient ouvrir <strong>la</strong>voie aux prises <strong>de</strong> participation <strong>dans</strong> un plus grandnombre d’IMF. De plus, les contraintes réglementairesen p<strong>la</strong>ce <strong>dans</strong> <strong>la</strong> plupart <strong>de</strong>s pays ne perm<strong>et</strong>tentpas <strong>de</strong> mobiliser <strong>de</strong>s dépôts : environ 27 % <strong>de</strong>s IMF<strong>arabe</strong>s <strong>de</strong> l’échantillon collectent l’épargne obligatoire9 <strong>et</strong> seules 7 % d’entre elles fournissent un serviced’épargne volontaire à leurs clients.Traditionnellement, les IMF <strong>arabe</strong>s finançaient majoritairementleur croissance par le biais <strong>de</strong>s subventions,ce qui n’est plus le cas aujourd’hui. Depuis8 Les d<strong>et</strong>tes en cours au niveau du détail (internationales <strong>et</strong> locales) :<strong>la</strong> base <strong>de</strong> données <strong>de</strong>s structures <strong>de</strong> financement du MIX présente sesconclusions sur le financement <strong>de</strong> <strong>la</strong> <strong>microfinance</strong> <strong>de</strong> détail <strong>de</strong>s bailleurs<strong>de</strong> fonds internationaux <strong>et</strong> locaux. Ces données sont indiquéespar les IMF à <strong>la</strong> publication <strong>de</strong> leur bi<strong>la</strong>n. Les montants sont à payer.9 Forme <strong>de</strong> garantie <strong>de</strong> prêt utilisée par certaines IMF selon <strong>la</strong>quelleun certain pourcentage du prêt distribué est déduit <strong>de</strong> chaque emprunteur<strong>et</strong> déposé sous forme d’épargne au sein <strong>de</strong> l’institution jusqu’à ceque le prêt soit entièrement remboursé.l’an 2000, l’accès aux emprunts souscrits auprès <strong>de</strong>banques locales s’est considérablement développé<strong>dans</strong> <strong>la</strong> région <strong>arabe</strong>, ramenant le ratio capital/actif<strong>de</strong> 75 % du financement en 2003 à 47 % en 2008,avec toutefois <strong>de</strong>s disparités notables <strong>dans</strong> <strong>la</strong> région.C<strong>et</strong>te année <strong>et</strong> pour <strong>la</strong> première fois, les IMF <strong>arabe</strong>sont financé leurs opérations majoritairement par <strong>la</strong>d<strong>et</strong>te (53 %).Les banques locales représentent l’essentiel <strong>de</strong>s prêteurs<strong>de</strong>s IMF. Rassurées par <strong>la</strong> maturité croissanted’un secteur en plein développement, les garanties<strong>de</strong>s donateurs <strong>et</strong> <strong>de</strong>s investisseurs internationauxainsi que par le développement progressif <strong>de</strong> cadresjuridiques favorables, les institutions financièresfournissent 79 % <strong>de</strong>s fonds levés par les IMF, tandisque les prêts issus <strong>de</strong>s IFD <strong>et</strong> <strong>de</strong>s États représentent15 % (cf. graphique 5). Les financements internationaux<strong>de</strong>stinés à <strong>la</strong> <strong>microfinance</strong>, bien que présentssur quelques marchés, ne représentaient que 4 % dufinancement total par <strong>la</strong> d<strong>et</strong>te à <strong>la</strong> fin <strong>de</strong> l’année 2008.Graphique 579%Parts d’investissement par groupe <strong>de</strong> prêteurs4% 2%15%IFD/GouvernementInstitutionfinancièreFondsAutresSource : Microfinance Information Exchange, Inc., Benchmarks 2008Définitions <strong>de</strong>s types <strong>de</strong> prêteur :IFD/État : bailleurs <strong>de</strong> fonds du développement tels que les institutions<strong>de</strong> financement du développement, les pouvoirs publics, lesbanques centrales, les organismes <strong>de</strong> développement bi<strong>la</strong>téraux <strong>et</strong>multi<strong>la</strong>téraux <strong>et</strong> les programmes axés sur le développement.Institutions financières : banques commerciales, banques publiques<strong>et</strong> coopératives.Fonds : tout type d’instrument <strong>de</strong> p<strong>la</strong>cement <strong>de</strong> <strong>microfinance</strong> (IPM) <strong>et</strong>fonds <strong>de</strong>s ONG/fondations.Autres : ONG, particuliers <strong>et</strong> entreprises privées.Mai 2010