stratégie de développement de la filière café au cameroun
stratégie de développement de la filière café au cameroun
stratégie de développement de la filière café au cameroun

Create successful ePaper yourself
Turn your PDF publications into a flip-book with our unique Google optimized e-Paper software.
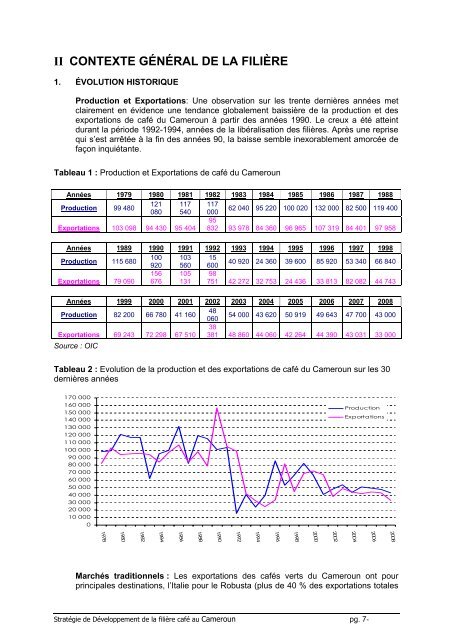
II CONTEXTE GÉNÉRAL DE LA FILIÈRE1. ÉVOLUTION HISTORIQUEProduction et Exportations: Une observation sur les trente <strong>de</strong>rnières années metc<strong>la</strong>irement en évi<strong>de</strong>nce une tendance globalement baissière <strong>de</strong> <strong>la</strong> production et <strong>de</strong>sexportations <strong>de</strong> <strong>café</strong> du Cameroun à partir <strong>de</strong>s années 1990. Le creux a été atteintdurant <strong>la</strong> pério<strong>de</strong> 1992-1994, années <strong>de</strong> <strong>la</strong> libéralisation <strong>de</strong>s <strong>filière</strong>s. Après une reprisequi s’est arrêtée à <strong>la</strong> fin <strong>de</strong>s années 90, <strong>la</strong> baisse semble inexorablement amorcée <strong>de</strong>façon inquiétante.Table<strong>au</strong> 1 : Production et Exportations <strong>de</strong> <strong>café</strong> du CamerounAnnées 1979 1980 1981 1982 1983 1984 1985 1986 1987 1988Production 99 480121 117 117080 540 00062 040 95 220 100 020 132 000 82 500 119 40095Exportations 103 098 94 430 95 404 832 93 978 84 360 96 965 107 319 84 401 97 958Années 1989 1990 1991 1992 1993 1994 1995 1996 1997 1998Production 115 680100 103 15920 560 60040 920 24 360 39 600 85 920 53 340 66 840Exportations 79 09015667610513198751 42 272 32 753 24 436 33 813 82 082 44 743Années 1999 2000 2001 2002 2003 2004 2005 2006 2007 2008Production 82 200 66 780 41 1604806054 000 43 620 50 919 49 643 47 700 43 000Exportations 69 243 72 298 67 51038381 48 860 44 060 42 264 44 390 43 031 33 000Source : OICTable<strong>au</strong> 2 : Evolution <strong>de</strong> <strong>la</strong> production et <strong>de</strong>s exportations <strong>de</strong> <strong>café</strong> du Cameroun sur les 30<strong>de</strong>rnières années170 000160 000150 000140 000130 000120 000110 000100 00090 00080 00070 00060 00050 00040 00030 00020 00010 0000ProductionExportations1982198419881990199419961998200019801978198619922008200620042002Marchés traditionnels : Les exportations <strong>de</strong>s <strong>café</strong>s verts du Cameroun ont pourprincipales <strong>de</strong>stinations, l’Italie pour le Robusta (plus <strong>de</strong> 40 % <strong>de</strong>s exportations totalesStratégie <strong>de</strong> Développement <strong>de</strong> <strong>la</strong> <strong>filière</strong> <strong>café</strong> <strong>au</strong> Cameroun pg. 7-