pdf 1 608 ko - Institut national de la statistique malgache (INSTAT)
pdf 1 608 ko - Institut national de la statistique malgache (INSTAT)
pdf 1 608 ko - Institut national de la statistique malgache (INSTAT)

Create successful ePaper yourself
Turn your PDF publications into a flip-book with our unique Google optimized e-Paper software.
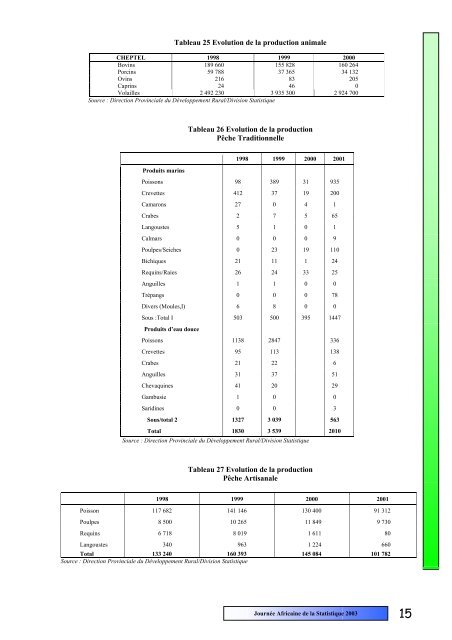
Tableau 25 Evolution <strong>de</strong> <strong>la</strong> production animaleCHEPTEL 1998 1999 2000Bovins 189 660 155 828 160 264Porcins 59 788 37 365 34 132Ovins 216 83 205Caprins 24 46 0Vo<strong>la</strong>illes 2 492 230 3 935 300 2 924 700Source : Direction Provinciale du Développement Rural/Division StatistiqueTableau 26 Evolution <strong>de</strong> <strong>la</strong> productionPêche Traditionnelle1998 1999 2000 2001Produits marinsPoissons 98 389 31 935Crevettes 412 37 19 200Camarons 27 0 4 1Crabes 2 7 5 65Langoustes 5 1 0 1Calmars 0 0 0 9Poulpes/Seiches 0 23 19 110Bichiques 21 11 1 24Requins/Raies 26 24 33 25Anguilles 1 1 0 0Trépangs 0 0 0 78Divers (Moules,I) 6 8 0 0Sous :Total I 503 500 395 1447Produits d’eau doucePoissons 1138 2847 336Crevettes 95 113 138Crabes 21 22 6Anguilles 31 37 51Chevaquines 41 20 29Gambusie 1 0 0Saridines 0 0 3Sous/total 2 1327 3 039 563Total 1830 3 539 2010Source : Direction Provinciale du Développement Rural/Division StatistiqueTableau 27 Evolution <strong>de</strong> <strong>la</strong> productionPêche Artisanale1998 1999 2000 2001Poisson 117 682 141 146 130 400 91 312Poulpes 8 500 10 265 11 849 9 730Requins 6 718 8 019 1 611 80Langoustes 340 963 1 224 660Total 133 240 160 393 145 084 101 782Source : Direction Provinciale du Développement Rural/Division StatistiqueJournée Africaine <strong>de</strong> <strong>la</strong> Statistique 2003 15