pdf 1 608 ko - Institut national de la statistique malgache (INSTAT)
pdf 1 608 ko - Institut national de la statistique malgache (INSTAT)
pdf 1 608 ko - Institut national de la statistique malgache (INSTAT)

You also want an ePaper? Increase the reach of your titles
YUMPU automatically turns print PDFs into web optimized ePapers that Google loves.
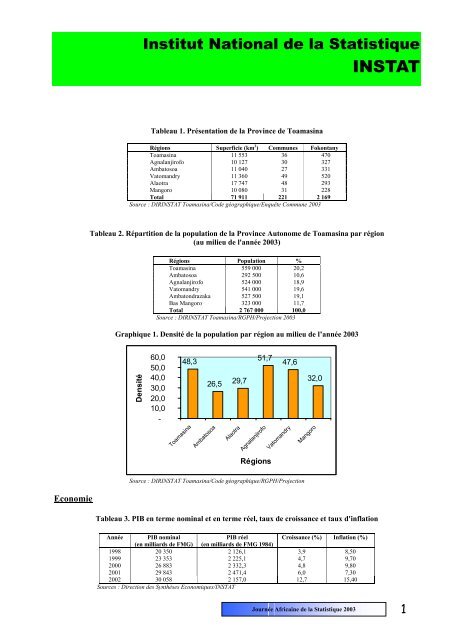
<strong>Institut</strong> National <strong>de</strong> <strong>la</strong> Statistique<strong>INSTAT</strong>Tableau 1. Présentation <strong>de</strong> <strong>la</strong> Province <strong>de</strong> ToamasinaRégions Superficie (km 2 ) Communes Fo<strong>ko</strong>ntanyToamasina 11 553 36 470Agna<strong>la</strong>njirofo 10 127 30 327Ambatosoa 11 040 27 331Vatomandry 11 360 49 520A<strong>la</strong>otra 17 747 48 293Mangoro 10 080 31 228Total 71 911 221 2 169Source : DIR<strong>INSTAT</strong> Toamasina/Co<strong>de</strong> géographique/Enquête Commune 2003Tableau 2. Répartition <strong>de</strong> <strong>la</strong> popu<strong>la</strong>tion <strong>de</strong> <strong>la</strong> Province Autonome <strong>de</strong> Toamasina par région(au milieu <strong>de</strong> l'année 2003)Régions Popu<strong>la</strong>tion %Toamasina 559 000 20,2Ambatosoa 292 500 10,6Agna<strong>la</strong>njirofo 524 000 18,9Vatomandry 541 000 19,6Ambatondrazaka 527 500 19,1Bas Mangoro 323 000 11,7Total 2 767 000 100,0Source : DIR<strong>INSTAT</strong> Toamasina/RGPH/Projection 2003Graphique 1. Densité <strong>de</strong> <strong>la</strong> popu<strong>la</strong>tion par région au milieu <strong>de</strong> l’année 2003Densité60,050,040,030,020,010,0-48,326,5ToamasinaAmbatosoa51,747,629,732,0A<strong>la</strong>otraAgna<strong>la</strong>njirofoVatomandryMangoroRégionsSource : DIR<strong>INSTAT</strong> Toamasina/Co<strong>de</strong> géographique/RGPH/ProjectionEconomieTableau 3. PIB en terme nominal et en terme réel, taux <strong>de</strong> croissance et taux d'inf<strong>la</strong>tionAnnée PIB nominalPIB réelCroissance (%) Inf<strong>la</strong>tion (%)(en milliards <strong>de</strong> FMG) (en milliards <strong>de</strong> FMG 1984)1998 20 350 2 126,1 3,9 8,501999 23 353 2 225,1 4,7 9,702000 26 883 2 332,3 4,8 9,802001 29 843 2 471,4 6,0 7,302002 30 058 2 157,0 12,7 15,40Sources : Direction <strong>de</strong>s Synthèses Economiques/<strong>INSTAT</strong>Journée Africaine <strong>de</strong> <strong>la</strong> Statistique 2003 1