pdf 1 608 ko - Institut national de la statistique malgache (INSTAT)
pdf 1 608 ko - Institut national de la statistique malgache (INSTAT)
pdf 1 608 ko - Institut national de la statistique malgache (INSTAT)

Create successful ePaper yourself
Turn your PDF publications into a flip-book with our unique Google optimized e-Paper software.
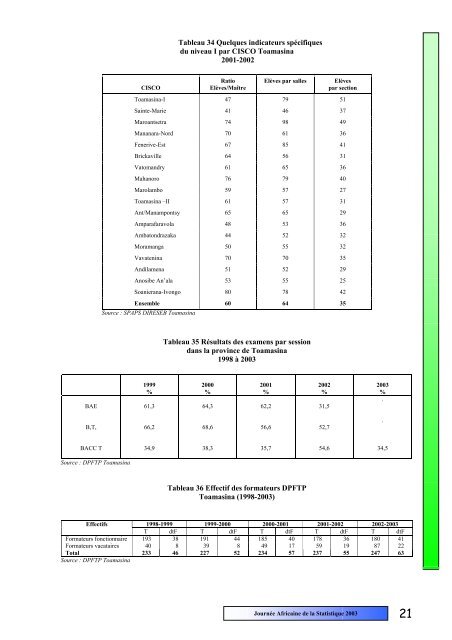
Tableau 34 Quelques indicateurs spécifiquesdu niveau I par CISCO Toamasina2001-2002CISCORatioElèves/MaîtreElèves par sallesElèvespar sectionToamasina-I 47 79 51Sainte-Marie 41 46 37Maroantsetra 74 98 49Mananara-Nord 70 61 36Fenerive-Est 67 85 41Brickaville 64 56 31Vatomandry 61 65 36Mahanoro 76 79 40Maro<strong>la</strong>mbo 59 57 27Toamasina –II 61 57 31Ant/Manampontsy 65 65 29Amparafaravo<strong>la</strong> 48 53 36Ambatondrazaka 44 52 32Moramanga 50 55 32Vavatenina 70 70 35Andi<strong>la</strong>mena 51 52 29Anosibe An’a<strong>la</strong> 53 55 25Soanierana-Ivongo 80 78 42Ensemble 60 64 35Source : SPAPS DIRESEB ToamasinaTableau 35 Résultats <strong>de</strong>s examens par sessiondans <strong>la</strong> province <strong>de</strong> Toamasina1998 à 20031999%2000%BAE 61,3 64,3 62,2 31,5B,T, 66,2 68,6 56,6 52,72001%2002%2003%..BACC T 34,9 38,3 35,7 54,6 34,5Source : DPFTP ToamasinaTableau 36 Effectif <strong>de</strong>s formateurs DPFTPToamasina (1998-2003)Effectifs1998-1999 1999-2000 2000-2001 2001-2002 2002-2003T dtF T dtF T dtF T dtF T dtFFormateurs fonctionnaire 193 38 191 44 185 40 178 36 180 41Formateurs vacataires 40 8 39 8 49 17 59 19 87 22Total 233 46 227 52 234 57 237 55 247 63Source : DPFTP ToamasinaJournée Africaine <strong>de</strong> <strong>la</strong> Statistique 2003 21