Slides - Automatica - Università degli Studi di Padova
Slides - Automatica - Università degli Studi di Padova
Slides - Automatica - Università degli Studi di Padova

You also want an ePaper? Increase the reach of your titles
YUMPU automatically turns print PDFs into web optimized ePapers that Google loves.
Sistemi e Modelli<br />
Introduzione al corso, a.a. 2011-2012<br />
Prof. Luca Schenato, Prof. Mauro Bisiacco<br />
Dipartimento <strong>di</strong> Ingegneria dell’Informazione<br />
<strong>Università</strong> <strong>degli</strong> <strong>Stu<strong>di</strong></strong> <strong>di</strong> <strong>Padova</strong><br />
5 Ottobre 2011
Informazioni Utili<br />
Corso con 2 canali:<br />
Canale 1 (Matricole 0-4): Prof.ssa Gianna Toffolo e Prof. Clau<strong>di</strong>o<br />
Cobelli<br />
Canale 2 (Matricole 5-9): Prof. Luca Schenato e Prof. Mauro<br />
Bisiacco<br />
Svolgimento lezioni: 45min lezione +10min pausa+ 45min lezione<br />
Orario <strong>di</strong> ricevimento: appuntamento concordato tramite e-mail<br />
(Uffici: DEI-A, 3 o piano, lato destro uscendo dall’ascensore, tel.<br />
049-827-7925 (Prof. Schenato), 049-827-7608 (Prof. Bisiacco)<br />
Sito web:<br />
http://automatica.dei.unipd.it/people/schenato/teaching/sistemi-e-modelli.html<br />
Comunicazioni: tramite forum del corso su<br />
https://moodle.dei.unipd.it/. È necessario iscriversi.<br />
Modalità esame: prova scritta in comune per entrambi i canali.<br />
Possibile partecipare a tutti gli appelli. È possibile registrare il voto<br />
in altri appelli. Prima parte dell’esame a risposta multipla con voto<br />
minimo (da confermare).
Testi<br />
Testi <strong>di</strong> riferimento:<br />
Mauro Bisiacco, Simonetta Braghetto, Teoria dei Sistemi Dinamici,<br />
Progetto Leonardo, Esculapio, Bologna, 2010<br />
Clau<strong>di</strong>o Cobelli, C. Carson Introduction to modelling in physiology<br />
and me<strong>di</strong>cine, Academic Press, London, 2008. (versione italiana<br />
<strong>di</strong>sponibile a breve)<br />
Testi per consultazione:<br />
Karl Astrom, Richard Murray Feedback Systems: An Introduction for<br />
Scientists and Engineers, Princeton University Press, 2008.<br />
Disponibile online: http://www.cds.caltech.edu/∼murray/amwiki<br />
L. Benvenuti, A. De Santis, L. Farina, Sistemi <strong>di</strong>namici, Mc Graw<br />
Hill, 2009<br />
E. Fornasini, G. Marchesini. Teoria dei sistemi, Libreria Progetto,<br />
<strong>Padova</strong><br />
Giorgio Picci, Meto<strong>di</strong> Statistici per l’Identificazione <strong>di</strong> Sistemi<br />
Lineari, Dispense, 2011. Disponibile online:<br />
http://www.dei.unipd.it/∼picci/IdentAnalisiDati.html
Prerequisiti<br />
Fisica Generale 1 e Fisica Generale 2:<br />
Equazioni che regolano la <strong>di</strong>namica <strong>di</strong> sistemi meccanici e elettrici<br />
Segnali e Sistemi:<br />
Funzioni <strong>di</strong> trasferimento a tempo continuo e a tempo <strong>di</strong>screto<br />
Algebra Lineare e Geometria:<br />
Autovalori, autovettori<br />
Matrici definite positive e loro <strong>di</strong>agonalizzazione<br />
Analisi dei Dati:<br />
Variabili aleatorie gaussiane vettoriali<br />
Calcolo <strong>di</strong> me<strong>di</strong>a e varianza <strong>di</strong> variabili aleatorie gaussiane<br />
con<strong>di</strong>zionate<br />
Regressione lineare
Sistemi e ...<br />
“Il tutto è maggiore della somma delle parti" (Aristotele)<br />
Sistema:<br />
Un sistema può essere definito come l’unità fisica e funzionale, costituita<br />
da più parti (tessuti, organi od elementi 2.3. MODELING ecc.) METHODOLOGY interagenti (od in relazione 45<br />
funzionale) tra loro (e con altri sistemi), formando un tutt’uno in cui,<br />
Generator<br />
symbol<br />
Bus Bus<br />
Transformer<br />
co<strong>di</strong>ng symbol<br />
ogni parte, dà un contributo per una finalità comune symbol od un target<br />
1<br />
2<br />
Tie line<br />
connecting with<br />
identificativo <strong>di</strong> quel sistema.<br />
neighbor system<br />
–150<br />
NRI NRI-P<br />
0° glnAp2 0° glnG<br />
3<br />
4<br />
(Wikipe<strong>di</strong>a - Line http://it.wikipe<strong>di</strong>a.org)<br />
symbol<br />
2.3. MODELING METHODOLOGY 45<br />
1<br />
3<br />
5<br />
Bus<br />
co<strong>di</strong>ng<br />
Bus<br />
symbol<br />
4<br />
(a) Power electronics<br />
L<br />
Generator<br />
symbol<br />
Transformer<br />
symbol<br />
2<br />
Tie line<br />
connecting with<br />
neighbor system<br />
6<br />
Line symbol<br />
Load symbol<br />
LC<br />
D<br />
–150<br />
NRI NRI-P<br />
0° glnAp2 0° glnG<br />
glnKp lacl<br />
(b) Cell biology<br />
Lacl<br />
(ready to<br />
send) t1 (buffer<br />
in use)<br />
p1 p3 (output) p2 (input) (ready to<br />
receive)<br />
LC<br />
5<br />
(a) Power electronics<br />
V<br />
L<br />
AC<br />
AT<br />
(c) Process control<br />
6<br />
Load symbol<br />
LC<br />
AC<br />
AT<br />
D<br />
B<br />
glnKp lacl<br />
(b) Cell biology<br />
Lacl<br />
(ready to<br />
send) t1 (buffer<br />
in use)<br />
p1 p3 (output) p2 (input) (ready to<br />
receive)<br />
t5 p4 p5 t6 (produce)<br />
(waiting<br />
for ack.)<br />
(ack.<br />
received)<br />
p7 (consume)<br />
(received)<br />
(send<br />
t3 ack.)<br />
p8 p6 t4 (receive<br />
ack.)<br />
(buffer<br />
in use)<br />
(ack. sent)<br />
Process A Process B<br />
(d) Networking<br />
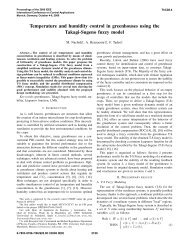
Figure 2.11: Schematic <strong>di</strong>agrams for <strong>di</strong>fferent <strong>di</strong>sciplines. Each <strong>di</strong>agram is used to illustrate<br />
the dynamics of a feedback system: (a) electrical schematics for a power system [Kun93], (b)<br />
a biological circuit <strong>di</strong>agram for a synthetic clock circuit [ASMN03], (c) a process <strong>di</strong>agram for<br />
a <strong>di</strong>stillation column [SEM04] and (d) a Petri net description of a communication protocol.
... Modelli<br />
Modello:<br />
Un modello è una rappresentazione <strong>di</strong> un oggetto o <strong>di</strong> un fenomeno, che<br />
corrisponde alla cosa modellata per il fatto <strong>di</strong> riprodurne alcune<br />
caratteristiche o comportamenti fondamentali in modo tale che questi<br />
aspetti possano essere mostrati, stu<strong>di</strong>ati, conosciuti laddove l’oggetto<br />
modellato non sia <strong>di</strong>rettamente accessibile.<br />
(Wikipe<strong>di</strong>a - http://it.wikipe<strong>di</strong>a.org)<br />
Modelli fisici: in scala ridotta come navi, <strong>di</strong>ghe, aeroplani<br />
Modelli matematici: relazioni matematiche che descrivono<br />
quantitativamente il comportamento del sistema<br />
Modelli verbali: descrizione qualitative tramite linguaggio <strong>di</strong> un<br />
fenomento<br />
Modelli grafici: schemi, relazioni tra le parti, flusso <strong>di</strong> informazione
Modelli Matematici<br />
Vantaggi:<br />
Descrizione sintetica <strong>di</strong> un fenomeno<br />
Descrizione non ambigua <strong>di</strong> un fenomeno<br />
Riproducibilità: possibilità <strong>di</strong> riprodurre il<br />
fenomeno in maniera ripetibile e su PC<br />
Analisi quantitativa: possibilità <strong>di</strong><br />
analizzare le proprietà <strong>di</strong> un modello<br />
Accessibilità: possibilità <strong>di</strong> mo<strong>di</strong>ficare e<br />
testare il modello<br />
Universali: utilizzati in tutte le aree della<br />
scienza e dell’ingegneria<br />
Problematiche:<br />
Quando un modello matematico è un<br />
buon modello ?<br />
Come costruire un modello matematico?<br />
In pratica, tutti i modelli sono sbagliati, ma alcuni sono utili<br />
(George Box - statistico)
Sistemi e modelli <strong>di</strong>namici<br />
Sistemi <strong>di</strong>namici<br />
Sono sistemi che evolvono nel tempo, caratterizzati da un insieme <strong>di</strong><br />
segnali <strong>di</strong> ingresso e <strong>di</strong> uscita. In particolare l’uscita(effetto) all’istante t<br />
<strong>di</strong> un sistema <strong>di</strong>namico <strong>di</strong>pende dalla storia passata <strong>degli</strong> ingressi(cause)<br />
del sistema. Sono tipicamente modellizzati tramite equazioni <strong>di</strong>fferenziali<br />
e variabili <strong>di</strong> stato.<br />
Modello matematico per sistemi <strong>di</strong>namici (tempo continuo)<br />
dx<br />
(t)<br />
dt<br />
= f (x(t), u(t), t)<br />
y = h(x(t), u(t), t)<br />
x, u, y sono vettori<br />
u - controlli, <strong>di</strong>sturbi, rumore<br />
x - non accessibile <strong>di</strong>rettamente<br />
f , h - funzioni statiche (anche non lineari)
Come si costruisce un modello matematico?<br />
Scatola trasparente: si usano leggi<br />
costruttive del fenomeno<br />
(fisiche,biologiche,chimiche,etc) per<br />
derivare il modello matematico<br />
Scatola grigia: si usano leggi<br />
costruttive del fenomeno e misure<br />
sperimentali {u(t), y(t)} per stimare<br />
alcuni parametri non noti (massa,<br />
costante <strong>di</strong> degradazione, etc..)<br />
Scatola nera (Modelli <strong>di</strong> dati): si usano<br />
solamente delle misure sperimentali <strong>di</strong><br />
{u(t), y(t)}
Approccio White-Box (1/2)<br />
Scatola trasparente<br />
Il sistema é decomposto in componenti elementari <strong>di</strong> cui si conosce il modello<br />
matematico tramite i principi fondamentali delle scienze (fisica, biologia,<br />
chimica, ecc..) ed il valore esatto dei parametri coinvolti (massa, costanti <strong>di</strong><br />
deca<strong>di</strong>mento, coefficienti <strong>di</strong> attrito, ecc..).<br />
m1¨x1 = −k1(x1 − x2) − d1( ˙x1 − ˙x2)<br />
m2¨x2 = k1(x1 − x2) + d1( ˙x1 − ˙x2) − k2(x1 − u)<br />
y = x1<br />
Variabili: x1 altezza auto, x2 altezza sospensione,<br />
u altezza profilo stradale<br />
Parametri: k1 costante elasica sospensione, k2 costante<br />
elastica pneumatico, d1 coefficiente attrito sospensione
Approccio White-Box (2/2)<br />
Vantaggi:<br />
Non servono dati sperimentali<br />
Facilità nel mo<strong>di</strong>ficare il modello (nell’esempio: aggiungere un<br />
termine <strong>di</strong> attrito per il pneumatico)<br />
Svantaggi:<br />
Spesso si devono fare ipotesi semplificative (nell’ esempio:<br />
considerare un modello lineare dell’attrito)<br />
Poco accurato se i parametri del modello non sono noti (nell’esempio:<br />
pressione aria pneumatico che influenza costante elastica k2)<br />
Sistemi con molte componenti portano a modelli complessi con<br />
molte equazioni anche se il comportamento globale è “semplice"<br />
A volte le leggi costruttive elementari non sono note (molti esempi in<br />
economia, biologia, ecologia, ecc...)
Approccio Gray-Box (1/2)<br />
Scatola grigia<br />
Si conoscono (almeno parzialmente) principi fondamentali delle scienze che<br />
regolano il sistema ma il valore dei parametri coinvolti non è noto.<br />
Equazioni del modello:<br />
m1¨x1 = −k1(x1 − x2) − d1( ˙x1 − ˙x2)<br />
m2¨x2 = k1(x1 − x2) + d1( ˙x1 − ˙x2) − k2(x1 − u)<br />
y = x1<br />
Identificatione: Si utilizzano i dati <strong>di</strong><br />
ingresso/uscita {u(t), y(t)} T t=0 e le equazioni del<br />
modello per ricavare il valore esatto dei parametri<br />
k1, k2, d1
Approccio Gray-Box (2/2)<br />
Vantaggi:<br />
Modello più accurato<br />
Permette <strong>di</strong> ricavare il valore <strong>di</strong> parametri non misurabili <strong>di</strong>rettamente<br />
Interpretazione chiara delle varie variabili in gioco<br />
Svantaggi:<br />
Necessità <strong>di</strong> raccogliere i dati<br />
Spesso il calcolo dei parametri richiede una complessa ottimizzazione<br />
non-lineare<br />
Efficace in genere solo se numero parametri è piccolo<br />
Problemi <strong>di</strong> identificabilità dei parametri (esempio se k1 = Lκ e<br />
d1 = Lb, L-lunghezza sospensione, κ-costante elastica per unità <strong>di</strong><br />
lunghezza, b-coefficiente d’attrito per unità <strong>di</strong> lunghezza, si vuole<br />
trovare valori <strong>di</strong> κ, L, b).
Approccio Black-Box (1/2)<br />
Scatola nera (Modelli <strong>di</strong> dati)<br />
Non si conoscono i principi fondamentali che regolano il fenomeno, oppure sono<br />
troppo complessi e si crea un modello matematico solamente a partire dai dati<br />
sperimentali.<br />
Dati <strong>di</strong>sponibili: Il profilo del terreno {u(t)} (o<br />
sua descrizione statistica) e l‘altezza del veicolo<br />
{y(t)} campionati a t = kT , dove T è il tempo <strong>di</strong><br />
campionamento, quin<strong>di</strong> i dati sono<br />
D = {(u1, y1), (u2, y2), . . . , (uN, yN)}.<br />
Identificatione: Si utilizzano solo i dati <strong>di</strong><br />
ingresso/uscita D per ricavare un modello<br />
matematico (tipicamente lineare)
Approccio Black-Box (2/2)<br />
Vantaggi:<br />
Modello che descrive solo i fenomeni più rilevanti<br />
Buone capacità pre<strong>di</strong>ttive<br />
Universale in quanto non richiede conoscenza sulla natura dei dati<br />
Svantaggi:<br />
Necessità <strong>di</strong> raccogliere i dati<br />
Poco efficace se il modello originale è fortemente non-lineare<br />
Variabili in gioco non hanno significato fisico (<strong>di</strong>fferentemente da<br />
gray/white-box)<br />
Molto variabile se dati <strong>di</strong>sponibili sono pochi e/o rumorosi
Obiettivi del corso<br />
16 CHAPTER 1. INTRODUCTION<br />
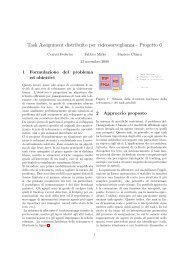
Figure 1.12: The wiring <strong>di</strong>agram of the growth-signaling circuitry of the mammalian<br />
cell [HW00]. The major pathways that are thought to play a role in cancer are in<strong>di</strong>cated<br />
in the <strong>di</strong>agram. Lines represent interactions between genes and proteins in the cell. Lines<br />
en<strong>di</strong>ng in arrowheads in<strong>di</strong>cate activation of the given gene or pathway; lines en<strong>di</strong>ng in a<br />
T-shaped head in<strong>di</strong>cate repression. (Used with permission of Elsevier Ltd. and the authors.)<br />
nity is the science of reverse (and eventually forward) engineering of biological<br />
control networks such as the one shown in Figure 1.12. There are a wide variety<br />
of biological phenomena that provide a rich source of examples of control, inclu<strong>di</strong>ng<br />
gene regulation and signal transduction; hormonal, immunological and car<strong>di</strong>ovascular<br />
feedback mechanisms; muscular control and locomotion; active sensing,<br />
vision and proprioception; attention and consciousness; and population dynamics<br />
and epidemics. Each of these (and many more) provide opportunities to figure out<br />
what works, how it works, and what we can do to affect it.<br />
One interesting feature of biological systems is the frequent use of positive feedback<br />
to shape the dynamics of the system. Positive feedback can be used to create<br />
switchlike behavior through autoregulation of a gene, and to create oscillations such<br />
as those present in the cell cycle, central pattern generators or circa<strong>di</strong>an rhythm.<br />
Ecosystems. In contrast to in<strong>di</strong>vidual cells and organisms, emergent properties<br />
of aggregations and ecosystems inherently reflect selection mechanisms that act on<br />
multiple levels, and primarily on scales well below that of the system as a whole.<br />
Because ecosystems are complex, multiscale dynamical systems, they provide a<br />
broad range of new challenges for the modeling and analysis of feedback systems.<br />
Recent experience in applying tools from control and dynamical systems to bacterial<br />
networks suggests that much of the complexity of these networks is due to the<br />
presence of multiple layers of feedback loops that provide robust functionality<br />
Modelizzazione <strong>di</strong> sistemi <strong>di</strong>namici tramite modelli matematici<br />
(Identificazione white-box)<br />
Analisi qualitativa e quantitativa <strong>di</strong> sistemi <strong>di</strong>namici regolati da<br />
equazioni <strong>di</strong>fferenziali<br />
Identificazione gray-box dei parametri incogniti <strong>di</strong> un sistema<br />
<strong>di</strong>namico a partire da dati fisici (misure) e stima dei segnali <strong>di</strong><br />
ingresso tramite deconvoluzione.
Modellizzazione<br />
16 CHAPTER 1. INTRODUCTION<br />
Figure 1.12: The wiring <strong>di</strong>agram of the growth-signaling circuitry of the mammalian<br />
cell [HW00]. The major pathways that are thought to play a role in cancer are in<strong>di</strong>cated<br />
in the <strong>di</strong>agram. Lines represent interactions between genes and proteins in the cell. Lines<br />
en<strong>di</strong>ng in arrowheads in<strong>di</strong>cate activation of the given gene or pathway; lines en<strong>di</strong>ng in a<br />
T-shaped head in<strong>di</strong>cate repression. (Used with permission of Elsevier Ltd. and the authors.)<br />
nity is the science of reverse (and eventually forward) engineering of biological<br />
control networks such as the one shown in Figure 1.12. There are a wide variety<br />
of biological phenomena that provide a rich source of examples of control, inclu<strong>di</strong>ng<br />
gene regulation and signal transduction; hormonal, immunological and car<strong>di</strong>ovascular<br />
feedback mechanisms; muscular control and locomotion; active sensing,<br />
vision and proprioception; attention and consciousness; and population dynamics<br />
and epidemics. Each of these (and many more) provide opportunities to figure out<br />
what works, how it works, and what we can do to affect it.<br />
One interesting feature of biological systems is the frequent use of positive feedback<br />
to shape the dynamics of the system. Positive feedback can be used to create<br />
switchlike behavior through autoregulation of a gene, and to create oscillations such<br />
as those present in the cell cycle, central pattern generators or circa<strong>di</strong>an rhythm.<br />
Ecosystems. In contrast to in<strong>di</strong>vidual cells and organisms, emergent properties<br />
of aggregations and ecosystems inherently reflect selection mechanisms that act on<br />
multiple levels, and primarily on scales well below that of the system as a whole.<br />
Because ecosystems are complex, multiscale dynamical systems, they provide a<br />
broad range of new challenges for the modeling and analysis of feedback systems.<br />
Recent experience in applying tools from control and dynamical systems to bacterial<br />
networks suggests that much of the complexity of these networks is due to the<br />
presence of multiple layers of feedback loops that provide robust functionality<br />
Esempi <strong>di</strong> sistemi <strong>di</strong>namici da Ingegneria Informatica, Ingegneria<br />
delle Telecomunicazioni, Bioingegneria, Ingegneria Elettronica,<br />
Ingegneria dell’Automazione<br />
Definizioni <strong>di</strong> classi <strong>di</strong> modelli matematici per sistemi <strong>di</strong>namici
ne regulation and signal transduction; hormonal, immunological and car<strong>di</strong>olar<br />
feedback mechanisms; muscular control and locomotion; active sensing,<br />
and proprioception; attention and consciousness; and population dynamics<br />
idemics. Each of these (and many more) provide opportunities to figure out<br />
orks, how it works, and what we can do to affect it.<br />
e interesting feature of biological systems is the frequent use of positive feedo<br />
shape the dynamics of the system. Positive feedback can be used to create<br />
like behavior through autoregulation of a gene, and to create oscillations such<br />
se present in the cell cycle, central pattern generators or circa<strong>di</strong>an rhythm.<br />
osystems. In contrast to in<strong>di</strong>vidual cells and organisms, emergent properties<br />
regations and ecosystems inherently reflect selection mechanisms that act on<br />
le levels, and primarily on scales well below that of the system as a whole.<br />
se ecosystems are complex, multiscale dynamical systems, they provide a<br />
range of new challenges for the modeling and analysis of feedback systems.<br />
t experience in applying tools from control and dynamical systems to bacterial<br />
rks suggests that much of the complexity of these networks is due to the<br />
ce of multiple layers of feedback loops that provide robust functionality<br />
Analisi (1/4): Sistemi Lineari Autonomi a tempo continuo<br />
Esponenziale <strong>di</strong> matrici<br />
Forma <strong>di</strong> Jordan<br />
Analisi modale<br />
Autovettori<br />
Autovettori generalizzati
Analisi (2/4): Teoria della Stabilità<br />
Punti <strong>di</strong> equilibrio<br />
Funzioni <strong>di</strong> Lyapunov<br />
Linearizzazione<br />
Diagramma delle fasi<br />
100 CHAPTER 4. DYNAMIC BEHAVIOR<br />
m<br />
l<br />
θ<br />
x2<br />
0<br />
!2<br />
4.2. QUALITATIVE ANALYSIS u<br />
−2π −π 101 0 π 2π<br />
x1<br />
1.5<br />
(a)<br />
(b) 2<br />
(c)<br />
x x<br />
1 2<br />
1<br />
Figure 4.4: Equilibrium points for 1 an inverted pendulum. An inverted pendulum is a model<br />
0.5<br />
x for a class of balance systems in which we wish to keep a system upright, such as a rocket (a).<br />
2<br />
0 Using a simplified model of an inverted 0 pendulum (b), we can develop a phase portrait that<br />
!0.5 shows the dynamics of the system (c). The system has multiple equilibrium points, marked<br />
!1 by the solid dots along the x2 = !10<br />
line.<br />
x 1 , x 2<br />
!1.5<br />
!2<br />
!1 0 1<br />
0 10 20 30<br />
x<br />
this can be inferred 1 from the lengths of the Time arrows t in the vector field plot).<br />
(a)<br />
(b)<br />
Figure Equilibrium 4.5: Phase portraitPoints and time domain andsimulation Limit for Cycles a system with a limit cycle. The<br />
phase portrait (a) shows the states of the solution plotted for <strong>di</strong>fferent initial con<strong>di</strong>tions. The<br />
limit cycle corresponds to a closed loop trajectory. The simulation (b) shows a single solution<br />
An equilibrium point of a dynamical system represents a stationary con<strong>di</strong>tion for<br />
plotted as a function of time, with the limit cycle correspon<strong>di</strong>ng to a steady oscillation of<br />
fixedthe amplitude. dynamics. We say that a state xe is an equilibrium point for a dynamical system<br />
dx<br />
= F(x)<br />
We consider the open loop dynamics by settingdt u = 0. The equilibrium points<br />
for the system are given by<br />
if F(xe) = 0. If a dynamical<br />
⎧<br />
system has an initial con<strong>di</strong>tion x(0) = xe, then it will<br />
xe stay at the equilibrium point: = ⎪⎩ x(t) = xe for all t ≥ 0, where we have taken t0 = 0.<br />
Equilibrium points are one of the most important features of a dynamical system<br />
since they define the states correspon<strong>di</strong>ng to constant operating con<strong>di</strong>tions. A<br />
dynamical system can have zero, one or more equilibrium points.<br />
Example 4.4 Inverted pendulum<br />
Consider the inverted pendulum in Figure 4.4, which is a part of the balance system<br />
we considered in Chapter 2. The inverted pendulum is a simplified version of the<br />
±nπ<br />
⎫<br />
⎪⎭ ,<br />
0<br />
where n = 0, 1, 2,.... The equilibrium points for n even correspond to the pendulum<br />
pointing up and those for n odd correspond to the pendulum hanging down. A<br />
phase portrait for this system (without corrective inputs) is shown in Figure 4.4c.<br />
The phase portrait shows −2π ≤ x1 ≤ 2π, so five of the equilibrium points are<br />
shown. ∇<br />
Nonlinear systems can exhibit rich behavior. Apart from equilibria they can also<br />
2<br />
1<br />
!1
Analisi (3/4): Sistemi non autonomi e a tempo <strong>di</strong>screto<br />
Sistema a regime<br />
Funzioni <strong>di</strong> trasferimento<br />
Trasformata Zeta<br />
Analogie e <strong>di</strong>fferenze tra modelli<br />
a tempo continuo e <strong>di</strong>screto<br />
4 CHAPTER 1. INTRODUCTION<br />
noise<br />
<br />
Actuators<br />
external <strong>di</strong>sturbances<br />
Clock<br />
System Sensors<br />
D/A Computer A/D<br />
Controller<br />
operator input<br />
76 CHAPTER 3. EXAMPLES<br />
Figure 1.3: Components of a computer-controlled system. The upper dashed box represents<br />
the process dynamics, which include the sensors and actuatorsProcessor in ad<strong>di</strong>tion load to the dynamical<br />
system being controlled. Noise and external <strong>di</strong>sturbances can perturb the dynamics −1 of the<br />
process. The controller is shown in the lower dashed box. It consists of a filter and analog-to<strong>di</strong>gital<br />
(A/D) and <strong>di</strong>gital-to-analog (D/A) converters, as well as MaxClients a computer that implements<br />
the control algorithm. A system clock controls Idlethe<br />
operation of the controller, synchronizing<br />
the A/D, D/A and computing processes. The operator input is also fed to the computer Control as an<br />
external incoming input.<br />
requests<br />
KeepAlive<br />
accept<br />
Wait Busy<br />
queue<br />
−1<br />
outgoing<br />
Memory usage<br />
A modern data controller senses the operation of a system, compares it against the<br />
desired behavior, computes corrective actions based on a model of the system’s<br />
Client Servers<br />
response to external inputs and actuates the system to effect the desired change.<br />
This basic Figure feedback 3.11: Feedback loop ofcontrol sensing, of acomputation web server. Connection and actuation requests arrive is theoncentral an inputcon queue,<br />
cept in control. where theyThe are sent keytoissues a serverinprocess. designing A finitecontrol state machine logickeeps are track ensuring of the that state of the the<br />
dynamics in<strong>di</strong>vidual of the closed server processes loop system and responds are stable to requests. (bounded A control <strong>di</strong>sturbances algorithmgive canbounded mo<strong>di</strong>fy the<br />
errors) and server’s thatoperation they have by controlling ad<strong>di</strong>tional parameters desired behavior that affect its (good behavior, <strong>di</strong>sturbance such as theattenua maximum<br />
number of requests that can be serviced at a single time (MaxClients) or the amount of<br />
tion, fast responsiveness to changes in operating point, etc). These properties are<br />
time that a connection can remain idle before it is dropped (KeepAlive).<br />
established using a variety of modeling and analysis techniques that capture the<br />
essential dynamics of the system and permit the exploration of possible behaviors<br />
Filter<br />
noise<br />
<br />
Process<br />
Output<br />
Ref
Analisi (4/4): Modelli Biologici Compartimentali<br />
3.6. DRUG ADMINISTRATION 87<br />
u<br />
V1<br />
b0<br />
k0<br />
k1<br />
k2<br />
V2<br />
(a) Two compartment model<br />
Modelli per sistemi biologici<br />
Proprietà fondamentali<br />
dc1<br />
V1<br />
V2<br />
k03<br />
V3<br />
k31<br />
k13<br />
u1<br />
V1<br />
k64 k54<br />
k06<br />
k05<br />
V6<br />
V4<br />
V5<br />
k46 k45<br />
88 C<br />
b4<br />
u4<br />
b1<br />
k21<br />
k12<br />
(b) Thyroid hormone model<br />
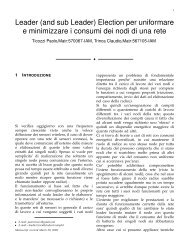
Figure 3.18: Schematic <strong>di</strong>agrams of compartment models. (a) A simple two-compartment<br />
model. Each compartment is labeled by its volume, and arrows in<strong>di</strong>cate the flowGlucose of chemical Pancreas<br />
into, out of and between compartments. (b) A system with six compartments used to study<br />
Insulin<br />
the metabolism of thyroid hormone [God83]. The notation kij denotes the transport from<br />
compartment j to compartment i.<br />
Liver<br />
Stomach<br />
Stomach Tissue<br />
Pancreas<br />
Glucose<br />
in blood<br />
Large<br />
Small<br />
volumes of the compartments. The mass intestine balances for the compartments intestine Liver are Tissue<br />
dt = q(c2 − c1) − q0c1 + c0u, c1 ≥ 0,<br />
dc2<br />
dt = q(c1<br />
0<br />
0<br />
− c2), (a) c2Relevant ≥ 0, body organs<br />
(3.26)<br />
(b) Schematic <strong>di</strong>agram (c) In<br />
Figure 3.19: Insulin–glucose dynamics. (a) Sketch of body parts invol<br />
V2<br />
k02<br />
Glucose [mg/dl]<br />
Insulin [µU/ml]<br />
400<br />
200<br />
0<br />
0<br />
100<br />
50
Identificazione (1/5): Identificabilità<br />
Dai dati e’ possibile ricavare<br />
α1, α2, β1<br />
Impossibile ricavare i parametri<br />
V2, k21, k20 in maniera univoca<br />
Causa 1: numero parametri ><br />
numero equazioni<br />
Causa 2: modelli non-lineari nei<br />
parametri
Identificazione (2/5): Stima ai minimi quadrati<br />
Simile a trovare soluzione <strong>di</strong> equazioni lineari<br />
Ax = b<br />
Estensione a caso con residui pesati<br />
Problema non-convesso se il sistema è<br />
non-lineare nei parametri
Identificazione (3/5): Stima a massima verosimiglianza<br />
Modello probabilistico dei dati<br />
Si massimizza la verosimiglianza dei<br />
dati in base al valore dei parametri<br />
Problema tipicamente non-convesso
Identificazione (3/5): Stima a massima verosimiglianza<br />
Modello probabilistico dei dati<br />
Si massimizza la verosimiglianza dei<br />
dati in base al valore dei parametri<br />
Problema tipicamente non-convesso
Identificazione (4/5): Stima Bayesiana<br />
Usa informazione a priori<br />
Minimizza errore quadratico me<strong>di</strong>o<br />
Ottimo si ottiene tramite calcolo <strong>di</strong> un integrale<br />
Tutti gli stimatori (MQ,MV,MAP,Bayes) sono in genere <strong>di</strong>fferenti<br />
Se i rumori(densità) sono gaussiani e ad<strong>di</strong>tivi =⇒ θMQ = θMV<br />
Se non c’è informazione a-priori (p(θ) = cost) =⇒ θMV = θMAP<br />
Se densità a-posteriori è simmetrica =⇒ θMAP = θB
Identificazione (5/5): Deconvoluzione<br />
Si vuole ricostruire ingresso u(t)<br />
Problema tipico in me<strong>di</strong>cina e biologia<br />
Raw deconvolution e ingresso vero del sistema! Raw deconvolution e ingresso vero del sistema<br />
2<br />
1<br />
1.5<br />
0.8<br />
1<br />
0.6<br />
Raw deconvolution e ingresso vero del sistema! Raw deconvolution e ingresso vero del sistema<br />
0.5<br />
2<br />
0 1<br />
0.4<br />
1.5<br />
Problema <strong>di</strong> inversione 0.2<br />
-0.5 0.8<br />
1<br />
-1<br />
0<br />
0.6<br />
0.5<br />
0 100 200 300 400 500 600 700 800 900 1000 0 100 200 300 400 500 600 700 800 900 1000<br />
t<br />
0.4 t<br />
0<br />
riconvoluzione e dati!<br />
riconvoluzione e dati<br />
Malcon<strong>di</strong>zionato: molto sensibile ai<br />
200 0.2<br />
-0.5<br />
-1<br />
150<br />
150 0<br />
100 200 300 400 500 600 700 800 900 1000 0 100 200 300 400 500 600 700 800 900 1000<br />
t<br />
t<br />
100<br />
100<br />
riconvoluzione e dati!<br />
riconvoluzione e dati<br />
rumori <strong>di</strong> misura e non-unicità della<br />
200<br />
50<br />
50<br />
150<br />
150<br />
0<br />
soluzione<br />
0 100 200 300 400 500 600 700 800 900 1000 0 100 200 300 400 500 600 700 800 900 1000<br />
t<br />
100 t<br />
100<br />
residui pesati!<br />
residui pesati!<br />
2<br />
2 50<br />
50<br />
1<br />
1<br />
0<br />
Richiede regolarizzazione: penalizzare<br />
0 100 200 300 400 500 600 700 800 900 1000 0 100 200 300 400 500 600 700 800 900 1000<br />
t<br />
t<br />
0<br />
0<br />
residui pesati!<br />
residui pesati!<br />
2<br />
2<br />
-1<br />
-1<br />
“osciillazioni" ingresso a <strong>di</strong>scapito <strong>di</strong><br />
1<br />
1<br />
-2<br />
0 100 200 300 400 500 600 700 800 900 1000<br />
-2<br />
0 100 200 300 400 500 600 700 800 900 1000<br />
t<br />
0 t<br />
0<br />
errori sulla pre<strong>di</strong>zione <strong>di</strong> y mis<br />
k .<br />
unità <strong>di</strong> misura<br />
unità <strong>di</strong> misura<br />
res/SD<br />
unità <strong>di</strong> misura<br />
unità <strong>di</strong> misura<br />
res/SD<br />
unità <strong>di</strong> misura<br />
unità <strong>di</strong> misura<br />
res/SD<br />
-1<br />
-2<br />
0 100 200 300 400 500 600 700 800 900 1000<br />
t<br />
unità <strong>di</strong> misura<br />
unità <strong>di</strong> misura<br />
res/SD<br />
-1<br />
-2<br />
0 100 200 300 400 500 600 700 800 900 1000<br />
t
Programma del corso (1/2)<br />
Modellizzazione (Prof. Schenato):<br />
Definizioni <strong>di</strong> classi <strong>di</strong> modelli matematici per sistemi <strong>di</strong>namici:<br />
lineari/non-lineari, tempo continuo/<strong>di</strong>screto, autonomi/con ingresso,<br />
tempo varianti/invarianti, deterministici/stocastici, scatola<br />
bianca/grigia/nera<br />
Esempi <strong>di</strong> sistemi <strong>di</strong>namici <strong>di</strong> natura <strong>di</strong>fferente: meccanici, biologici,<br />
elettronici, telecomunicazioni<br />
Analisi (Prof. Bisiacco):<br />
Modelli a tempo continuo in spazio <strong>di</strong> stato: analisi modale, forma <strong>di</strong><br />
Jordan<br />
Stabilità: per sistemi lineari (analisi modale) e sistemi non-lineari<br />
(Teoria <strong>di</strong> Lyapunov)<br />
Modelli lineari a tempo <strong>di</strong>screto<br />
Modelli biologici compartimentali
Programma del corso (2/2)<br />
Identificazione (Prof. Schenato):<br />
Identificabilità per sistemi lineari (funzione <strong>di</strong> trasferimento) e<br />
non-lineari (espansione <strong>di</strong> Taylor)<br />
Stima ai minimi quadrati (MQ): standard, pesati, non-lineari con<br />
ricerca <strong>di</strong> Gauss-Newton<br />
Stima a massima verosimiglianza (MV): matrice <strong>di</strong> Fisher, limite <strong>di</strong><br />
Cramér-Rao<br />
Stima Bayesiana (B): informazione a-priori, stimatore a minima<br />
varianza<br />
Interpretazione statistica <strong>degli</strong> stimatori MQ, MV, B<br />
Deconvoluzione per la stima <strong>di</strong> segnali <strong>di</strong> ingresso da uscite<br />
campionate e rumorose<br />
Esercitazioni:<br />
Laboratori Matlab<br />
Preparazioni al compito
Note a margine<br />
Ringraziamenti<br />
Questi luci<strong>di</strong> sono liberamente ispirati ai luci<strong>di</strong> del corso <strong>di</strong><br />
“Identificazione dei modelli e analisi dei dati” del Prof. Giuseppe De<br />
Nicolao (<strong>Università</strong> <strong>di</strong> Pavia).<br />
Alcune delle figure sono state riprese dal testo K. Astrom, R. Murray<br />
“Feedback Systems”.<br />
Informazioni sui docenti<br />
Prof. Mauro Bisiacco:<br />
http://automatica.dei.unipd.it/people/bisiacco.html<br />
Prof. Clau<strong>di</strong>o Cobelli:<br />
http://www.dei.unipd.it/∼cobelli/<br />
Prof. Luca Schenato:<br />
http://automatica.dei.unipd.it/people/schenato.html<br />
Prof.ssa Gianna Toffolo:<br />
http://www.dei.unipd.it/∼toffolo